Solana adoption takes a new direction as SOL price eyes a new all-time high at $60
- Solana price is grappling with the $44.14 resistance level, preventing it from climbing higher.
- Wormhole and Solana-based Mango Markets are the latest developments that take adoption to a new level.
- A breakdown of the August 9 swing low at $36.35 will invalidate the bullish thesis.

Solana price is facing one of two critical resistance barriers preventing it from setting up a new all-time high. The recovery of SOL has been an impressive feat as it ponders the next leg-up.
Adoption and cross-chain communication
Mango Markets Decentralized Exchange (DEX) reported having raised $70 million in a token sale on August 11. The Solana-based DEX had, at one point, raised roughly $500 million in exchange for the MNGO token, but eventually only $70.5 million remained.
The raised funds will go to the project’s DAO insurance fund, which will serve as a backstop for the lenders on the platform if things go awry.
Additionally, the adoption of SOL ecosystem is now taking a new turn with Wormhole, a bridge that allows networks like Solana, Ethereum, Terra and Binance Smart Chain to communicate with each other. The developers claim that this connection is simpler and faster and will allow cryptocurrency assets like tokens, price data, NFTs, governance decisions and others to seamlessly communicate with other blockchains, which otherwise would be disconnected.
This cross-chain messaging platform could allow the transfer of cross-chain liquidity with Solana’s ecosystem, including Serum.
While Solana-based projects were in full bloom during the recent bull run, things might return to a similar state if Solana price restarts a new bull rally. Technicals indicate that a new all-time high is plausible if SOL shatters two critical resistance barriers.
Solana price at inflection point
Solana price is currently grappling with the $44.14 resistance level after a failed attempt on August 11. A decisive 12-hour candlestick close above this barrier will open the path for a 10% upswing to the next supply zone at $48.68.
If the buying pressure continues to build up, leading to a successful breach of $48.68, Solana price will have a resistance-free path up to the range high, coinciding with the all-time high at $58.5.
Therefore, clearing $48.68 not only provides SOL with the opportunity to retest the current all-time high but setting up a new all-time high as well.
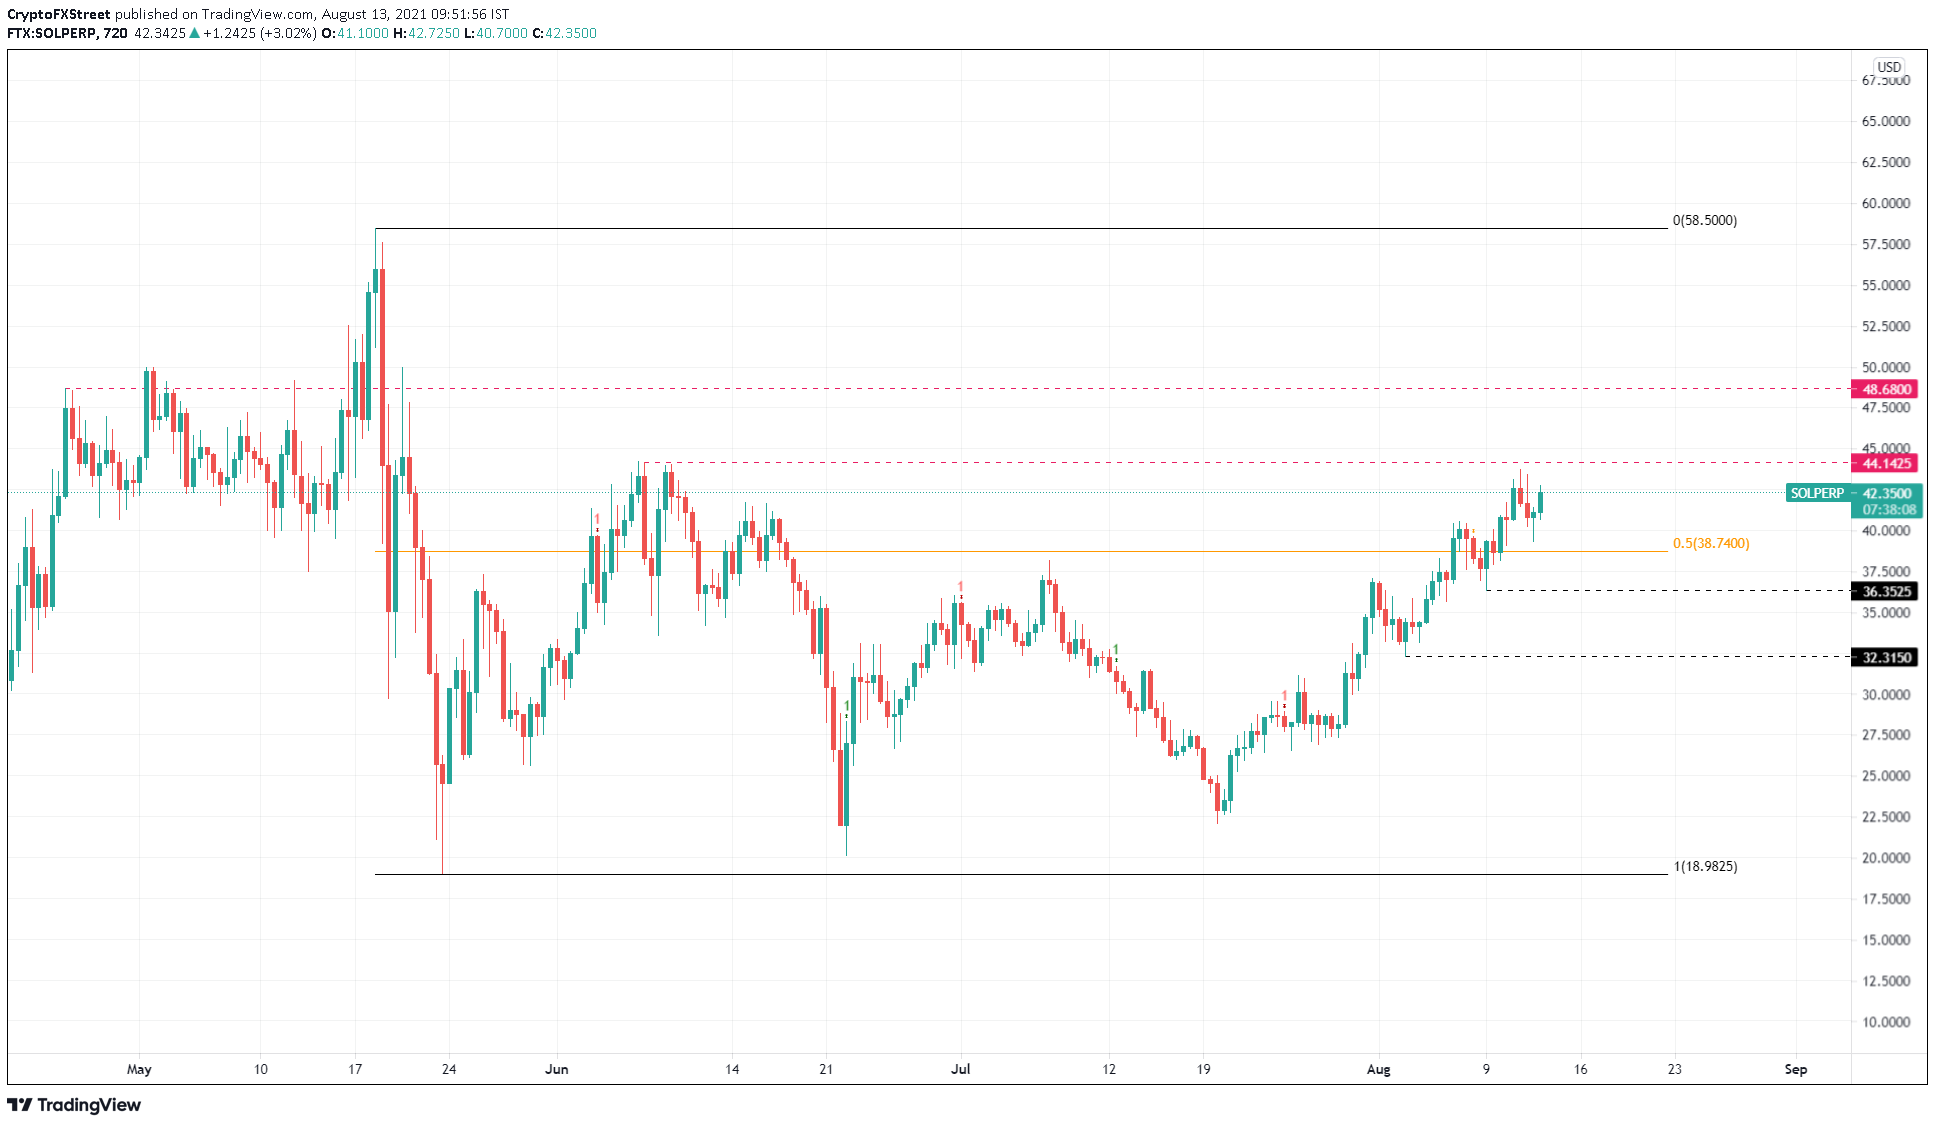
SOL/USDT 12-hour chart
On the flip side, if Solana price fails to shatter $44.12, it will indicate weakness and trigger a downswing to the trading range’s 50% Fibonacci retracement level at $38.74.
Increased selling pressure might knock SOL to the subsequent barriers at $36.35, a breakdown of which will invalidate the bullish thesis as it would create a lower low.
Further persistence of ask orders will drag Solana price to $32.32.
Author

Akash Girimath
FXStreet
Akash Girimath is a Mechanical Engineer interested in the chaos of the financial markets. Trying to make sense of this convoluted yet fascinating space, he switched his engineering job to become a crypto reporter and analyst.


