Shiba Inu price weakens as SHIB bears target 28% decline
- Shiba Inu price could drop another 28% as the bears kickstart a sell-off.
- The canine-themed token sliced below $0.00002492, a critical line of defense and the lower boundary of the prevailing chart pattern.
- A technical indicator suggests that there are significantly more sellers than buyers in the market.

Shiba Inu price has put a 28% descent on the radar following a break below a crucial level of support. The bearish chart pattern has indicates that SHIB bears are planning a deep plunge toward $0.00001600.
Shiba Inu price risk skewed to the downside
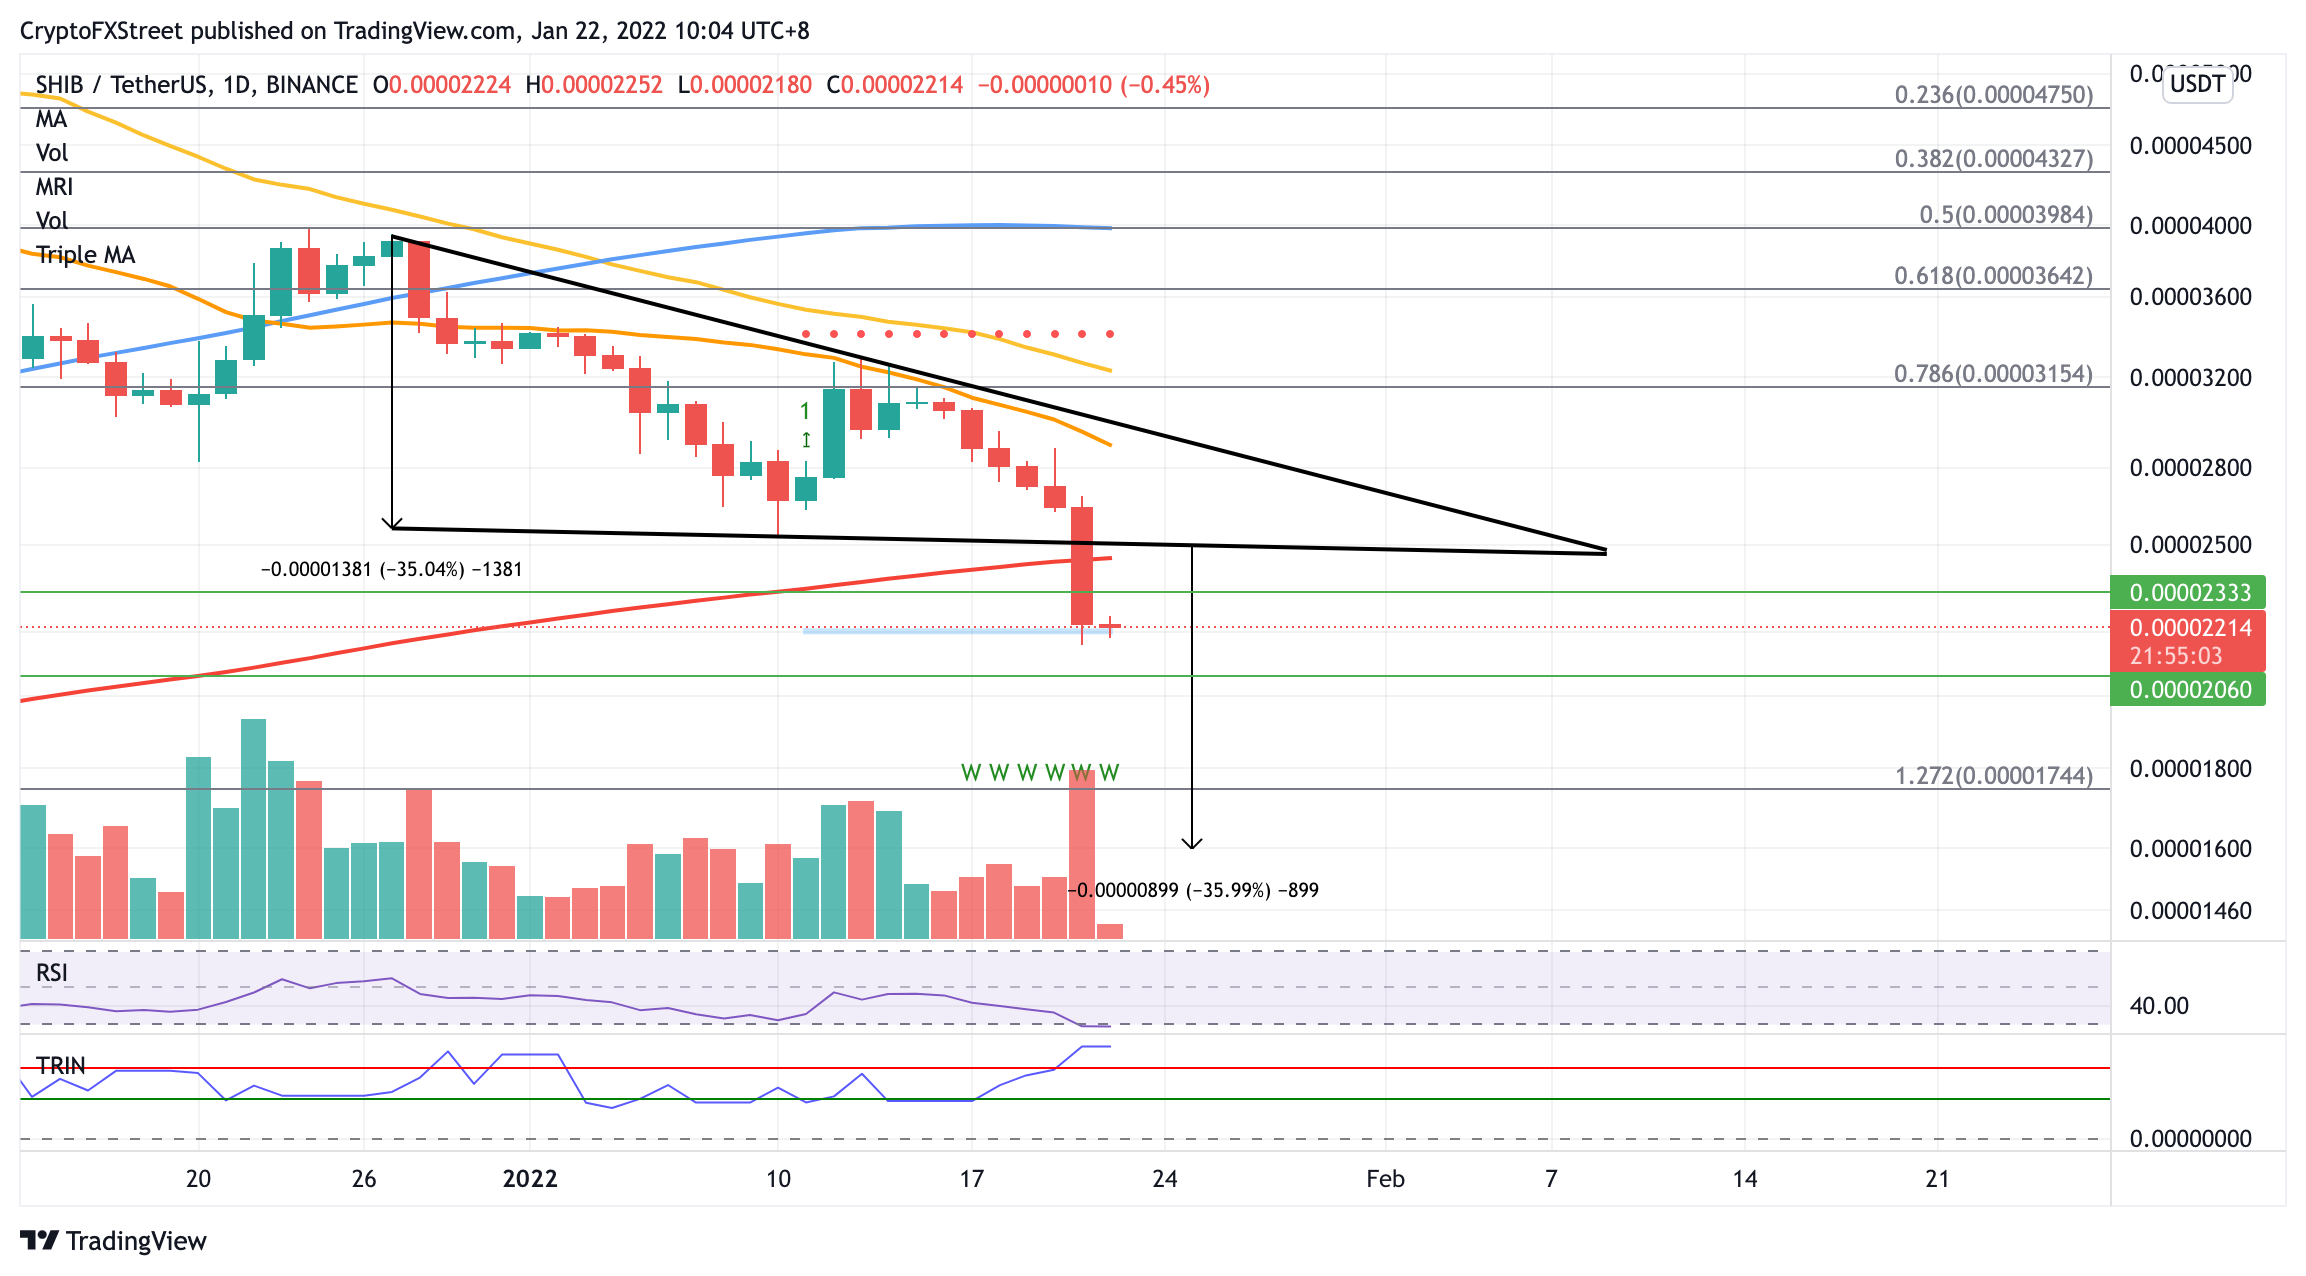
Shiba Inu price has sliced below the lower boundary of the descending triangle pattern at $0.00002492 on the daily chart, suggesting a pessimistic forecast of a 35% decline toward $0.00001600.
The Arms Index (TRIN) which gauges overall market sentiment suggests that there is a massive increase in sellers than buyers in the market.
The canine-themed token has already kickstarted a descent as selling pressure significantly increased, and SHIB is still awaiting a 28% fall toward the aforementioned pessimistic target.
Additional footholds will appear at the October 8 low at $0.00002060, then at the 127.2% Fibonacci extension level at $0.00001744 before dropping toward the pessimistic target.
However, if buying pressure increases, Shiba Inu price may face an immediate obstacle at the October 15 low at $0.00002333 before meeting another hurdle at the 200-day Simple Moving Average (SMA) at $0.00002449, near the lower boundary of the governing technical pattern.
SHIB/USDT daily chart
Shiba Inu price may be confronted with another resistance at the 21-day SMA at $0.00002987, coinciding with the upper boundary of the prevailing chart pattern.
Shiba Inu price may face an additional hurdle at the 78.6% Fibonacci retracement level at $0.00003154 before meeting another challenge at the 50-day SMA at $0.00003305, which sits near the resistance line given by the Momentum Reversal Indicator (MRI).
Author

Sarah Tran
Independent Analyst
Sarah has closely followed the growth of blockchain technology and its adoption since 2016.