Shiba Inu Price Forecast: A 31% crash awaits should SHIB lose this critical support level
- Shiba Inu price has been trending downward since the end of December, extending the decline to $0.00000875.
- The rounding top pattern formed by SHIB indicates a bearish outlook, implying a 31% correction is likely.
- Heavy bearishness on the price indicators, as well as a lack of supporting cues from the broader market, suggest further drawdown is possible.

Shiba Inu price is nearing a crucial bearish reversal, and a confirmation of the same would mean that the meme coin should note a significant decline over the coming days. If this drawdown is completed successfully and SHIB reaches the target price, a new all-time low will be formed.
Shiba Inu price under bearish threat
Shiba Inu price is currently forming a rounding top pattern after rallying throughout December and initiating a decline toward the end of it that extended over the past three weeks. The meme coin nearly ensured that the pattern would fail, but it failed to breach the $0.00000968 barrier marked as the stop loss.
As it failed the breakthrough, the meme coin corrected to fall to the retest line at $0.00000846, trading above it at the time of writing. Now, if the Shiba Inu price falls through this retest line, the rounding top pattern will be validated, and SHIB will be susceptible to a decline.
A rounding top is a bearish reversal pattern that signals a potential shift in the prevailing trend. As the rounding top develops, trading volumes often decline, indicating diminishing enthusiasm from buyers, which is the case with Shiba Inu at the moment.
The pattern is confirmed when the price breaks below the aforementioned retest level at the bottom of the rounding formation. This fall signals a shift from bullish sentiment to potential bearish momentum, and traders may anticipate a trend reversal.
This fall will likely extend into a crash, and based on the pattern, the target price is marked at $0.00000584, which would result in a 31% correction. If this level is tagged, not only would the pattern be successful, but Shiba Inu price would also note its new all-time low.
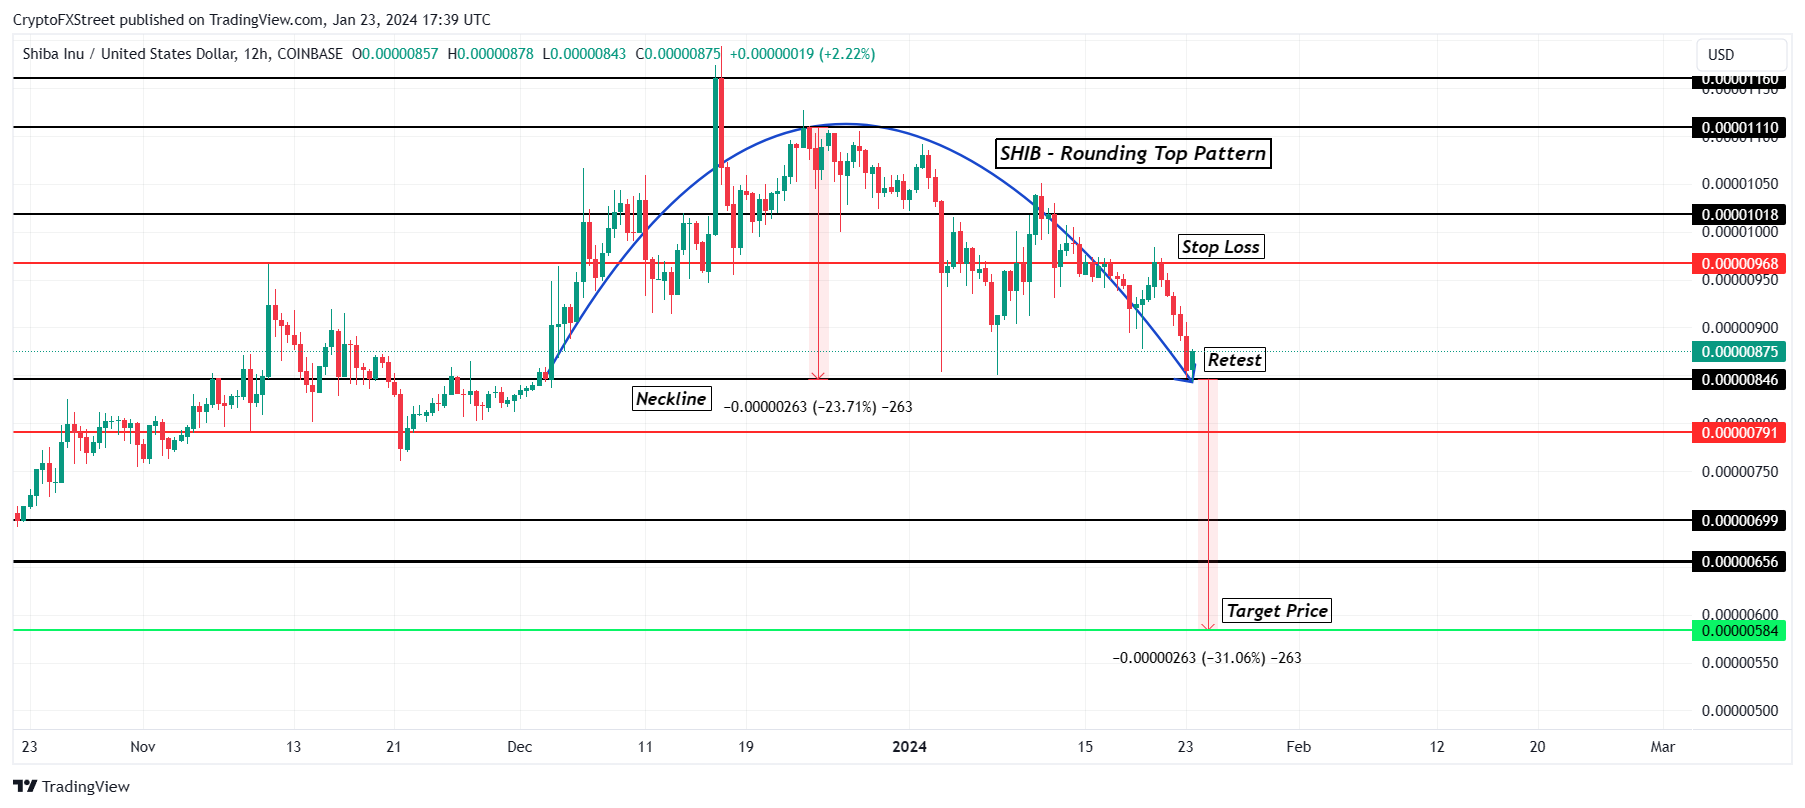
SHIB/USD 12-hour chart
Both the Relative Strength Index (RSI) and the Moving Average Convergence Divergence (MACD) are heavily bearish presently, indicating that a decline is not completely out of the question.
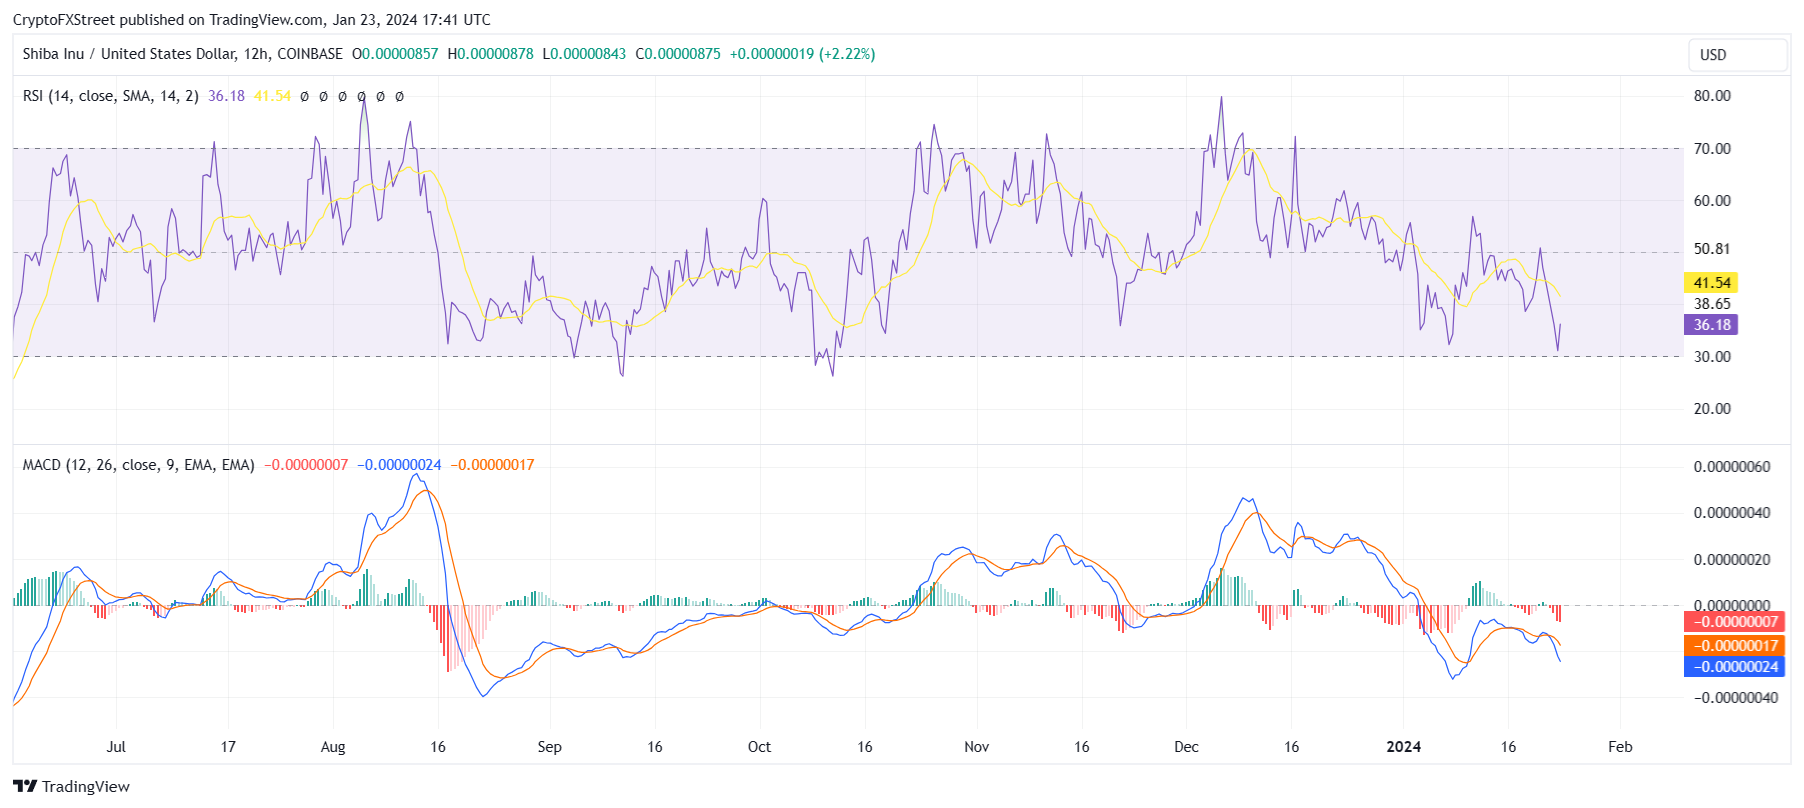
Shiba Inu RSI and MACD
However, if the broader market cues note a reversal due to a surge in demand over low prices, SHIB could bounce back from the retest level and bounce back. A breach of the stop loss at $0.00000968 would invalidate the bearish thesis and enable recovery to $0.00001000 and beyond.
Author

Aaryamann Shrivastava
FXStreet
Aaryamann Shrivastava is a Cryptocurrency journalist and market analyst with over 1,000 articles under his name. Graduated with an Honours in Journalism, he has been part of the crypto industry for more than a year now.


