|

Shiba Inu positioned for buy opportunity, Elliot Wave points to 0.000117 for Shiba

  • Shiba Inu price bounces to return above crucial support levels.
  • Elliot Wave Analysis forecasts a move towards $0.000117 could be just ahead.
  • Certain caveats are required for Shiba Inu to extend higher as downside risks remain.

Shiba Inu price experienced intense buying pressure in the latter part of Friday’s trading session, closing a staggering 37% above the Friday low. However, bulls need to push Shiba Inu above two more resistance zones to confirm a new bullish expansion phase.

Shiba Inu Elliot Wave Analysis indicates Wave 5 has just begun

Shiba Inu price action, while volatile and unpredictable, is almost textbook in nature with how it has traded with regards to the Elliot Wave Theory. Operating on the supposition that Wave 4 ended right on the 61.8% Fibonacci retracement at $0.000043, the future price range that Wave 5 could likely terminate can be forecasted. For those who would argue that the Friday low at the 61.8% Fibonacci retracement doesn’t qualify as a Wave 4, I would ask those critics to remember the rule: Wave 4 cannot exceed Wave 3. Wave 4 does not often extend beyond 50% of Wave 3 – but that is a guideline, not the rule.

The Wave 5 target for Shiba Inu price is $0.000117 is based on the 161.8% inverse Fibonacci retracement of Wave 4. However, to reach that value area, Shiba Inu must close at or above $0.000067. A close above $0.000067 would return Shiba Inu into a complete bullish expansion phase within the Ichimoku Kinko Hyo. Additionally, the close would be above the Friday swing high and above the second-highest volume node in the volume profile.
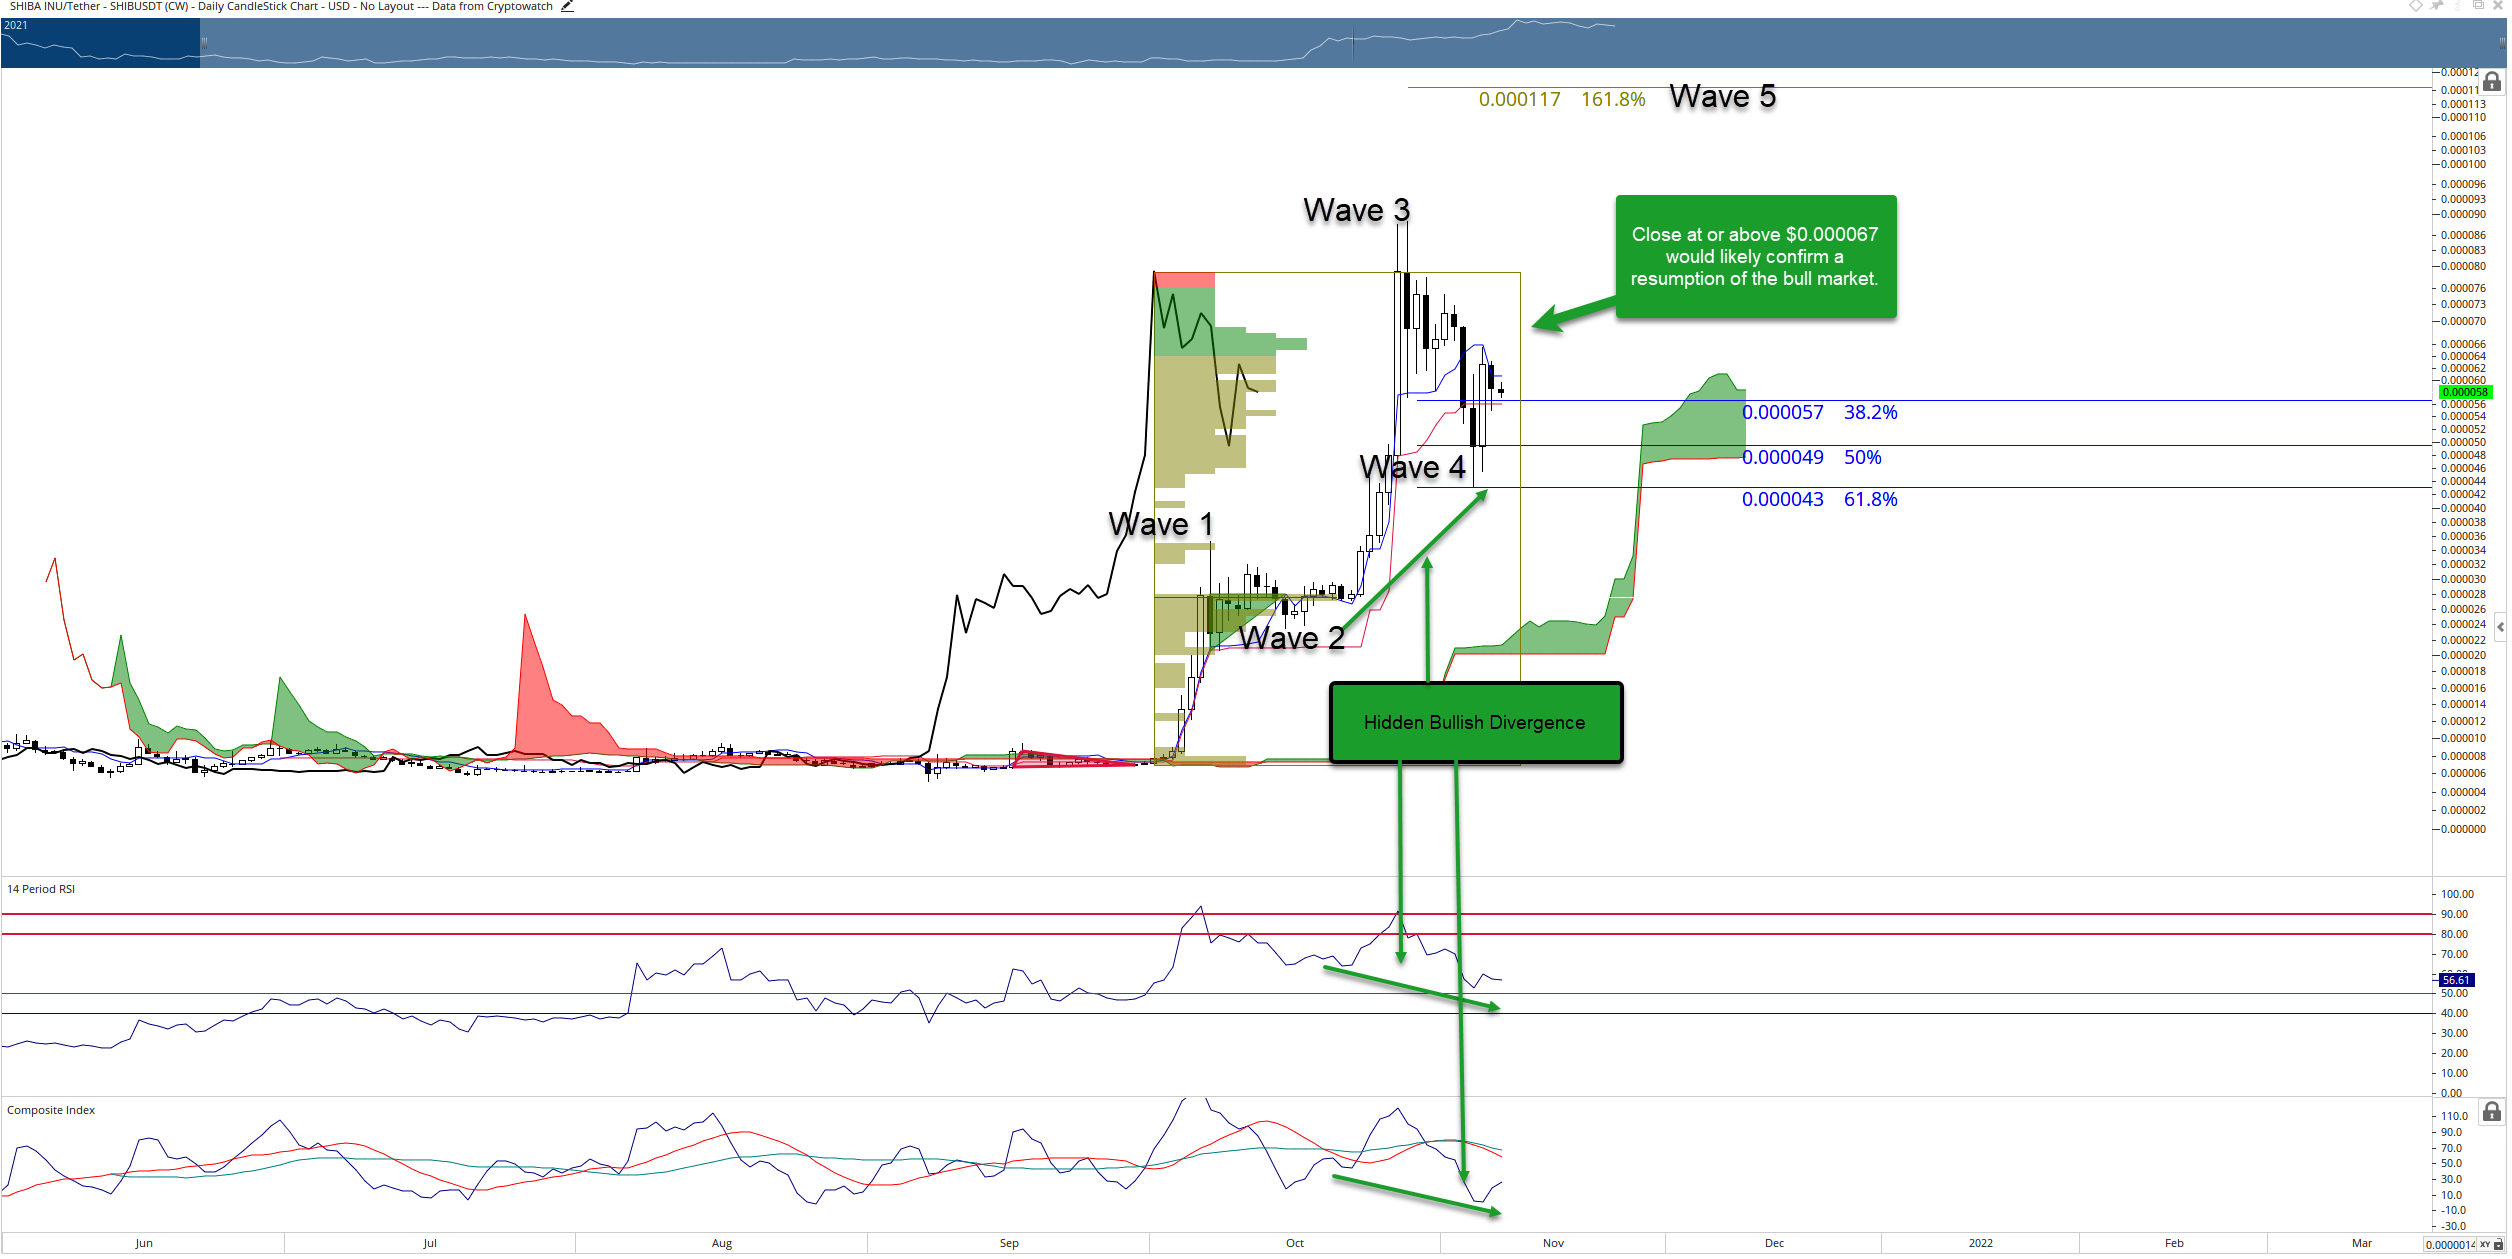
If Shiba Inu price is close to $0.000067, the oscillators will significantly support the bullish bias. Hidden bullish divergence is present in the Relative Strength Index, while the RSI is just above the first oversold condition. Likewise, the Composite Index shows hidden bullish divergence while trading near a support zone within that oscillator.

SHIBA/USDT Daily Ichimoku Chart

While the current setup for Shiba Inu price is leaning heavily on the bullish side, downside risks remain. Invalidation of the current bullish bias will occur if buyers cannot push Shiba Inu to $0.000067. An early warning sign that a deeper corrective move could be coming is any daily close below 50% Fibonacci retracement of at $0.000049.

Author

Jonathan Morgan

Jonathan Morgan

Independent Analyst

Jonathan has been working as an Independent future, forex, and cryptocurrency trader and analyst for 8 years. He also has been writing for the past 5 years.


More from Jonathan Morgan
Share:

Editor's Picks

Hyperliquid Price Forecast: Downside risk looms as momentum stretches thin

Hyperliquid price is trading in the red on Monday, stalling after 10% gains last week. HYPE-focused Exchange Traded Funds recorded their fifth consecutive weekly inflows, projecting steady institutional demand. The technical outlook for HYPE warns of potential downside risk as bullish momentum stretches thin.

Cardano Price Forecast: Strengthening momentum points to cautious upside extension

Cardano trades around $0.222 on Monday after rallying over 15% last week. Mixed derivatives data and mildly bullish on-chain metrics point to cautious market sentiment. Meanwhile, strengthening momentum indicators suggest ADA could see further gains if the recovery continues.

Crypto Overview: Bitcoin faces sell wall at $82,850 – Jupiter, Zcash rally

Bitcoin price tumbles below $80,000 on Monday amid improved odds of a rate hike with the robust US employment data. Institutional demand holds firm with crypto-focused Exchange Traded Funds recording nearly $1.25 billion in inflows last week. Jupiter and Zcash extend gains over the last 24 hours, leading the broader crypto market rally.

Top 3 Price Prediction: Bitcoin, Ethereum, Ripple – BTC consolidates near recent highs, ETH and XRP defend key bullish supports
Bitcoin (BTC), Ethereum (ETH) and Ripple (XRP) maintain a constructive outlook on Monday after gaining more than 3.4%, 4% and 4.8%, respectively, last week. BTC holds steady near $80,000 while ETH and XRP show resilience and defend key support zones. The price action of these top three cryptocurrencies suggests consolidation or a mild pullback before an upside move.
Bitcoin: Gearing up for a sharp move
Bitcoin (BTC) is trading around $81,000 on Friday, up over 4% so far this week, and awaits a key catalyst that could determine its next directional move. Strong institutional demand is supporting the bullish price action, with spot BTC Exchange Traded Funds (ETFs) on track to record a third straight week of inflows.

