Shiba Inu eyes positive returns in April as SHIB price inches towards $0.000015
- Shiba Inu's on-chain metrics reveal robust adoption, as addresses with balances surge to 1.4 million.
- Shiba Inu's returns stand at a solid 14.4% so far in April, poised to snap a three-month bearish trend from earlier this year.
- SHIB price is approaching $0.000015, buoyed by widespread bullish sentiment in the crypto market and a technical breakout.

Shiba Inu (SHIB) price climbs higher and trades at $0.00001413 at the time of writing on Friday amid a wider bullish outlook in the cryptocurrency market. The second-largest meme coin, with a market capitalization of approximately $8.3 billion, is up more than 2% daily, supported by growing adoption and a strong tailwind.
Shiba Inu's returns soar in April
Shiba Inu's on-chain data shows steady, consistent growth in addresses holding balances, with IntoTheBlock's chart confirming a new all-time high of 1.4 million active addresses. This sustained uptrend underscores expanding network adoption and signals robust investor engagement.
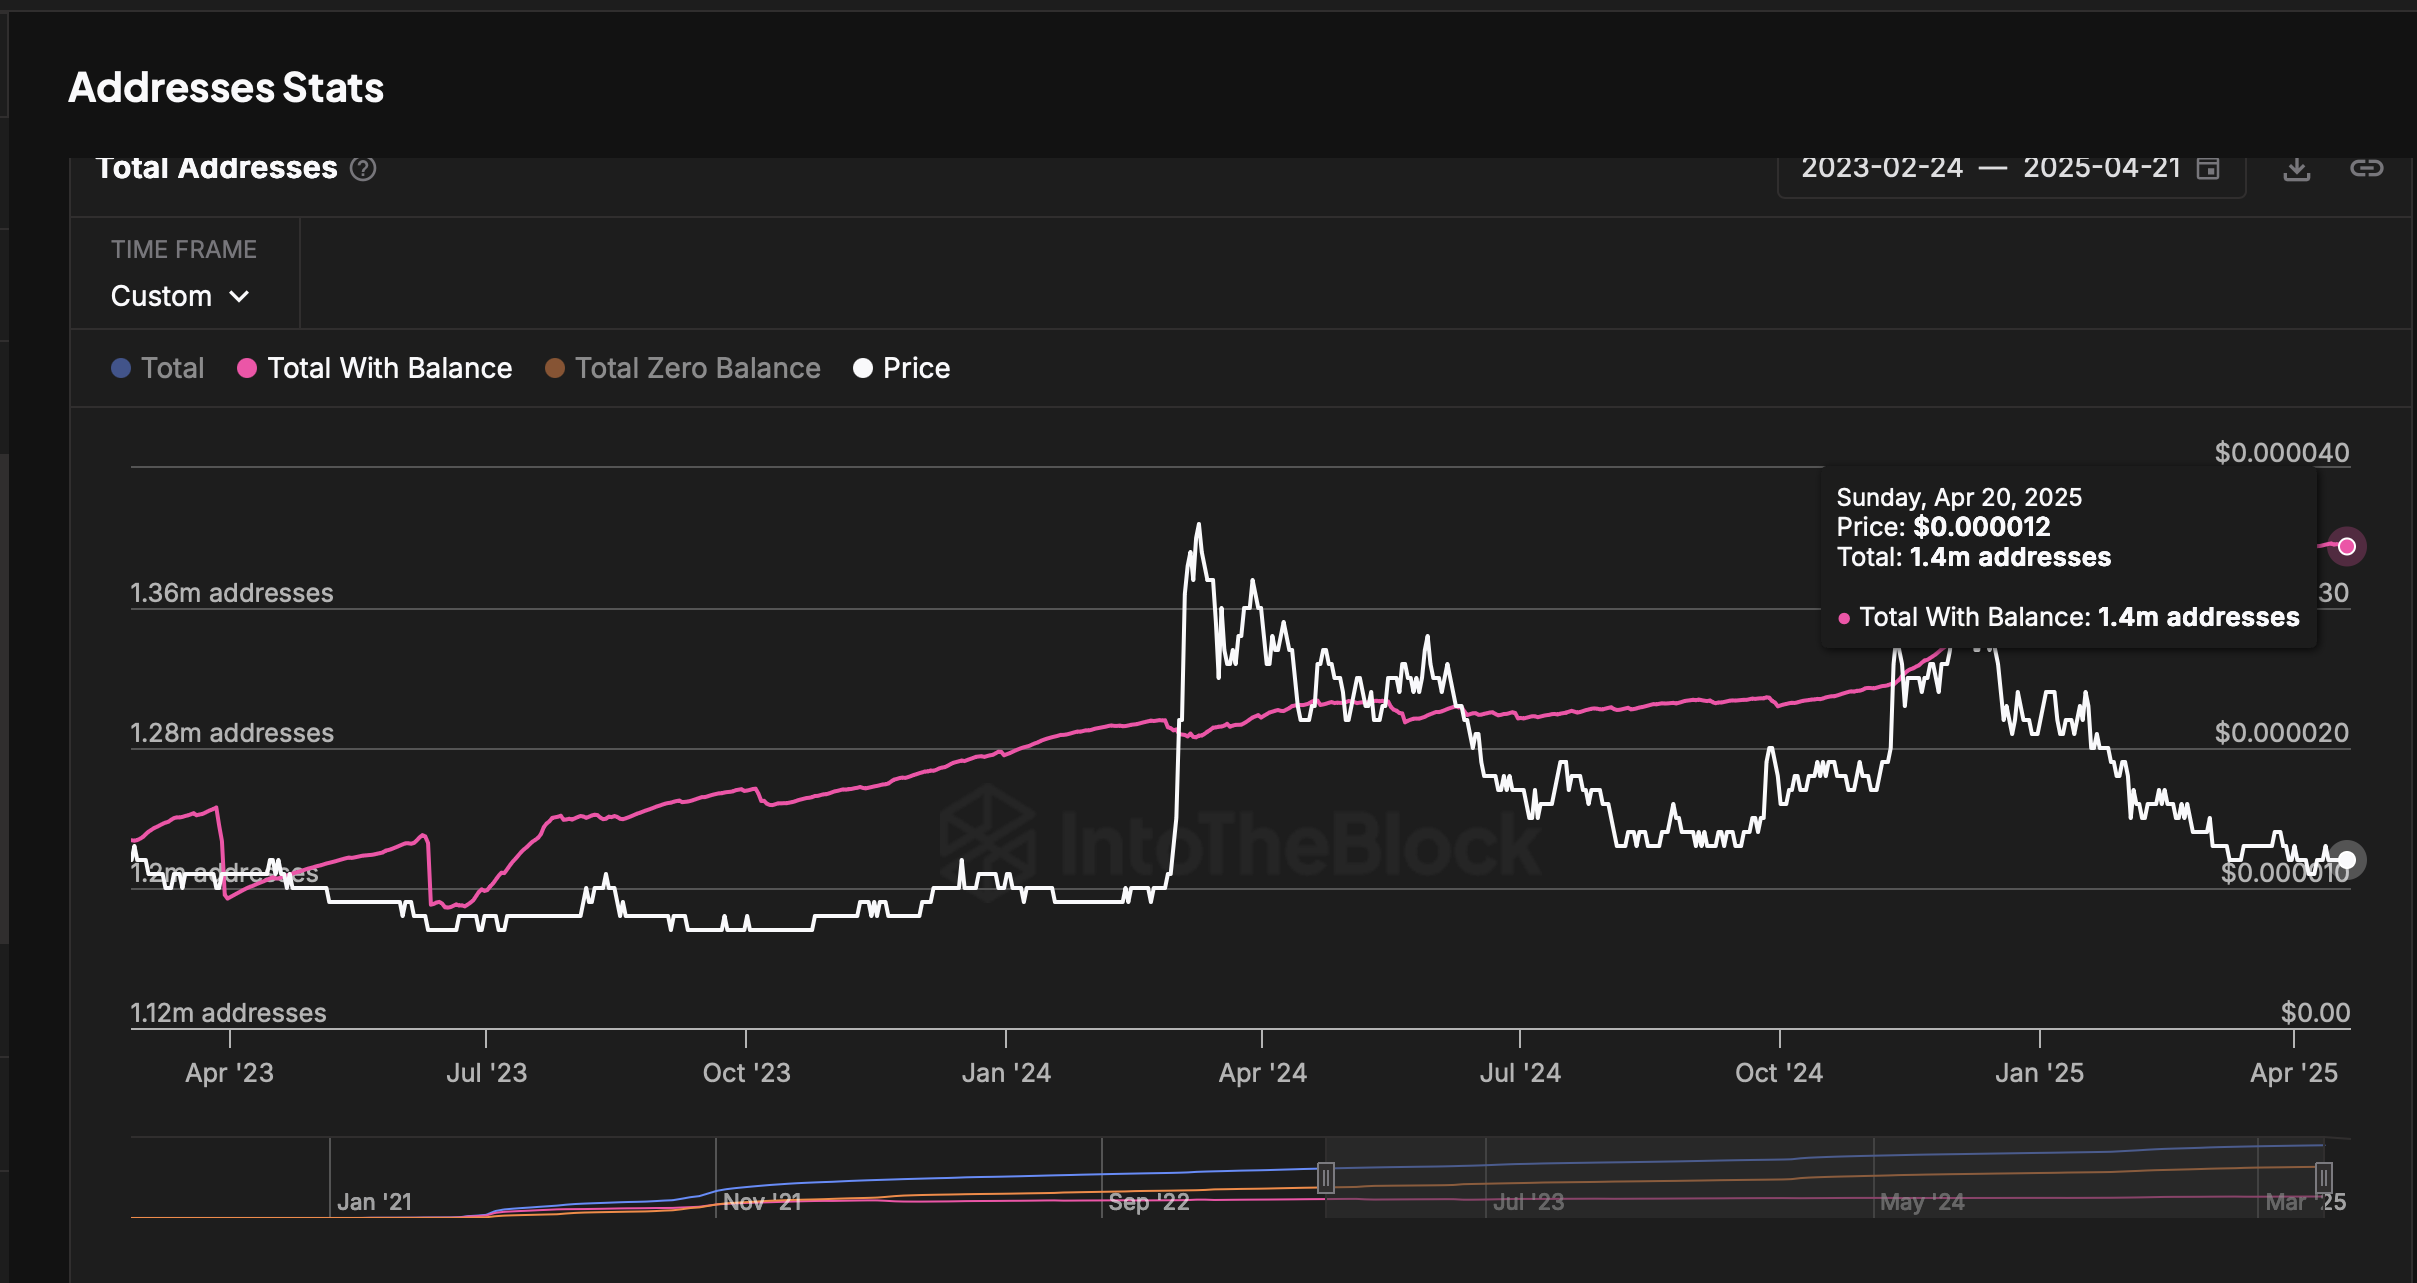
Shiba Inu addresses stats | Source: IntoTheBlock
The bullish streak in the last couple of weeks has been welcomed by SHIB investors, whose portfolios had been heavily battered in the first quarter of the year. According to analytics data by CryptoRank, Shiba Inu posted negative monthly returns of 10.9% in January. This trend continued in February and March, with the returns sliding by 26.1% and 11.1%, respectively.
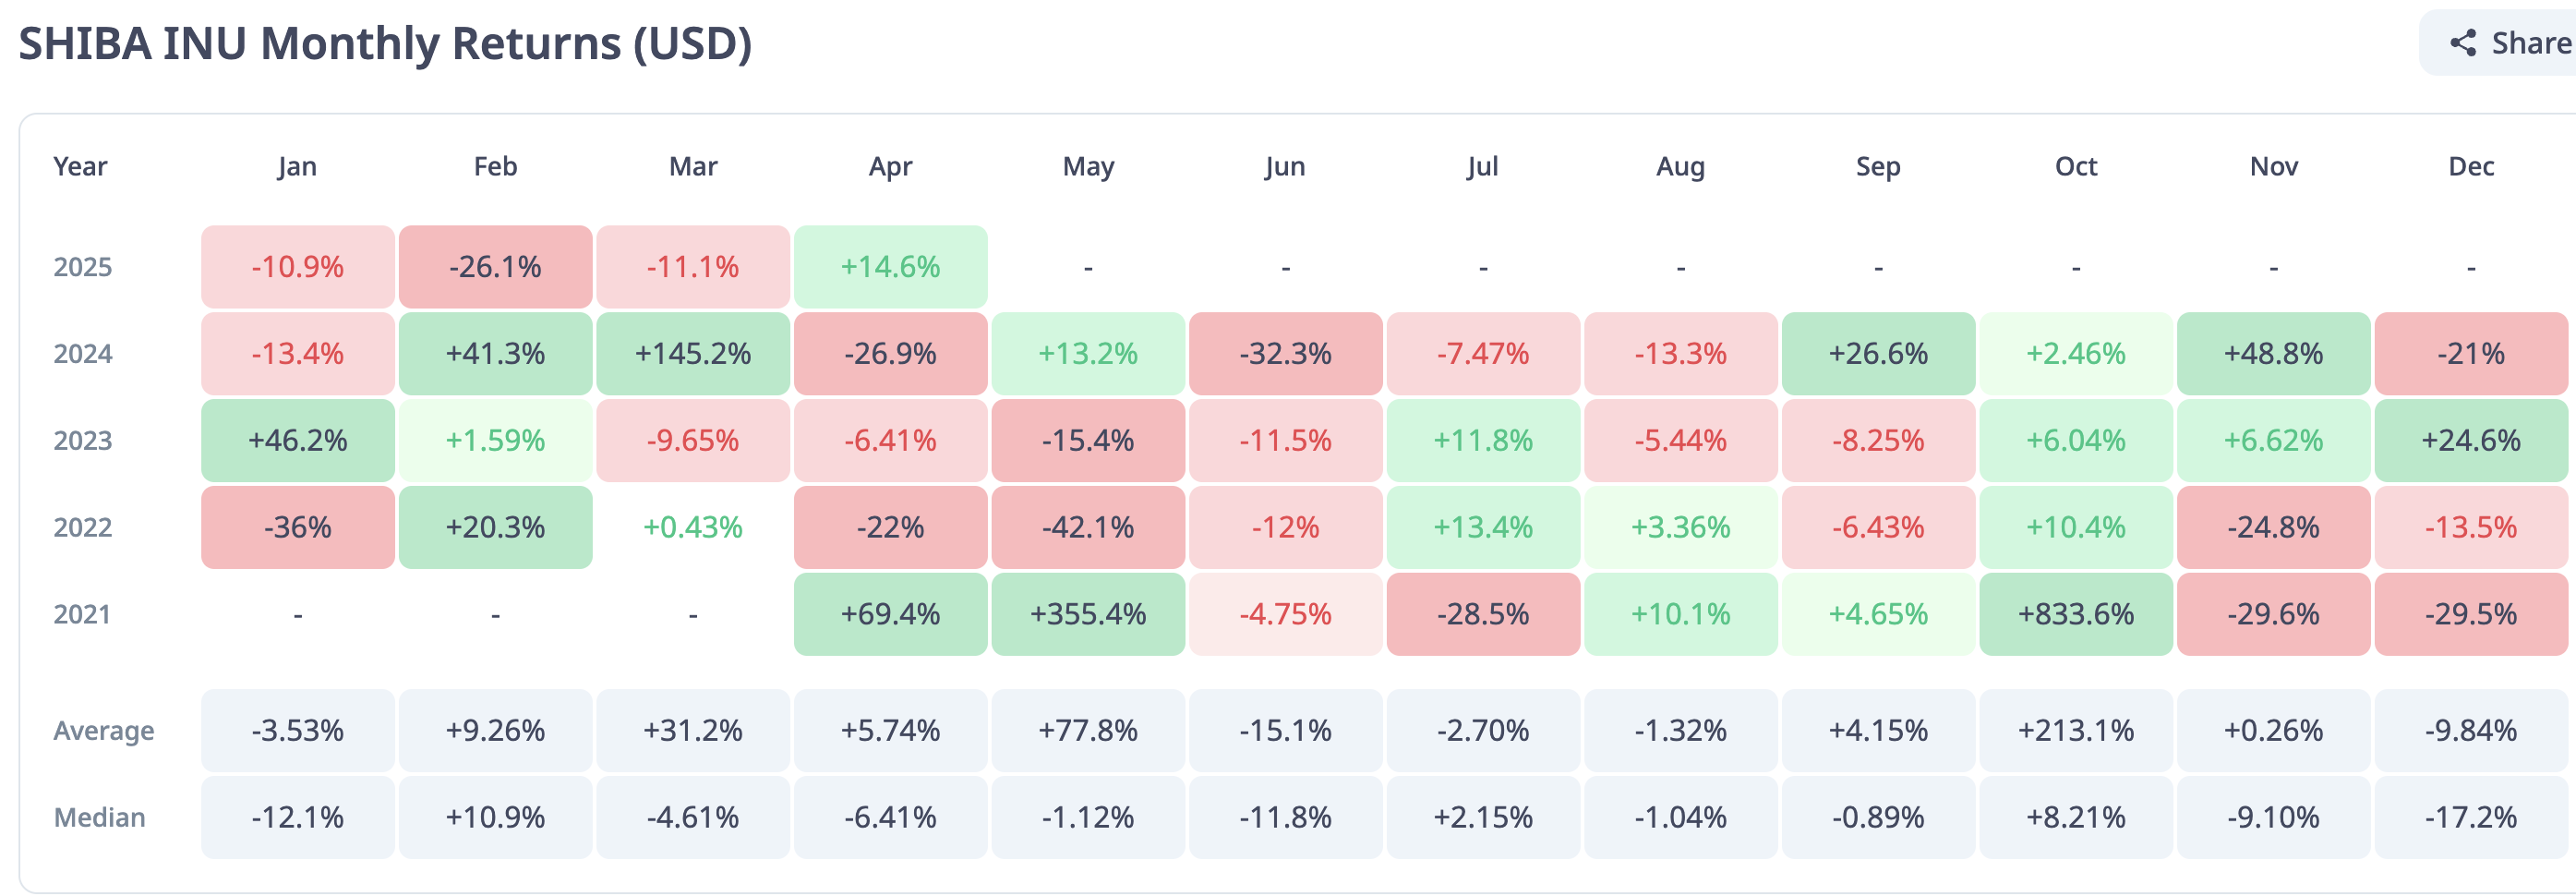
SHIB monthly returns | Source: CryptoRank
Shiba Inu is set to close the month with positive returns, marking SHIB's first April gain in three years. This breakout from a prolonged bearish phase signals a potential shift in market dynamics.
How far could SHIB's uptrend go?
Shiba Inu's price continues to extend its gains, trading at $0.00001413 at the time of writing, signaling growing interest in digital assets and, importantly, meme coins. In addition to a general bullish wave across the wider cryptocurrency market this week, SHIB validated a breakout from an inverse head and shoulders pattern on the 4-hour chart on Sunday.
The breakout positioned Shiba Inu for a 20% move that could see it tag highs at $0.00001471. This target is determined by measuring the pattern's height from the center of the neckline down to the head, as shown on the chart below, and extrapolating above the breakout point.
It is worth noting that the 4-hour 50 Exponential Moving Average (EMA) crossed above the 200 EMA on Wednesday, confirming high conviction among traders who bet on higher prices. Should the 100 EMA cross above the 200 EMA in upcoming sessions, Shiba Inu could accelerate the uptrend beyond the inverse head and shoulders pattern's target of $0.00001471, and even surpass the key milestone at $0.000015.
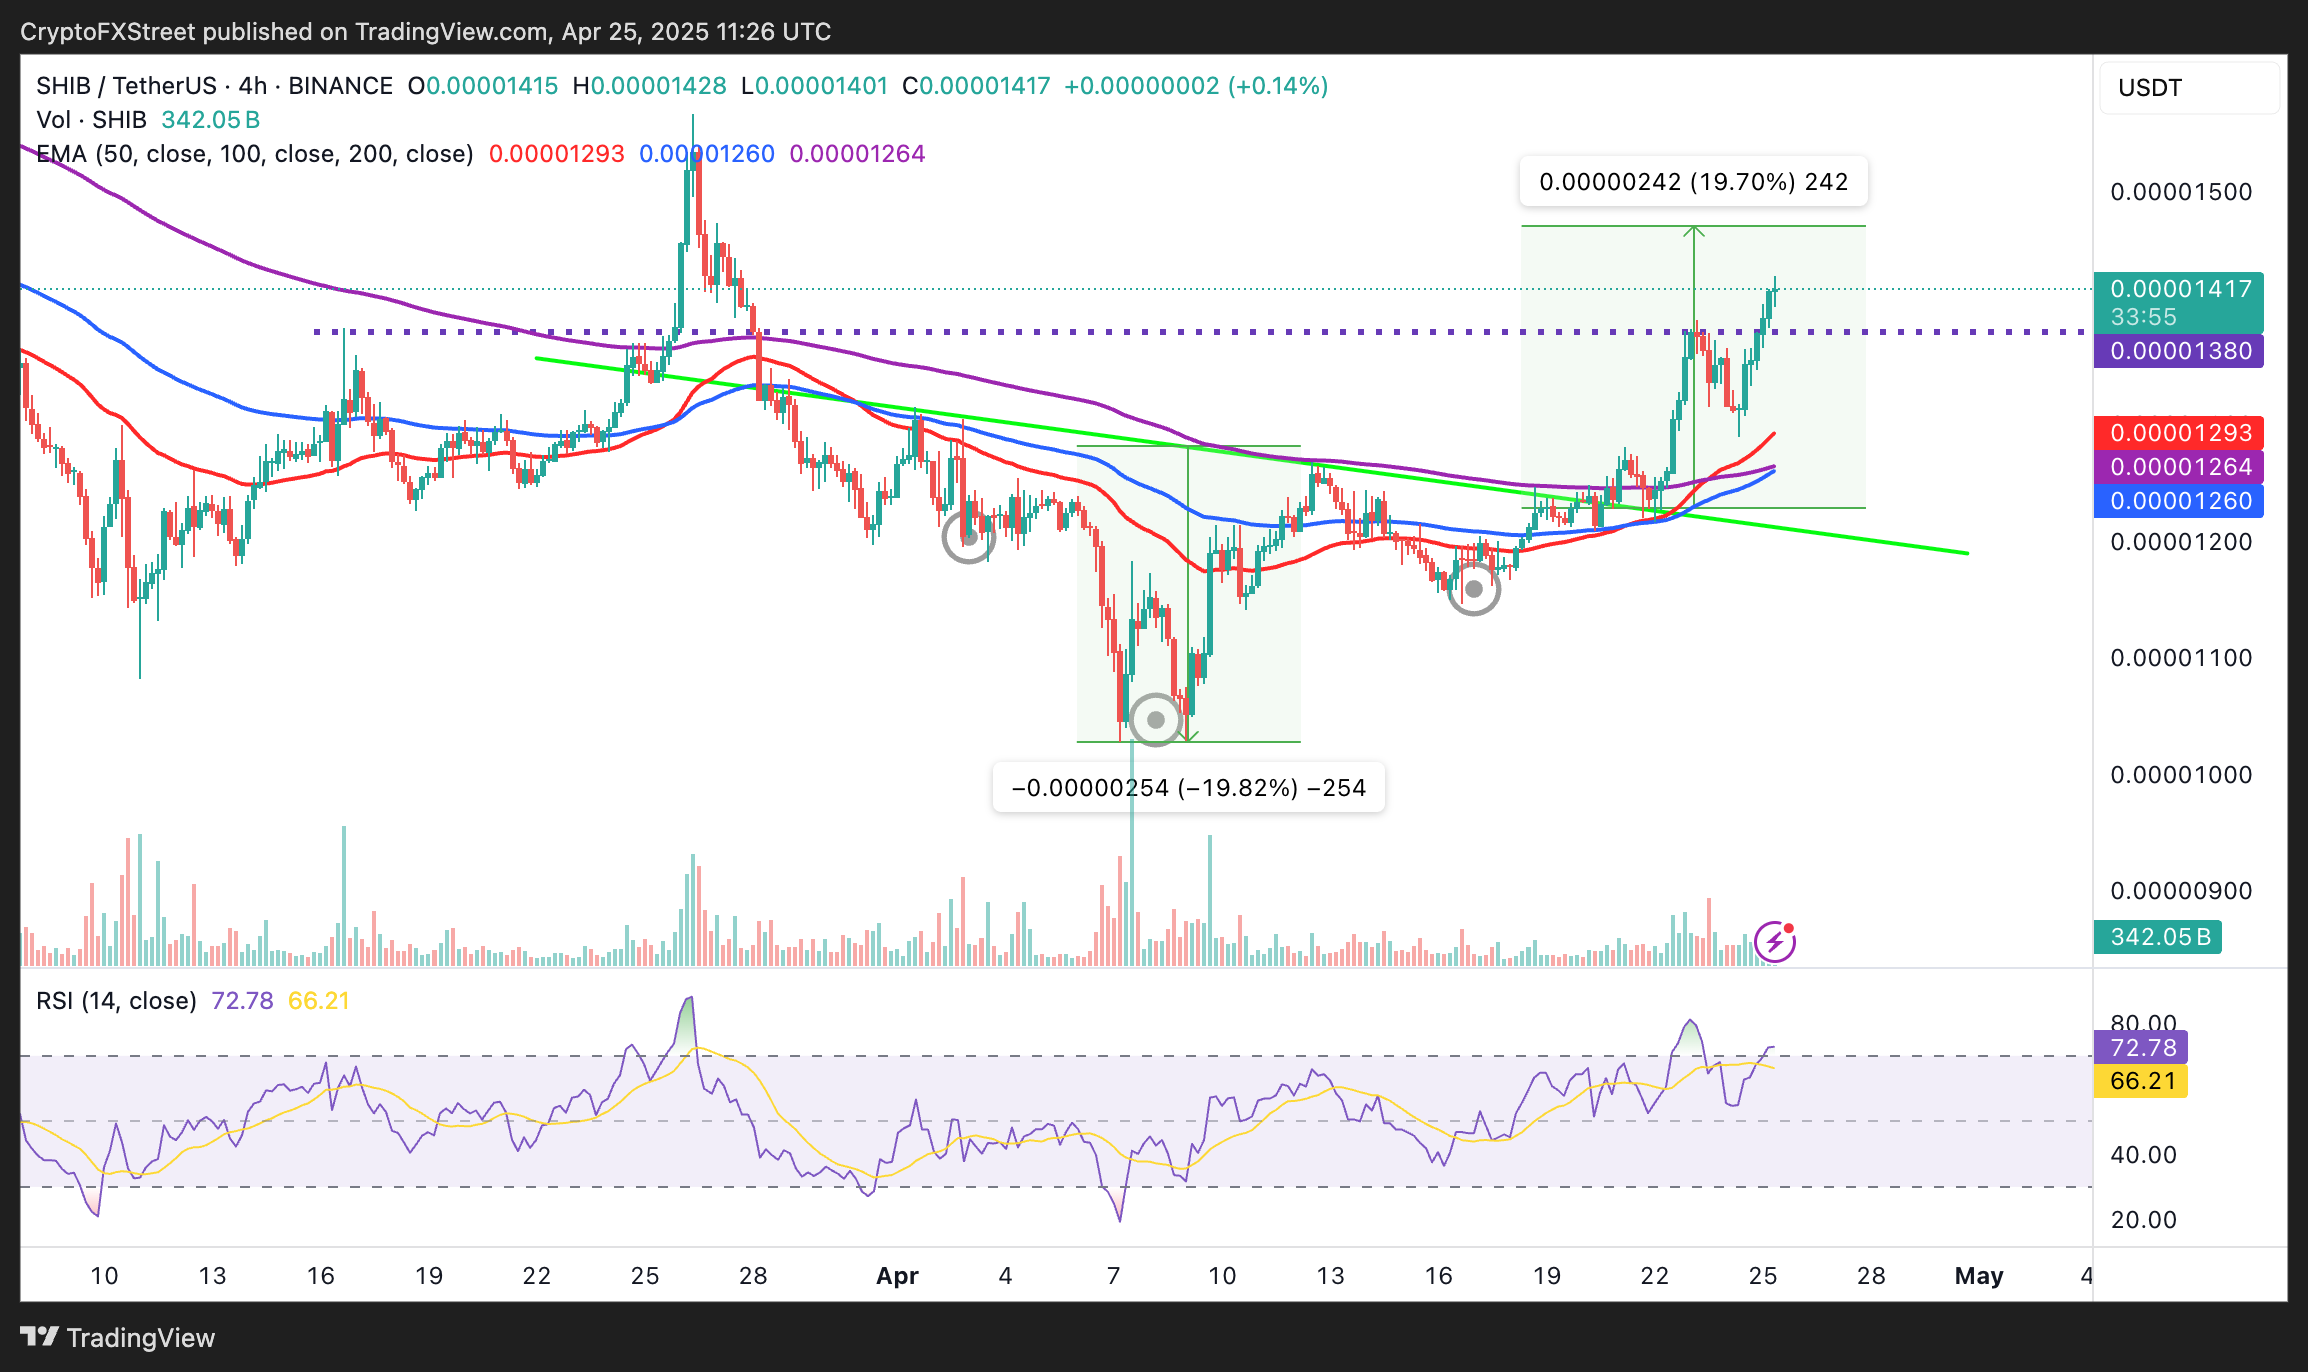
SHIB/USDT 4-hour chart
The Relative Strength Index (RSI) indicator's overbought position at 72.65 highlights a potential risk to the uptrend. If the RSI indicator slides below 70.00, entering the neutral area, Shiba Inu could fold the uptrend, clawing back this week's accrued gains. Looking down, traders may consider key levels like Wednesday's resistance at $0.00001380, the 50 EMA at $0.00001293 and the 200 EMA at $0.00001265 as tentative support areas.
Cryptocurrency metrics FAQs
The developer or creator of each cryptocurrency decides on the total number of tokens that can be minted or issued. Only a certain number of these assets can be minted by mining, staking or other mechanisms. This is defined by the algorithm of the underlying blockchain technology. On the other hand, circulating supply can also be decreased via actions such as burning tokens, or mistakenly sending assets to addresses of other incompatible blockchains.
Market capitalization is the result of multiplying the circulating supply of a certain asset by the asset’s current market value.
Trading volume refers to the total number of tokens for a specific asset that has been transacted or exchanged between buyers and sellers within set trading hours, for example, 24 hours. It is used to gauge market sentiment, this metric combines all volumes on centralized exchanges and decentralized exchanges. Increasing trading volume often denotes the demand for a certain asset as more people are buying and selling the cryptocurrency.
Funding rates are a concept designed to encourage traders to take positions and ensure perpetual contract prices match spot markets. It defines a mechanism by exchanges to ensure that future prices and index prices periodic payments regularly converge. When the funding rate is positive, the price of the perpetual contract is higher than the mark price. This means traders who are bullish and have opened long positions pay traders who are in short positions. On the other hand, a negative funding rate means perpetual prices are below the mark price, and hence traders with short positions pay traders who have opened long positions.
Author

John Isige
FXStreet
John Isige is a seasoned cryptocurrency journalist and markets analyst committed to delivering high-quality, actionable insights tailored to traders, investors, and crypto enthusiasts. He enjoys deep dives into emerging Web3 tren


