SEIUSD Elliott Wave technical analysis [Video]
![SEIUSD Elliott Wave technical analysis [Video]](https://editorial.fxsstatic.com/images/i/crypto-coins-1_XtraLarge.png)
SEIUSD Elliott Wave technical overview
-
Function: Trend Continuation.
-
Mode: Motive Wave.
-
Structure: Impulse Pattern.
-
Current Position: Wave 2.
-
Next higher degree trend: To be determined.
-
Invalidation level: Wave structure breaks below $0.130.
SEI/USD trading strategy
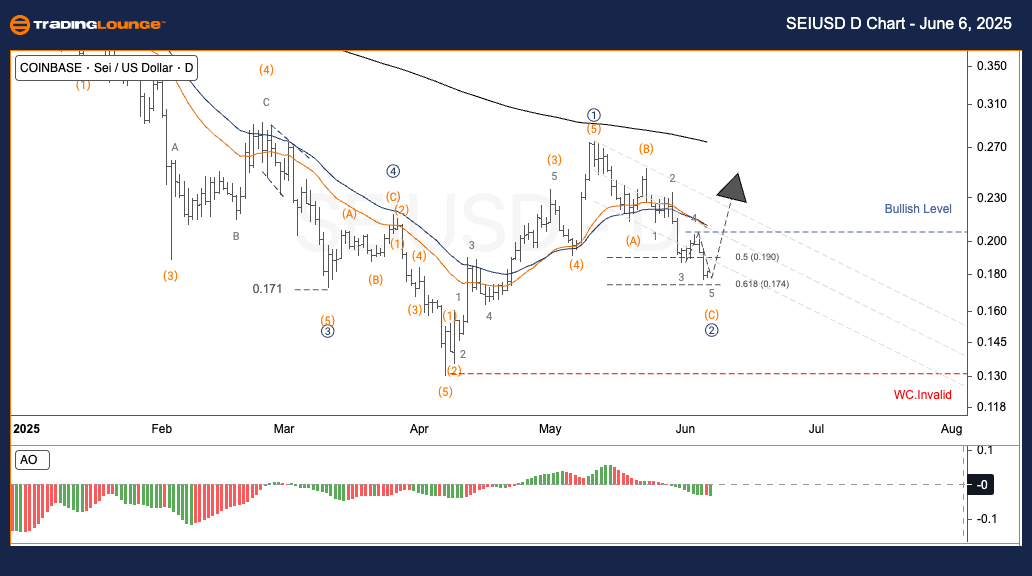
SEI/USD has formed a clean 5-wave structure completing wave ① at approximately $0.32. The price now consolidates in a corrective Zigzag pattern (A–B–C), which appears close to finalizing wave ② around a key Fibonacci support zone.
Suggested approach
-
Short-Term Traders (Swing Trading).
-
-
Entry Idea: Monitor for a breakout above $0.220 to confirm the onset of wave ③. Upon confirmation, align trades with the prevailing trend.
-
Risk parameters
-
Invalidation Point: Price dipping below $0.130 invalidates this wave scenario.
SEIUSD Elliott Wave technical overview
-
Function: Trend Continuation.
-
Mode: Motive Wave.
-
Structure: Impulse Pattern.
-
Current position: Wave 2.
-
Next higher degree trend: To be determined.
-
Invalidation level: Below $0.130.
Following the completion of wave ① around $0.32, SEI/USD now undergoes a Zigzag correction (A–B–C), forming wave ②. This corrective movement is nearing its end at a Fibonacci support level.
Suggested approach
-
Short-term traders (Swing Trading)
-
-
Entry Signal: Await a confirmed breakout above $0.220 to signal the beginning of wave ③. Traders should consider building positions in line with the upward momentum.
-
Risk parameters
-
Wave Structure Invalidation: A drop under $0.130 will negate the current wave count.

SEIUSD Elliott Wave technical overview [Video]
Author

Peter Mathers
TradingLounge
Peter Mathers started actively trading in 1982. He began his career at Hoei and Shoin, a Japanese futures trading company.


