- SafeMoon price bounces off a critical support level, showing the presence of buyers.
- A continuation of this bounce could lead to a 20% rally to $0.00000450.
- If SAFEMOON breaks the range low at $0.00000271, the bullish thesis will face invalidation.
SafeMoon price shows a resurgence of bulls that have kept it from heading lower. Instead, SAFEMOON has ricocheted off the support level and might continue to rise if the buyers persist.
SafeMoon price eyes higher high
SafeMoon price dropped roughly 12% from June 10 to June 11 and bounced off a support barrier at $0.00000344. This level has been crucial in preventing a steep correction for SAFEMOON.
Therefore, assuming this level holds, SafeMoon price will likely rally 15% to tag the 50% Fibonacci retracement level at $0.00000397. If the bulls continue to rampage, SAFEMOON will likely continue its ascent to $0.00000450, which is nearly 20% from the current position, $0.00000368.
Under highly bullish conditions, SafeMoon price could propel to the range high at $0.00000523.
Investors should note that the 50 four-hour and 100 four-hour Simple Moving Averages (SMAs) at $0.00000372 and $0.00000396, respectively, are two primary resistance levels that could hinder the move higher.
Therefore, closing above the latter will confirm the start of a new uptrend,
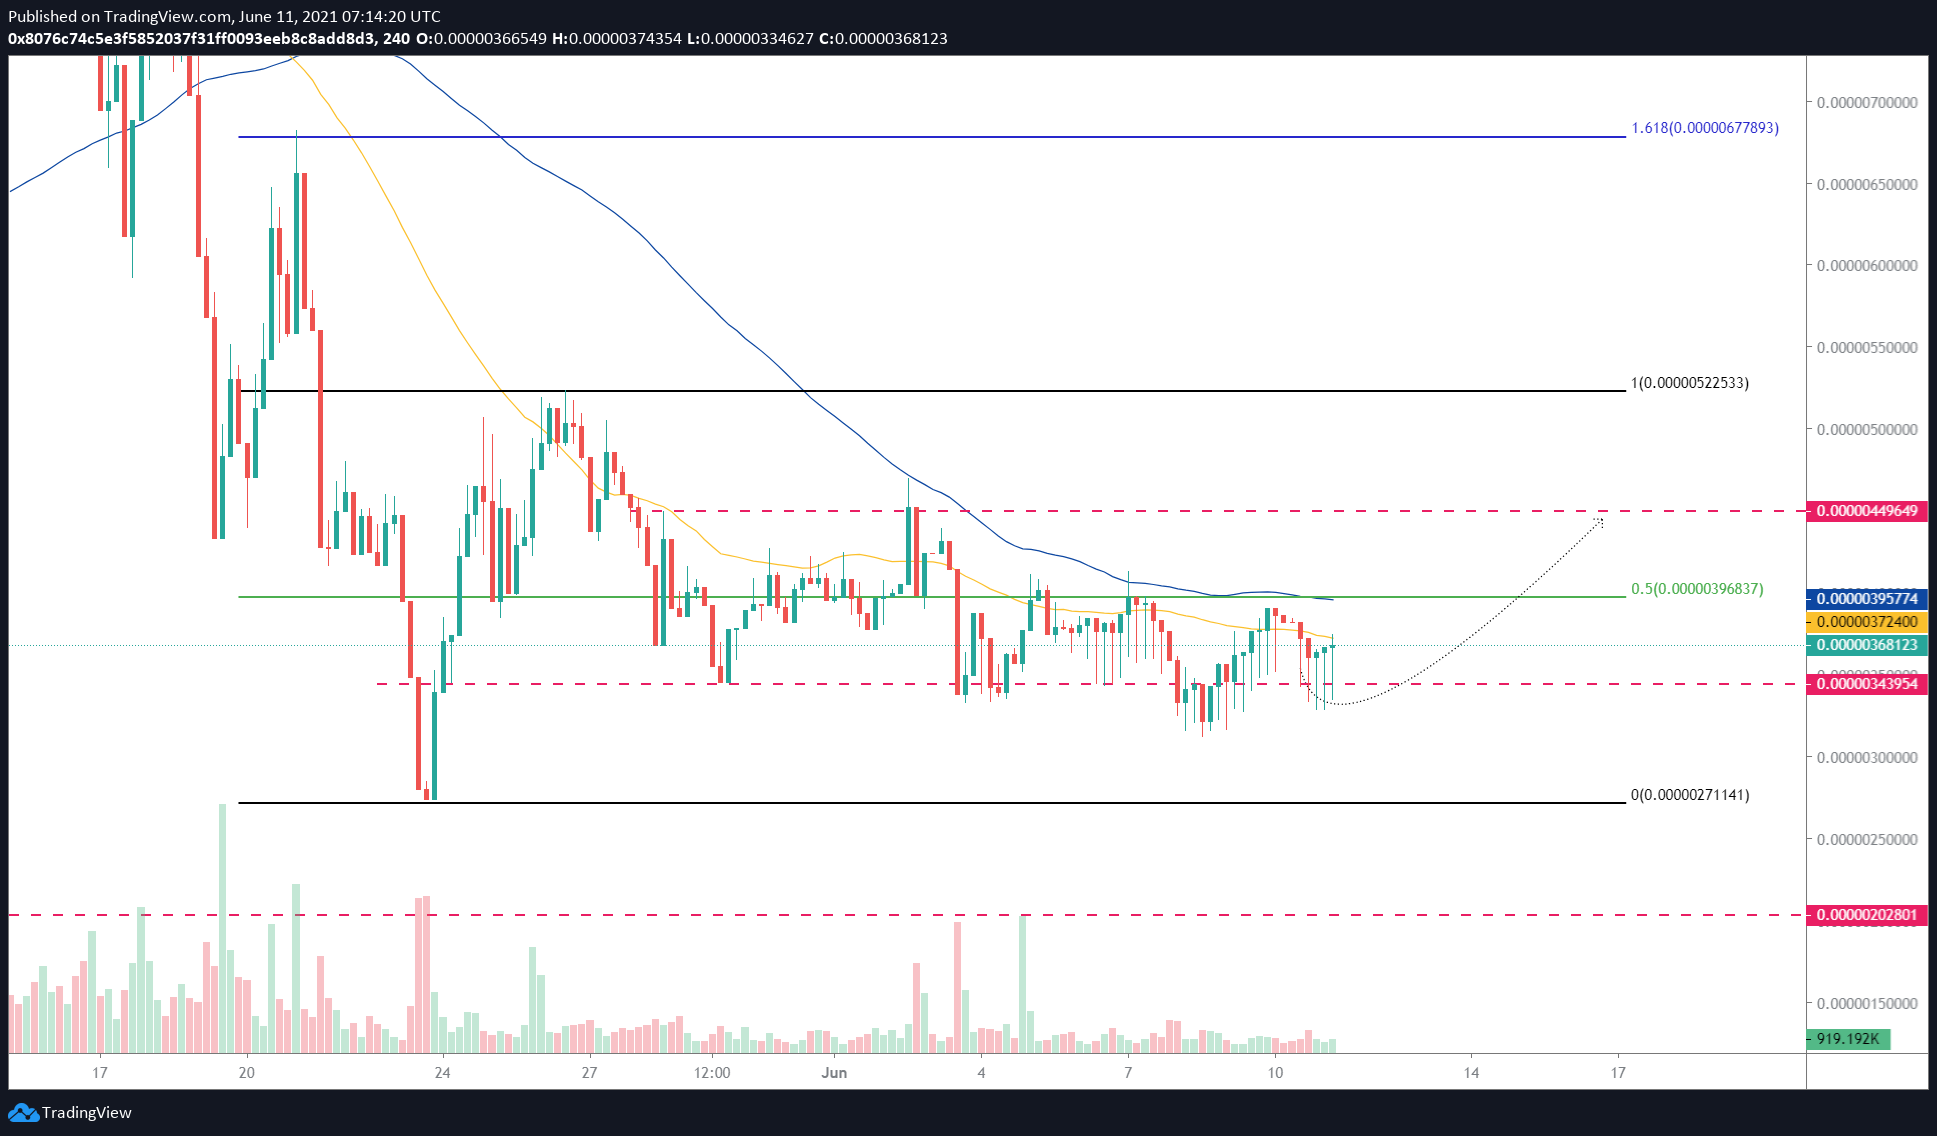
SAFEMOON/USDT 4-hour chart
A rejection of SafeMoon price at $0.00000396, leading to the breakdown of the support barrier at $0.00000344, will signify weak bullish momentum. Additionally, a decisive 4-hour candlestick close below the range low at $0.00000271 will invalidate the optimistic narrative detailed above.
If the selling pressure continues to build even after shattering this latter swing low, market participants can expect SAFEMOON to retest $0.00000203.
Information on these pages contains forward-looking statements that involve risks and uncertainties. Markets and instruments profiled on this page are for informational purposes only and should not in any way come across as a recommendation to buy or sell in these assets. You should do your own thorough research before making any investment decisions. FXStreet does not in any way guarantee that this information is free from mistakes, errors, or material misstatements. It also does not guarantee that this information is of a timely nature. Investing in Open Markets involves a great deal of risk, including the loss of all or a portion of your investment, as well as emotional distress. All risks, losses and costs associated with investing, including total loss of principal, are your responsibility. The views and opinions expressed in this article are those of the authors and do not necessarily reflect the official policy or position of FXStreet nor its advertisers. The author will not be held responsible for information that is found at the end of links posted on this page.
If not otherwise explicitly mentioned in the body of the article, at the time of writing, the author has no position in any stock mentioned in this article and no business relationship with any company mentioned. The author has not received compensation for writing this article, other than from FXStreet.
FXStreet and the author do not provide personalized recommendations. The author makes no representations as to the accuracy, completeness, or suitability of this information. FXStreet and the author will not be liable for any errors, omissions or any losses, injuries or damages arising from this information and its display or use. Errors and omissions excepted.
The author and FXStreet are not registered investment advisors and nothing in this article is intended to be investment advice.
Recommended Content
Editors’ Picks
Can TRX trigger 30% breakout rally after multiple rejections?

TRON (TRX) price is attempting to overcome a resistance level for the third time this year. Another failure could prove costly for TRX holders, but a breakout could trigger a massive uptrend.
This short-term Bitcoin holder indicator forecasts another rally for BTC

Bitcoin price currently trades at $26,242 with dampened volatility. But things could change quickly, as indicated by these on-chain metrics that track the behavior of BTC holders.
Litecoin price is failing recovery as Whales pull back to December 2020 lows

Litecoin price has been unable to flip the 50-day EMA into a support floor since August began. The LTC whales, which command nearly 12% of the entire circulating supply, currently have been subdued.
Members of US FSC urge SEC Chair Gensler to immediately approve spot Bitcoin ETFs

United States House Financial Services Committee members sent out a letter to Gary Gensler addressing the spot Bitcoin ETFs. The letter called the SEC’s standards of denial of spot ETFs “inconsistent and discriminatory”.
Bitcoin: BTC downside likely after 20-week EMA culls bulls

Bitcoin (BTC) bearish price fractal, as discussed in a previous article, is underway, but the lack of volatility is causing ambiguity and doubt. Regardless, BTC might see a bit of an upside before the long-term bearish scenario plays out.