|

Ripple's XRP Technical Analysis: XRP/USD set for critical support retest

  • Ripple's XRP price is trading up in minor negative territory in the second half of the session on Monday.
  • XRP/USD is heading for a retest of a breached triangular structure, support tracking at $0.3130.
  • A failure of the above-noted support holding could see a fast drop down towards $0.3000. 

Spot rate:                 0.3163

Relative change:      -0.50%

High:                        0.3222

Low:                         0.3143

Trends:
    Daily SMA20: 0.3154
    Daily SMA50: 0.3118
    Daily SMA100: 0.3258
    Daily SMA200: 0.3773
Levels:
    Previous Daily High: 0.3213
    Previous Daily Low: 0.3166
    Previous Weekly High: 0.3268
    Previous Weekly Low: 0.3001
    Previous Monthly High: 0.3505
    Previous Monthly Low: 0.2879
    Daily Fibonacci 38.2%: 0.3184
    Daily Fibonacci 61.8%: 0.3195
    Daily Pivot Point S1: 0.316
    Daily Pivot Point S2: 0.3139
    Daily Pivot Point S3: 0.3112
    Daily Pivot Point R1: 0.3207
    Daily Pivot Point R2: 0.3234
    Daily Pivot Point R3: 0.3254

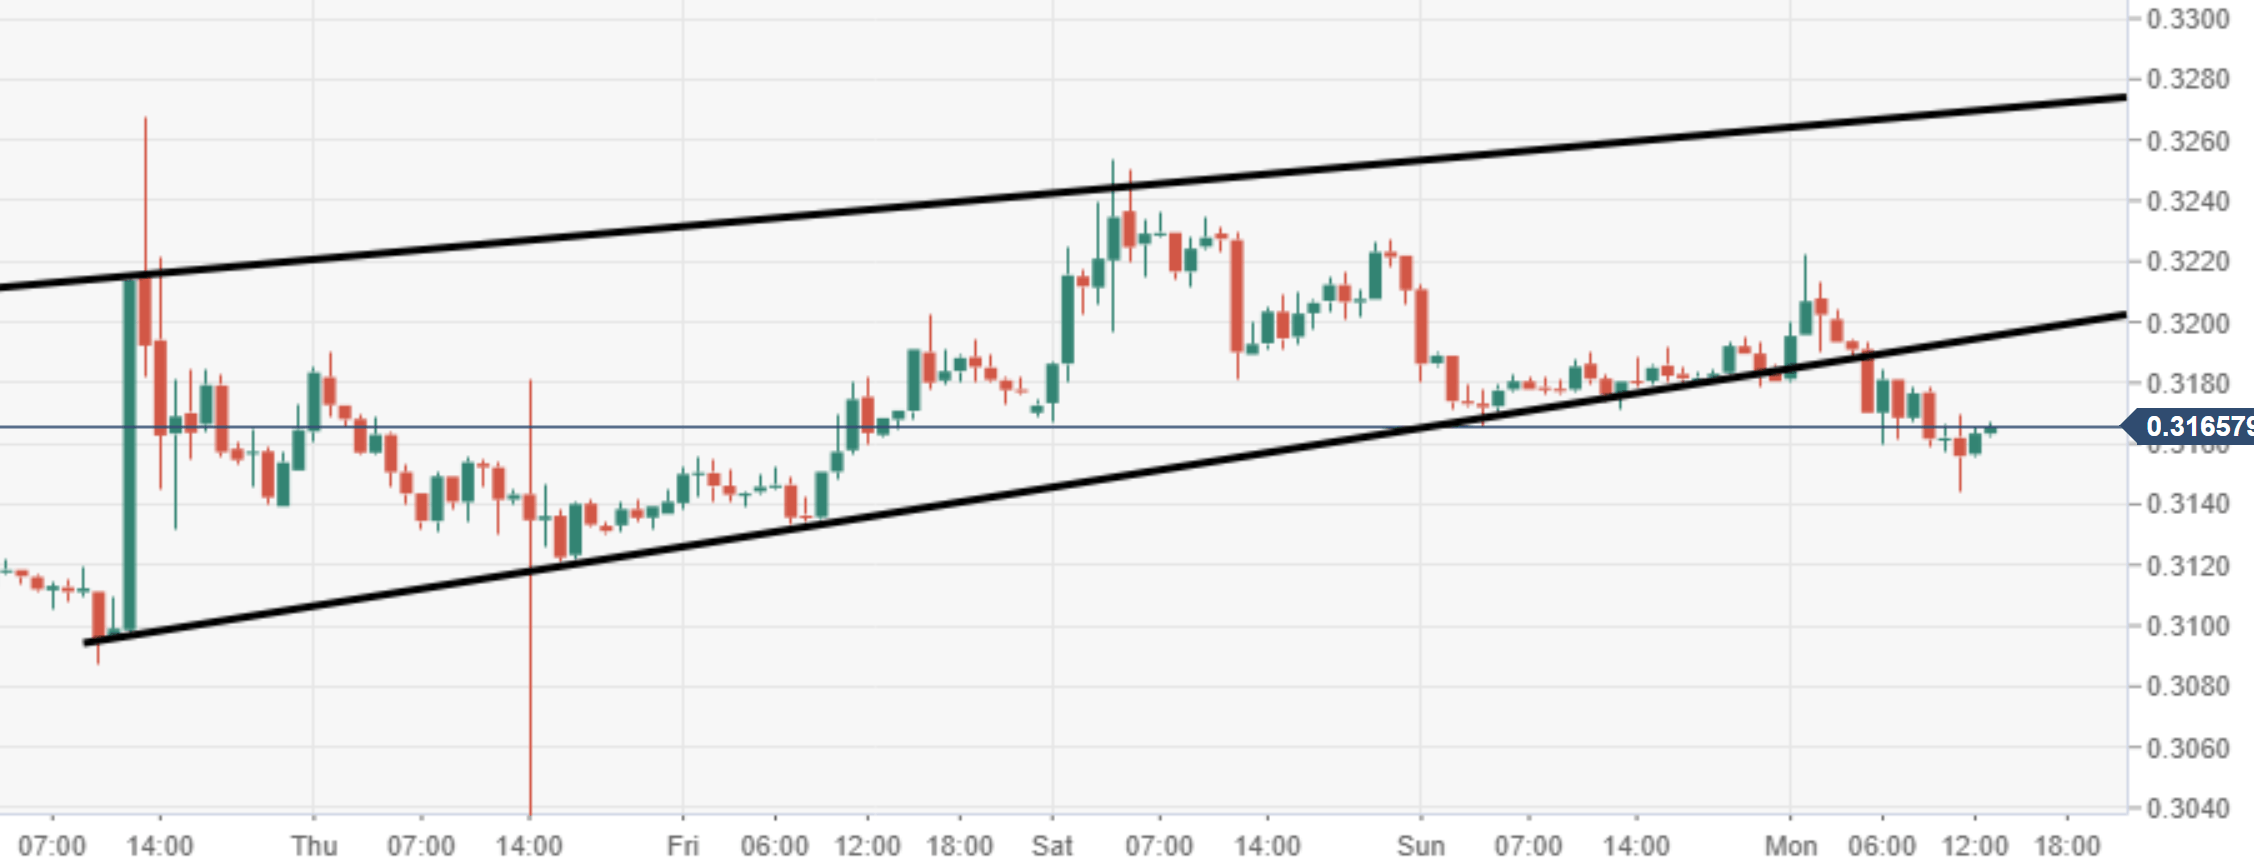
XRP/USD 60-minute chart

  • Price action was moving within ascending wedge pattern formation, however, the bears recently forced a breakout.
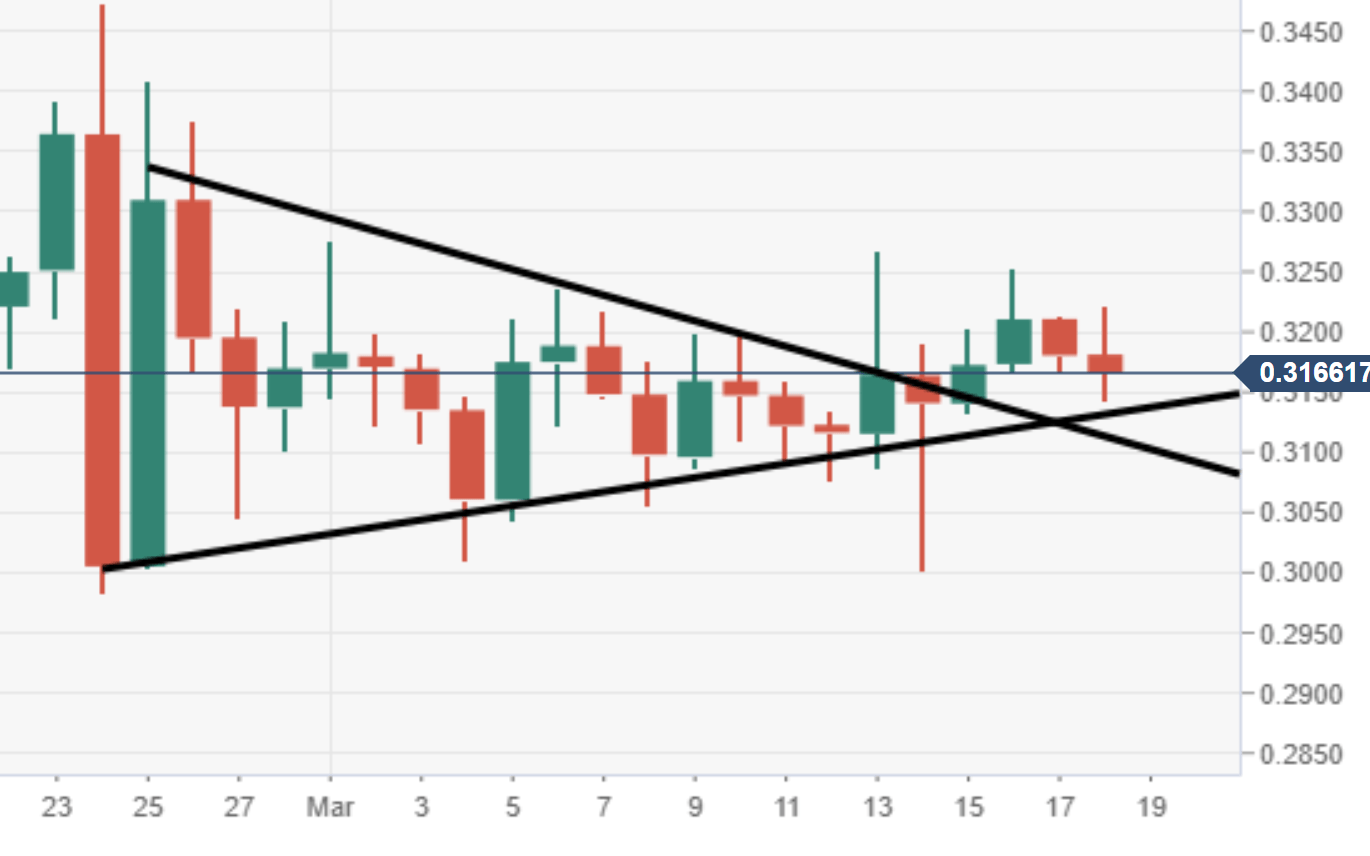
XRP/USD daily chart

  • Price action heading for a retest of the breached triangular structure. 
  • XRP/USD could very much be playing to the textbook, with the breakout a retest. 

Author

Ken Chigbo

Ken Chigbo

Independent Analyst

Ken has over 8 years exposure to the financial markets. He started his career as an analyst, covering a variety of asset classes; forex, fixed income, commodities and equities.

More from Ken Chigbo
Share:

Editor's Picks

Crypto Today: Bitcoin, Ethereum, XRP trade under sustained selling pressure despite mild ETF inflows

Cryptocurrency prices remain under pressure as a risk-off mood persists on Friday, with Bitcoin consolidating its losses above $62,000. Altcoins, including Ethereum and Ripple, are extending their weakness, trading near lower support levels around $1,600 and $1.12, respectively.

Bitcoin Weekly Forecast: After the bloodbath, everyone looks at $60,000

Bitcoin (BTC) hovers above $62,000 at the time of writing on Friday, weighed down by growing risk-off sentiment due to persistent geopolitical tensions in the Middle East and sticky macroeconomic uncertainty.

Cardano hits five-year low even as Hoskinson clarifies "break" isn't an exit

Cardano price is down 10% at press time on Friday, extending losses over 30% so far this week amid Charles Hoskinson's clarification that "break" isn't an exit. A reactionary spike in on-chain activity and social chatter, reflecting a strength of community, but fails to absorb the price decline.

Arthur Hayes' “Holy Trinity” is dead: Exits Zcash after Orchard Pool exploit

Arthur Hayes dumped his entire Zcash holdings on Friday, a day after selling his HYPE and NEAR holdings. Zcash is down 13% so far on Friday, extending the 26% drop from the previous day.

Billions in ETF outflows don’t bode well
Bitcoin (BTC) remains under pressure, trading below $74,000 on Friday, and is set to post its third consecutive week of losses. The institutional sell-off continues, with spot BTC Exchange-Traded funds (ETFs) recording billions in outflows. In addition, sticky inflation and macroeconomic headwinds suppress the Crypto King’s upside potential. Institutional demand continues to weaken so far this week.