Ripple's XRP technical analysis: XRP/USD critical $0.2500 is hanging on to a thread
- Ripple's XRP price in the session on Thursday is trading with losses of some 1.45%.
- XRP/USD price action broke out to the downside from a bearish pennant structure.
- The psychological $0.2500 mark is at present being defended by buyers.

Spot rate: 0.2580
Relative change: -1.40%
High: 0.2562
Low: 0.2475
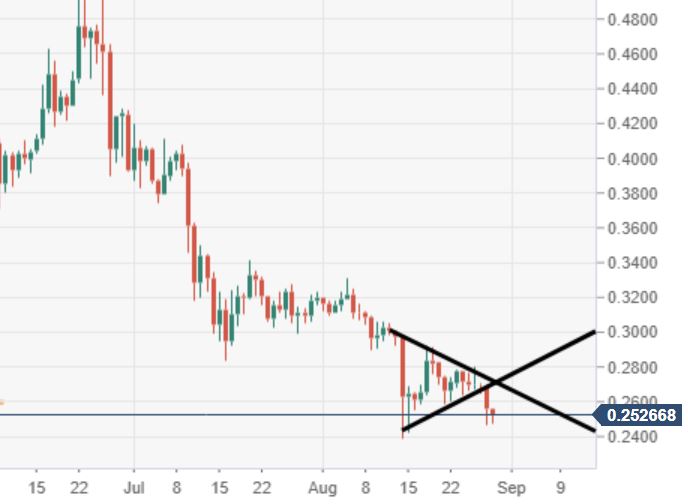
XRP/USD daily chart
- Price action has extended to the downside out from a bearish pennant structure.
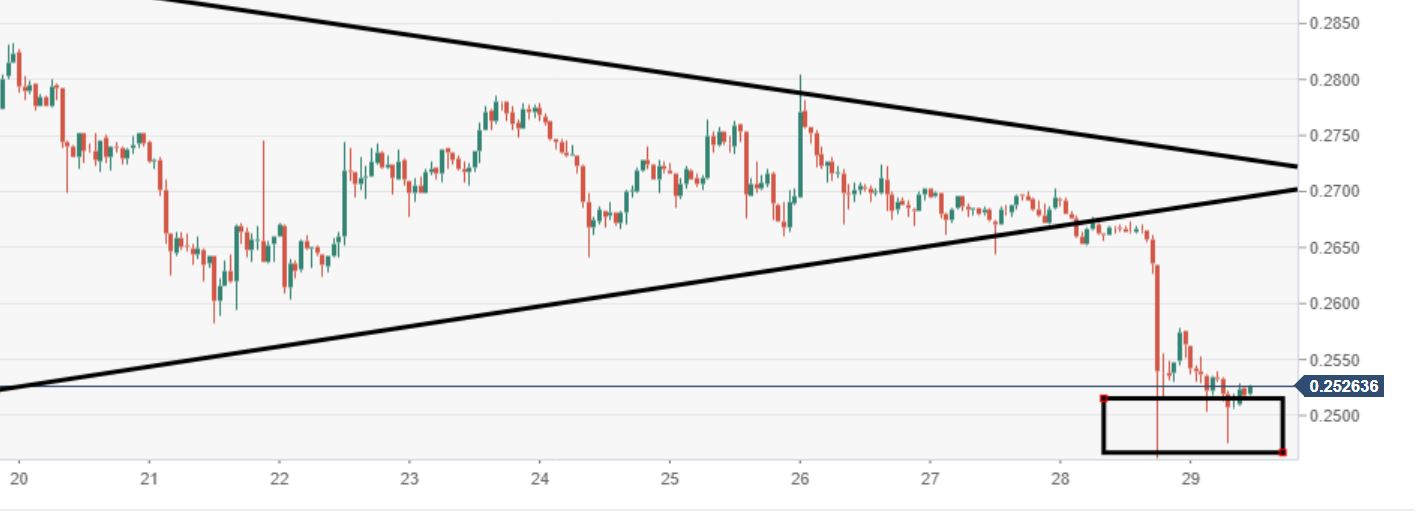
XRP/USD 60-minute chart
- Buyers are actively trying to defend the psychological $0.2500 mark, but remains vulnerable.
Author

Ken Chigbo
Independent Analyst
Ken has over 8 years exposure to the financial markets. He started his career as an analyst, covering a variety of asset classes; forex, fixed income, commodities and equities.
More from Ken Chigbo


