Ripple Price Prediction: XRP price on the verge of a major breakout
- XRP holders’ confidence grows as the chances of XRP spot ETF approvals jump to 85% from 65% in less than two months.
- XRP remains above support at $2.20, highlighted by a confluence of the 50- and 100-day EMAs.
- Traders anticipate a breakout above descending trendline resistance, backed by a buy signal from the MACD indicator.
- Still, discussion around XRP relative to other top cryptocurrencies has declined, increasing downside risks.

Ripple (XRP) price remains firmly supported at $2.20, while trading at $2.22 at the time of writing on Friday. The XRP community is growing increasingly confident in its holdings amid renewed optimism for the approval of spot XRP Exchange Traded Funds (ETFs) following the change in leadership at the Securities and Exchange Commission (SEC). Still, challenges could emerge, especially with Santiment highlighting a persistent decline in XRP's social dominance relative to other top cryptocurrencies.
XRP spot ETF approval chances jump
The change of leadership at the SEC, with Paul Atkins as the Chair of the regulatory agency, has seen the chances of an XRP spot ETF approval jump to 85% from 65% in just two months. According to Santiment, “traders are now predicting new all-time highs for XRP, and betting platforms like Polymarket reflect this shift, with 79% odds of approval by the end of the year.”
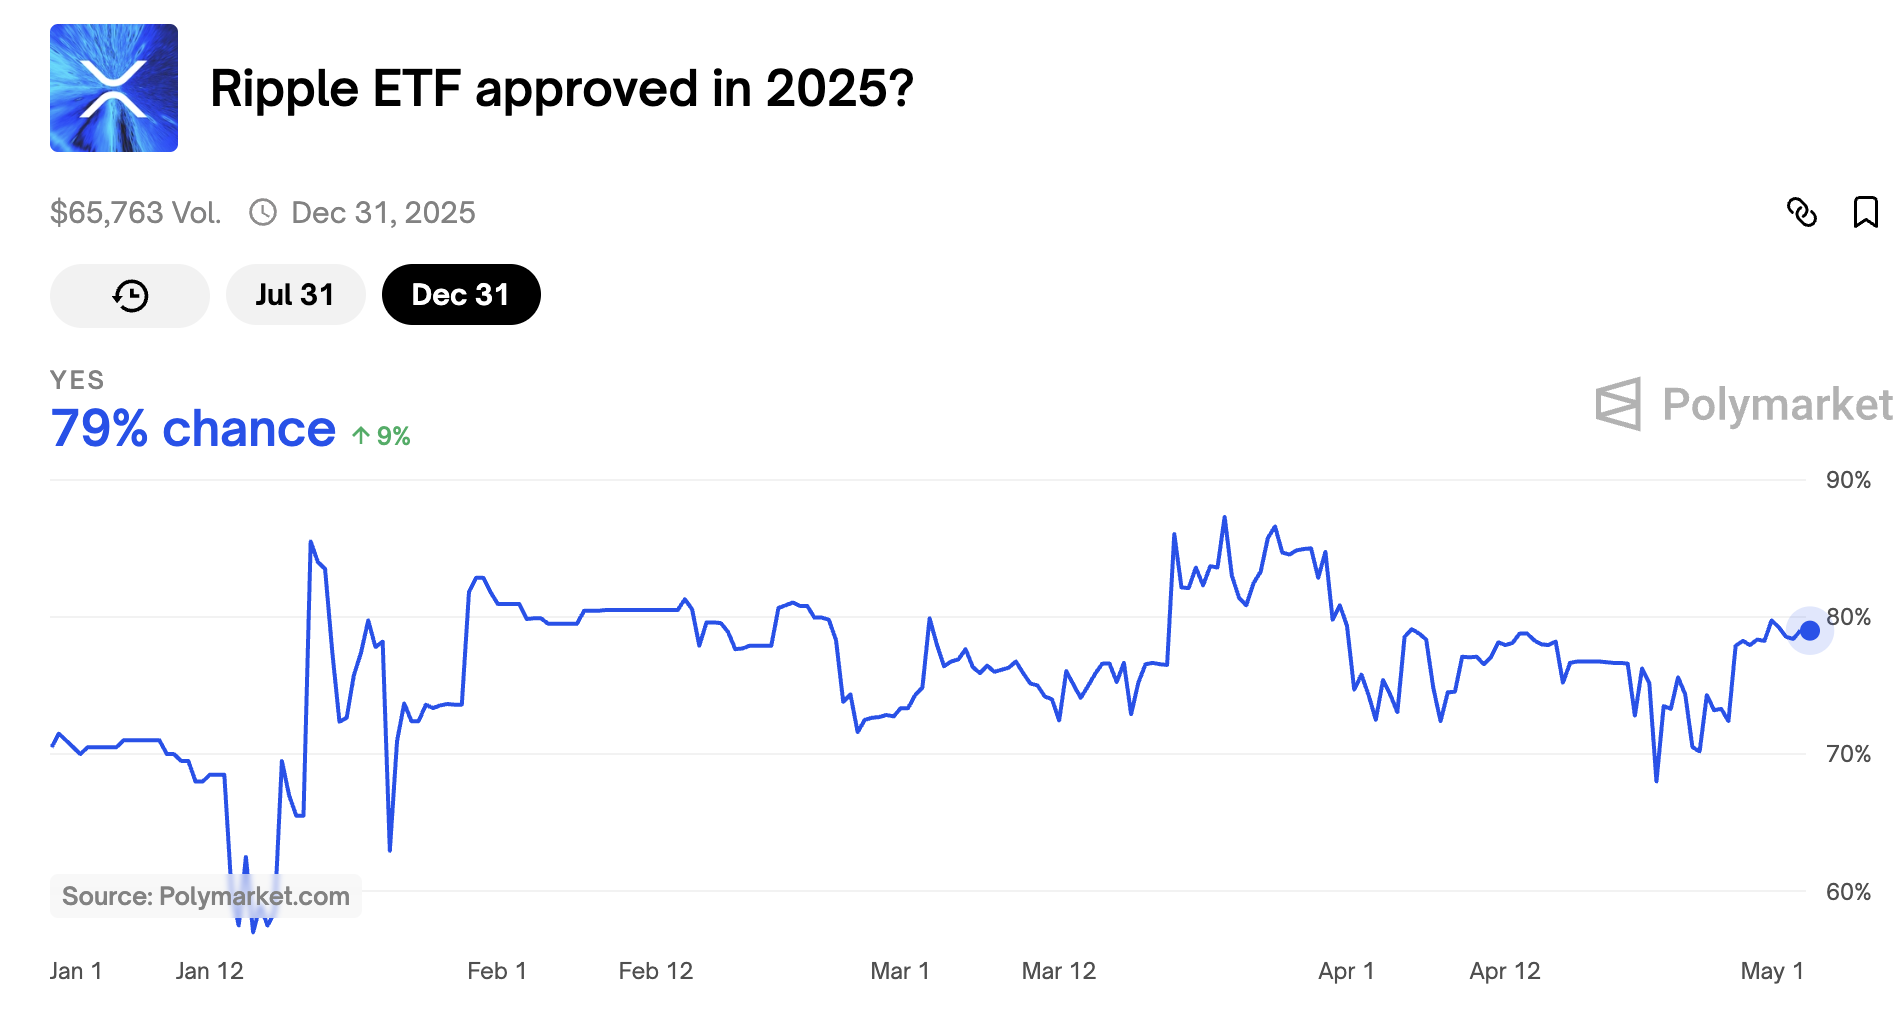
Spot XRP ETF approval odds | Source: Polymarket
The prospects of a spot XRP ETF approval have remained steady despite the SEC postponing its decision on Franklin Templeton’s spot ETF proposal until June 17. The approval of the spot ETF could significantly alter investment dynamics surrounding XRP, potentially attracting substantial institutional interest and propelling the token into the mainstream financial sector.
XRP uptrend could gain momentum
XRP’s price holds firmly to confluence support at $2.20, established by the 50- and 100-day Exponential Moving Averages (EMA). Despite the pivotal movement around this level in the past week, XRP shows signs of the uptrend’s continuation towards a medium-term target of $3.00.
A buy signal in the Moving Average Convergence Divergence (MACD) indicator reinforces the bullish momentum. This signal was confirmed on April 12 when the MACD line (blue) crossed above the signal line (red).
Additionally, the indicator’s movement above the center line, accompanied by the expansion of green histograms, increases the likelihood of a breakout above the descending trendline, as illustrated on the daily chart.
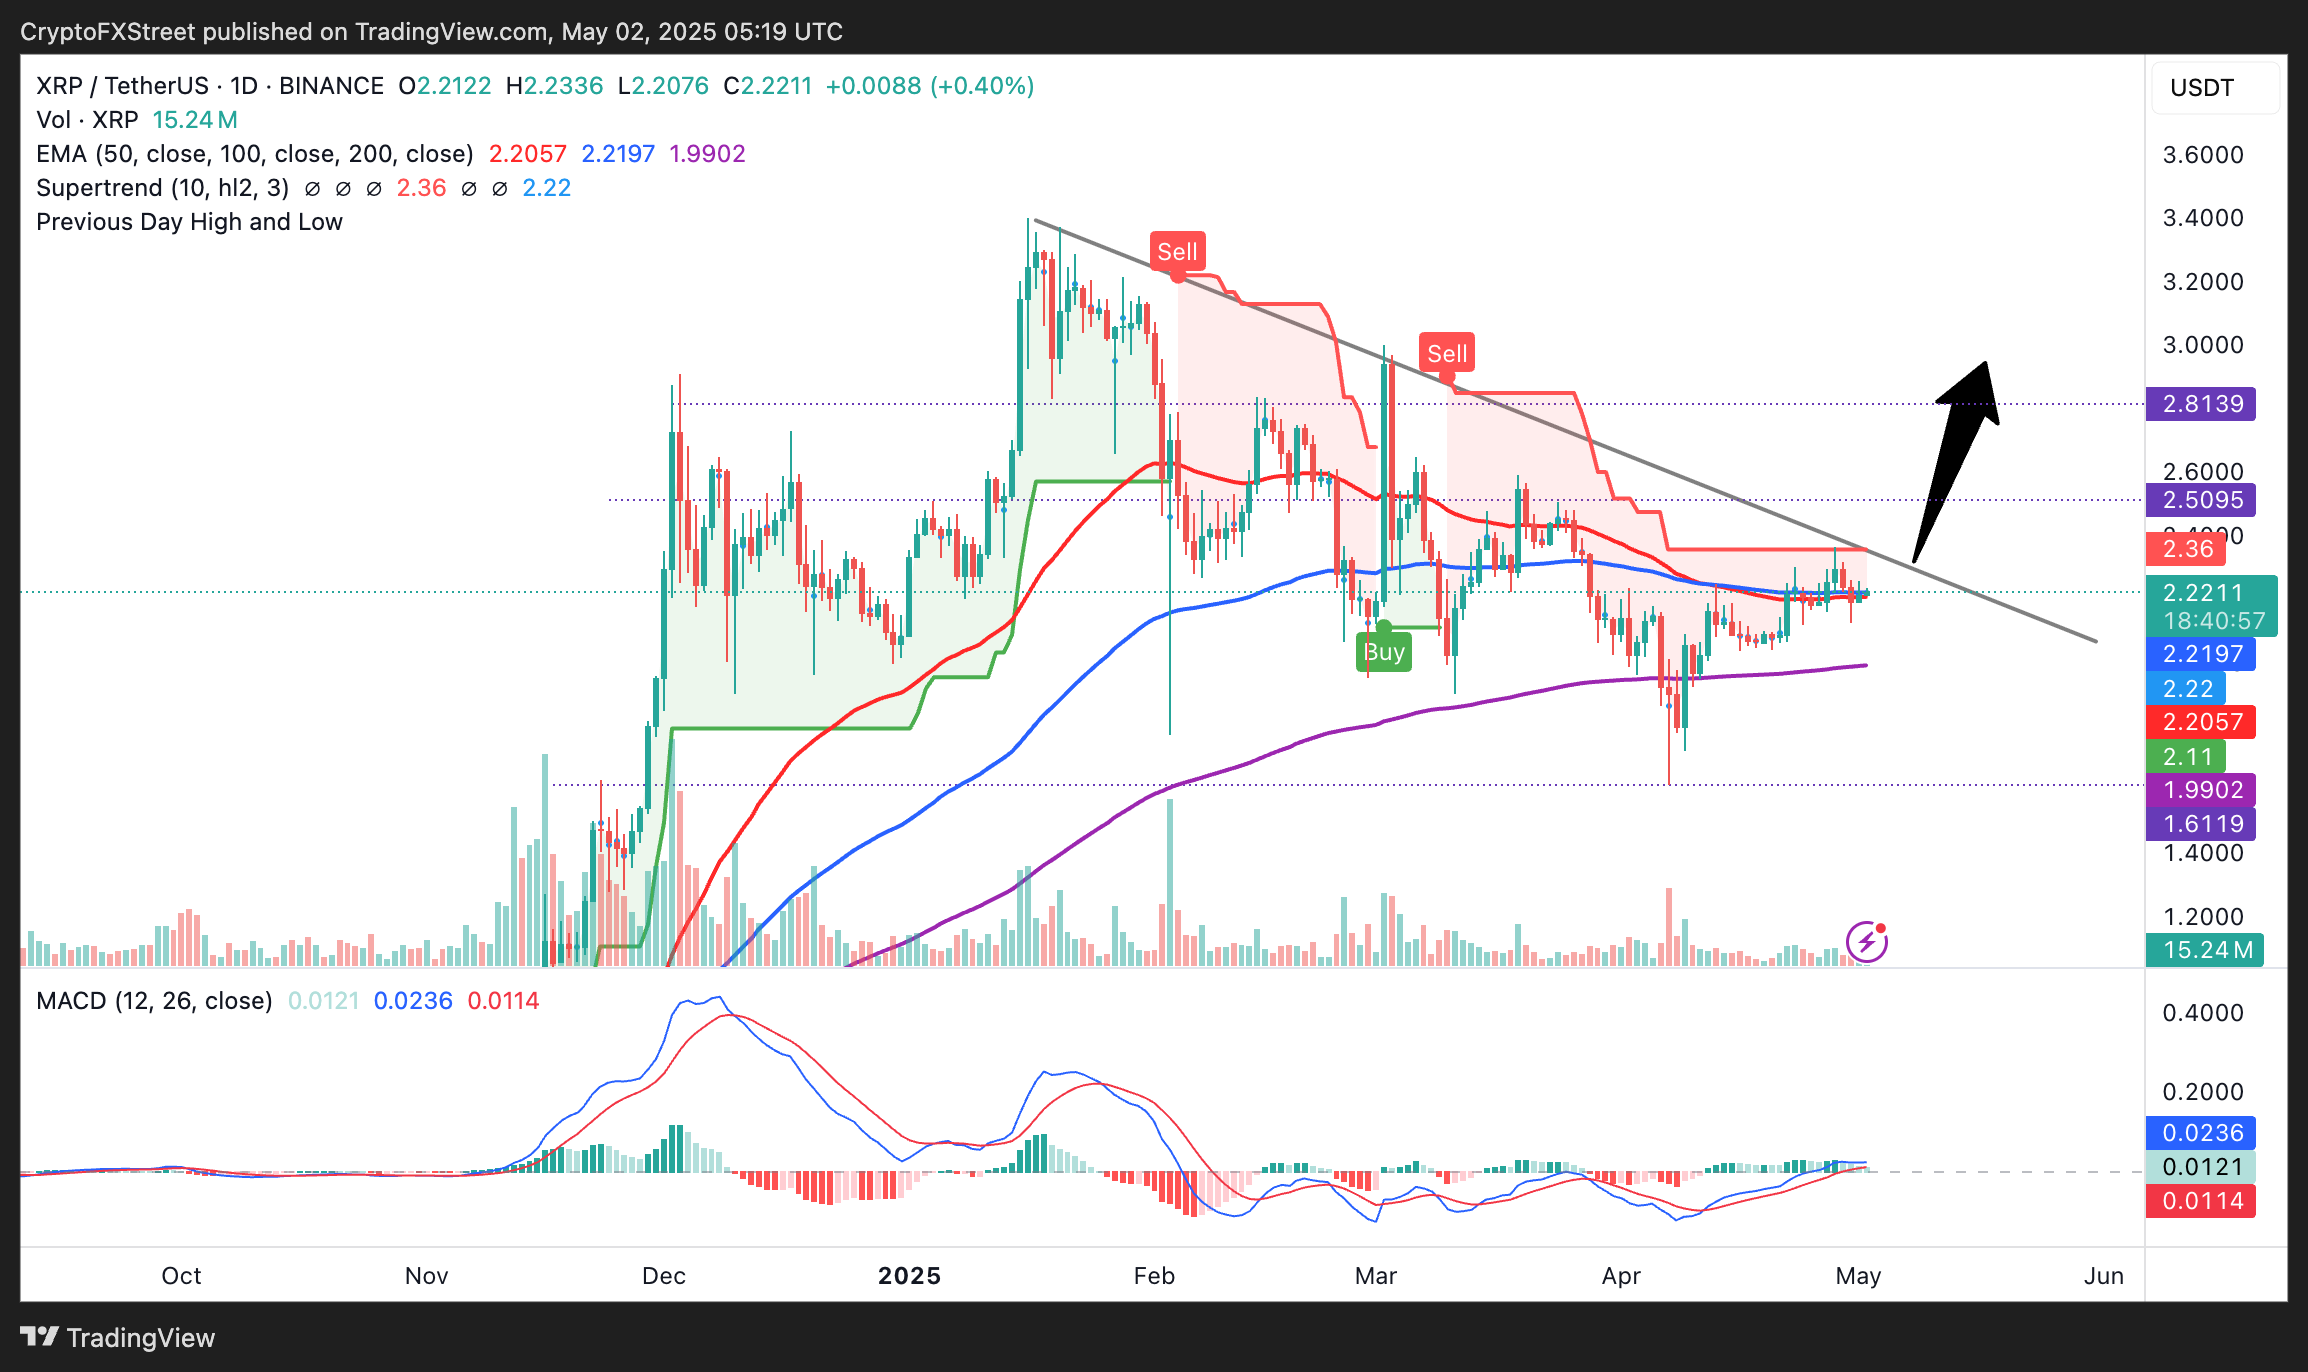
XRP/USDT daily chart
Traders should prepare for possible drawdowns at $2.50 and $2.80 supply zones. Selling due to profit-taking could overwhelm bullish momentum at these levels, slowing the uptrend or even leading to reversals.
The SuperTrend indicator’s sell signal highlights the potential selling pressure in XRP’s recovery path. This indicator sends a sell signal when it flips above the token’s price, changing color from green to red. Traders should consider the position of the SuperTrend when making decisions.
Meanwhile, Santiment’s biweekly market update notes that chatter about XRP, compared to other top cryptocurrencies, has steadily declined over the past three months. This downtrend in social dominance could hold back XRP’s uptrend.
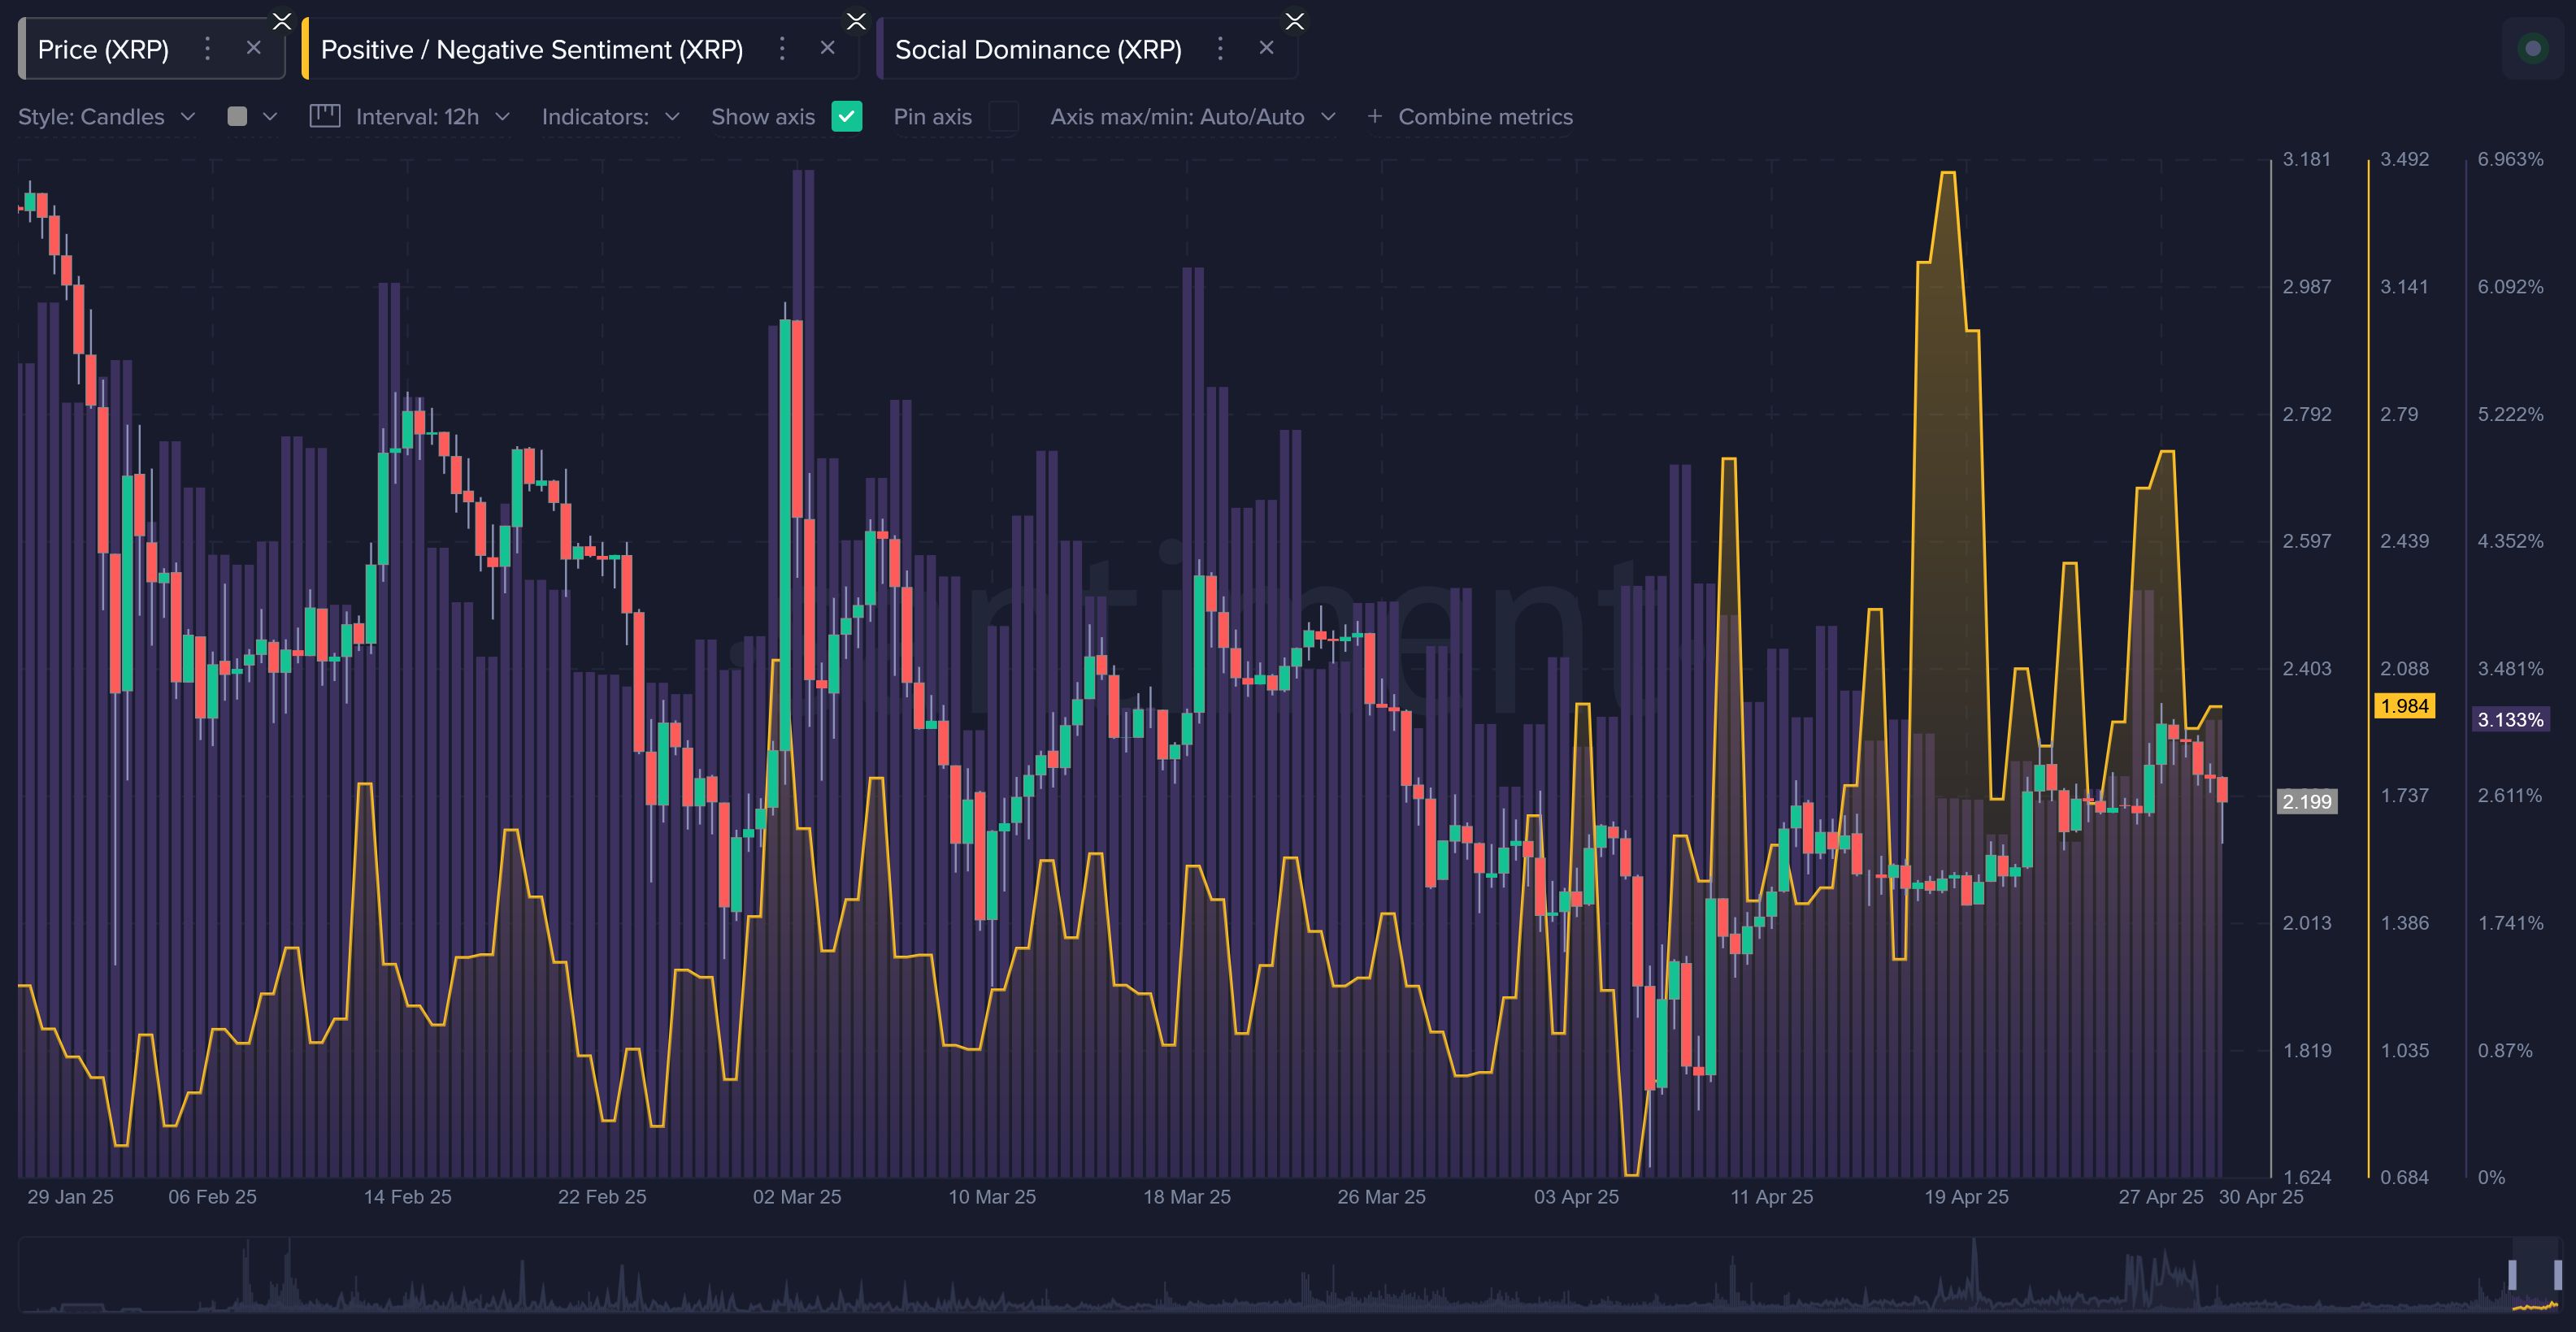
XRP’s ratio of bullish vs. bearish commentary | Source: Santiment
In the event that support at $2.20 gives way, and the XRP price slides, traders would look to the 200-day EMA at $1.99 for a potential rebound. Beyond this level, volatility could spike, creating instability and accelerating losses toward XRP’s April 7 low at $1.61.
Cryptocurrency metrics FAQs
The developer or creator of each cryptocurrency decides on the total number of tokens that can be minted or issued. Only a certain number of these assets can be minted by mining, staking or other mechanisms. This is defined by the algorithm of the underlying blockchain technology. On the other hand, circulating supply can also be decreased via actions such as burning tokens, or mistakenly sending assets to addresses of other incompatible blockchains.
Market capitalization is the result of multiplying the circulating supply of a certain asset by the asset’s current market value.
Trading volume refers to the total number of tokens for a specific asset that has been transacted or exchanged between buyers and sellers within set trading hours, for example, 24 hours. It is used to gauge market sentiment, this metric combines all volumes on centralized exchanges and decentralized exchanges. Increasing trading volume often denotes the demand for a certain asset as more people are buying and selling the cryptocurrency.
Funding rates are a concept designed to encourage traders to take positions and ensure perpetual contract prices match spot markets. It defines a mechanism by exchanges to ensure that future prices and index prices periodic payments regularly converge. When the funding rate is positive, the price of the perpetual contract is higher than the mark price. This means traders who are bullish and have opened long positions pay traders who are in short positions. On the other hand, a negative funding rate means perpetual prices are below the mark price, and hence traders with short positions pay traders who have opened long positions.
Author

John Isige
FXStreet
John Isige is a seasoned cryptocurrency journalist and markets analyst committed to delivering high-quality, actionable insights tailored to traders, investors, and crypto enthusiasts. He enjoys deep dives into emerging Web3 tren



