XRP price sell-off below $3 extends as volatility spikes
- XRP's intraday breakout gets snuffed out below the 100-period EMA on the 4-hour chart as volatility intensifies.
- XRP faces declining retail demand as Open Interest corrects to $7.4 billion.
- Positive futures funding rates uphold the rising demand for leverage long positions in XRP.

Ripple (XRP) faces increasing selling pressure ahead of the weekend, trading at round $2.80 on Friday. An intraday recovery attempt lost momentum below a short-term resistance at $2.90, resulting in a brief flash drop toward the $2.80 support.
Market participants are closely monitoring key United States (US) economic data to gain insight into the Federal Reserve's (Fed) monetary policy direction, especially with the Federal Open Market Committee (FOMC) meeting, where the interest rate decision is expected on September 17.
Risky asset classes, such as crypto and equities, will benefit from what would be the first rate cut of the year. However, traders may need to be content with volatility amid price fluctuations while managing risk in the days to come.
XRP faces declining retail demand as Open Interest shrinks
Retail demand for XRP has significantly decreased over the past few weeks, as evidenced by the futures Open Interest (OI) falling to $7.4 billion after peaking at $10.94 billion on July 22.
A persistent drop in OI, which tracks the notional value of outstanding futures contracts, indicates a lack of conviction in XRP's ability to sustain a short-term recovery. With fewer traders participating in the market, the path of least resistance could remain downward, increasing the chances of XRP testing the support at $2.70.
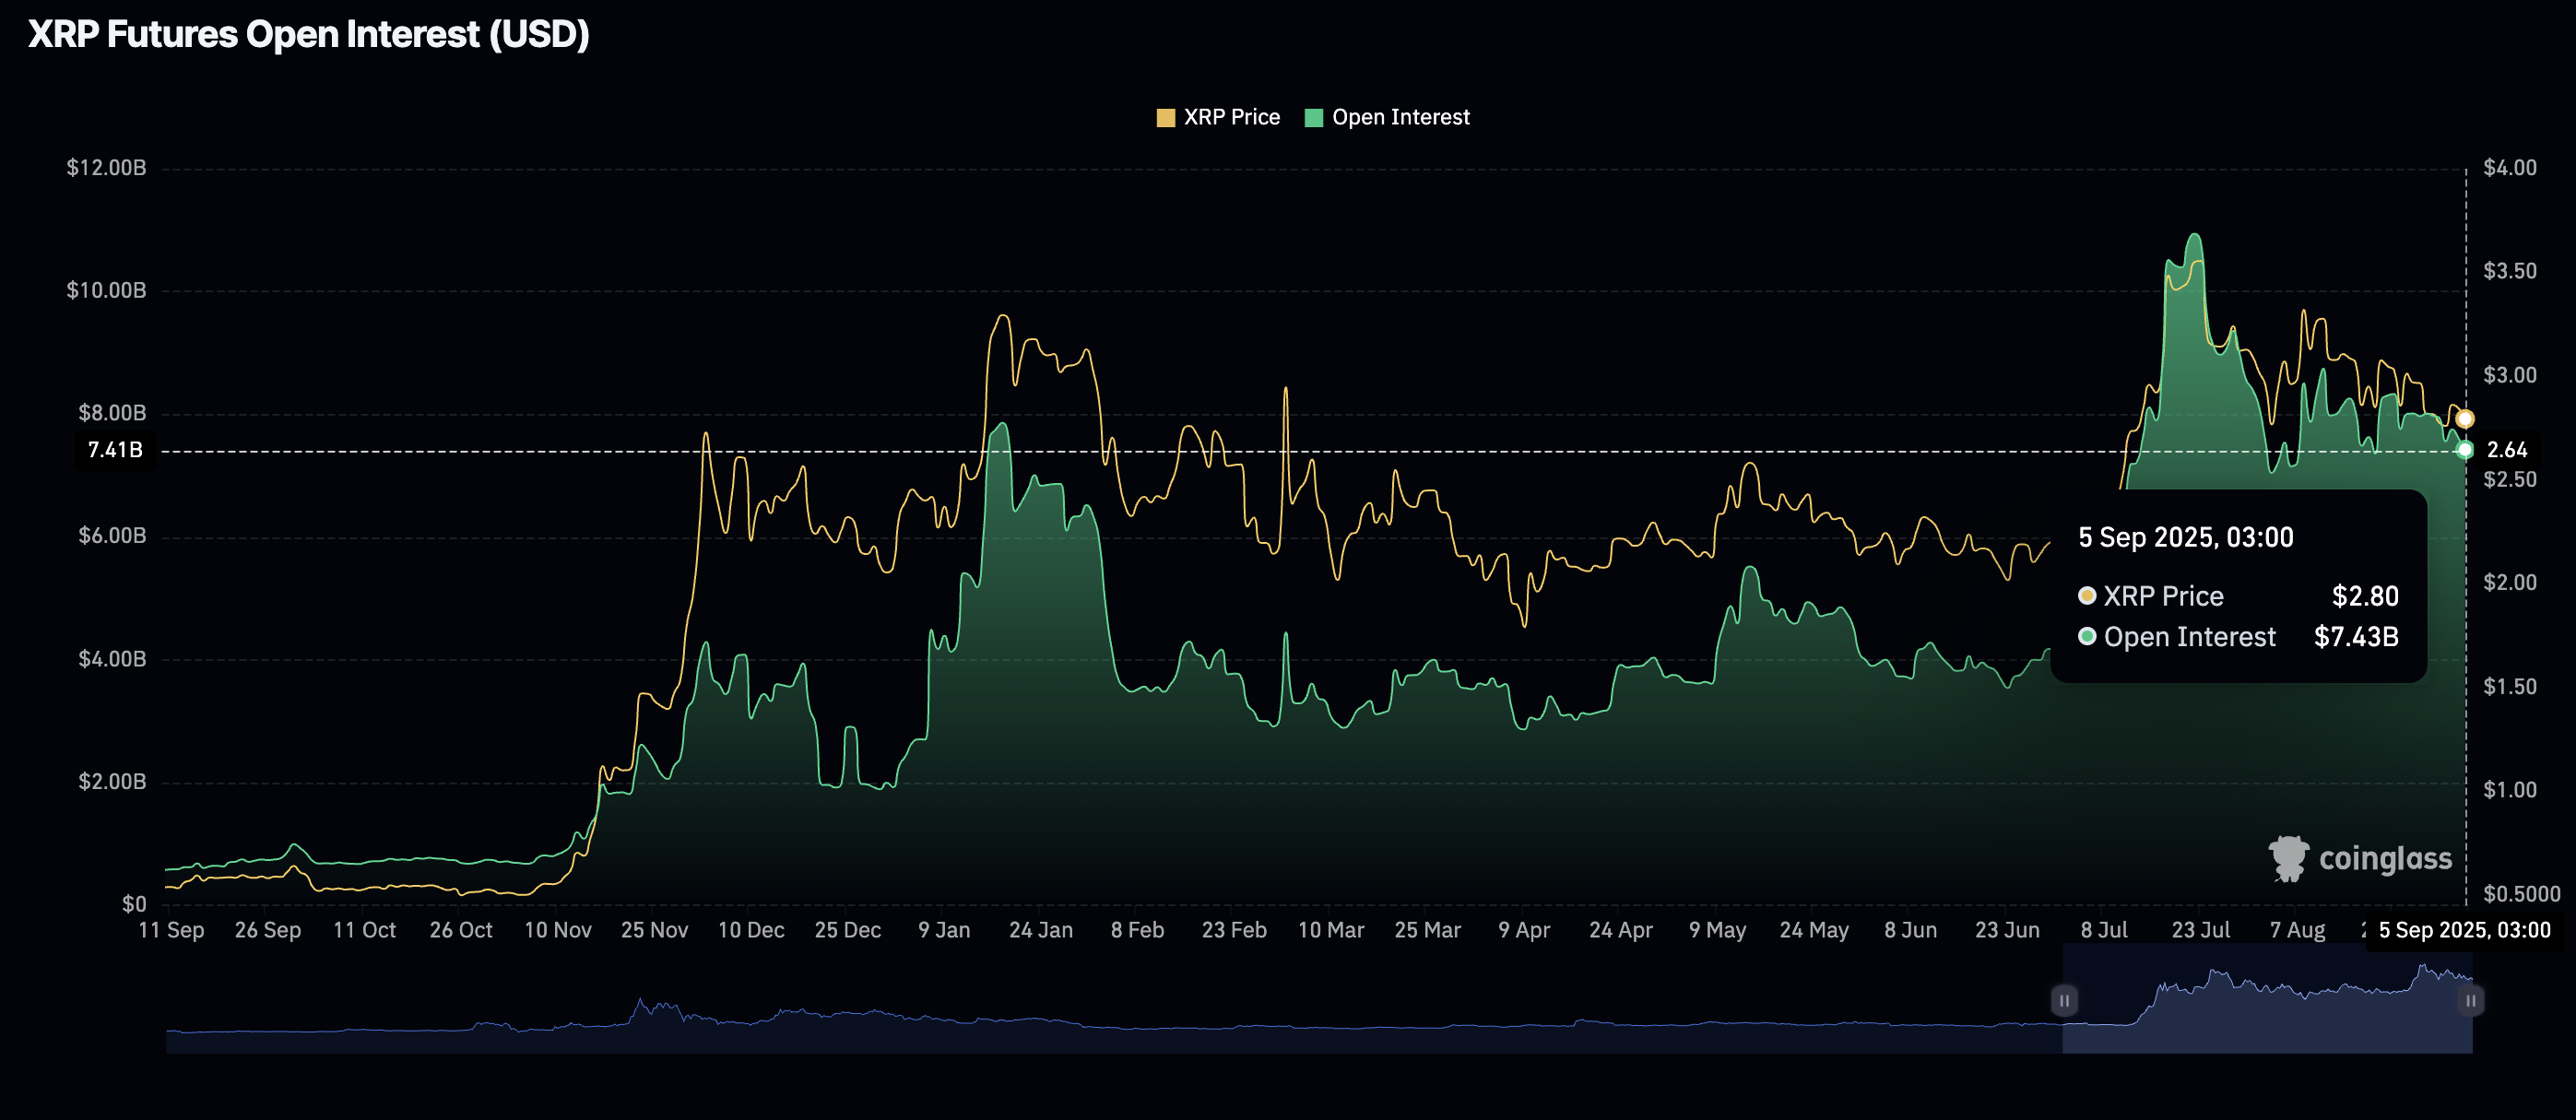
XRP futures Open Interest | Source: CoinGlass
Still, a positive futures weighted funding rate of 0.0083% implies that more traders are increasingly leveraging long positions in XRP. If the funding rate rises in the upcoming days, risk-on sentiment could bolster XRP, allowing it to sustain the recovery above the $3.00 psychological level.
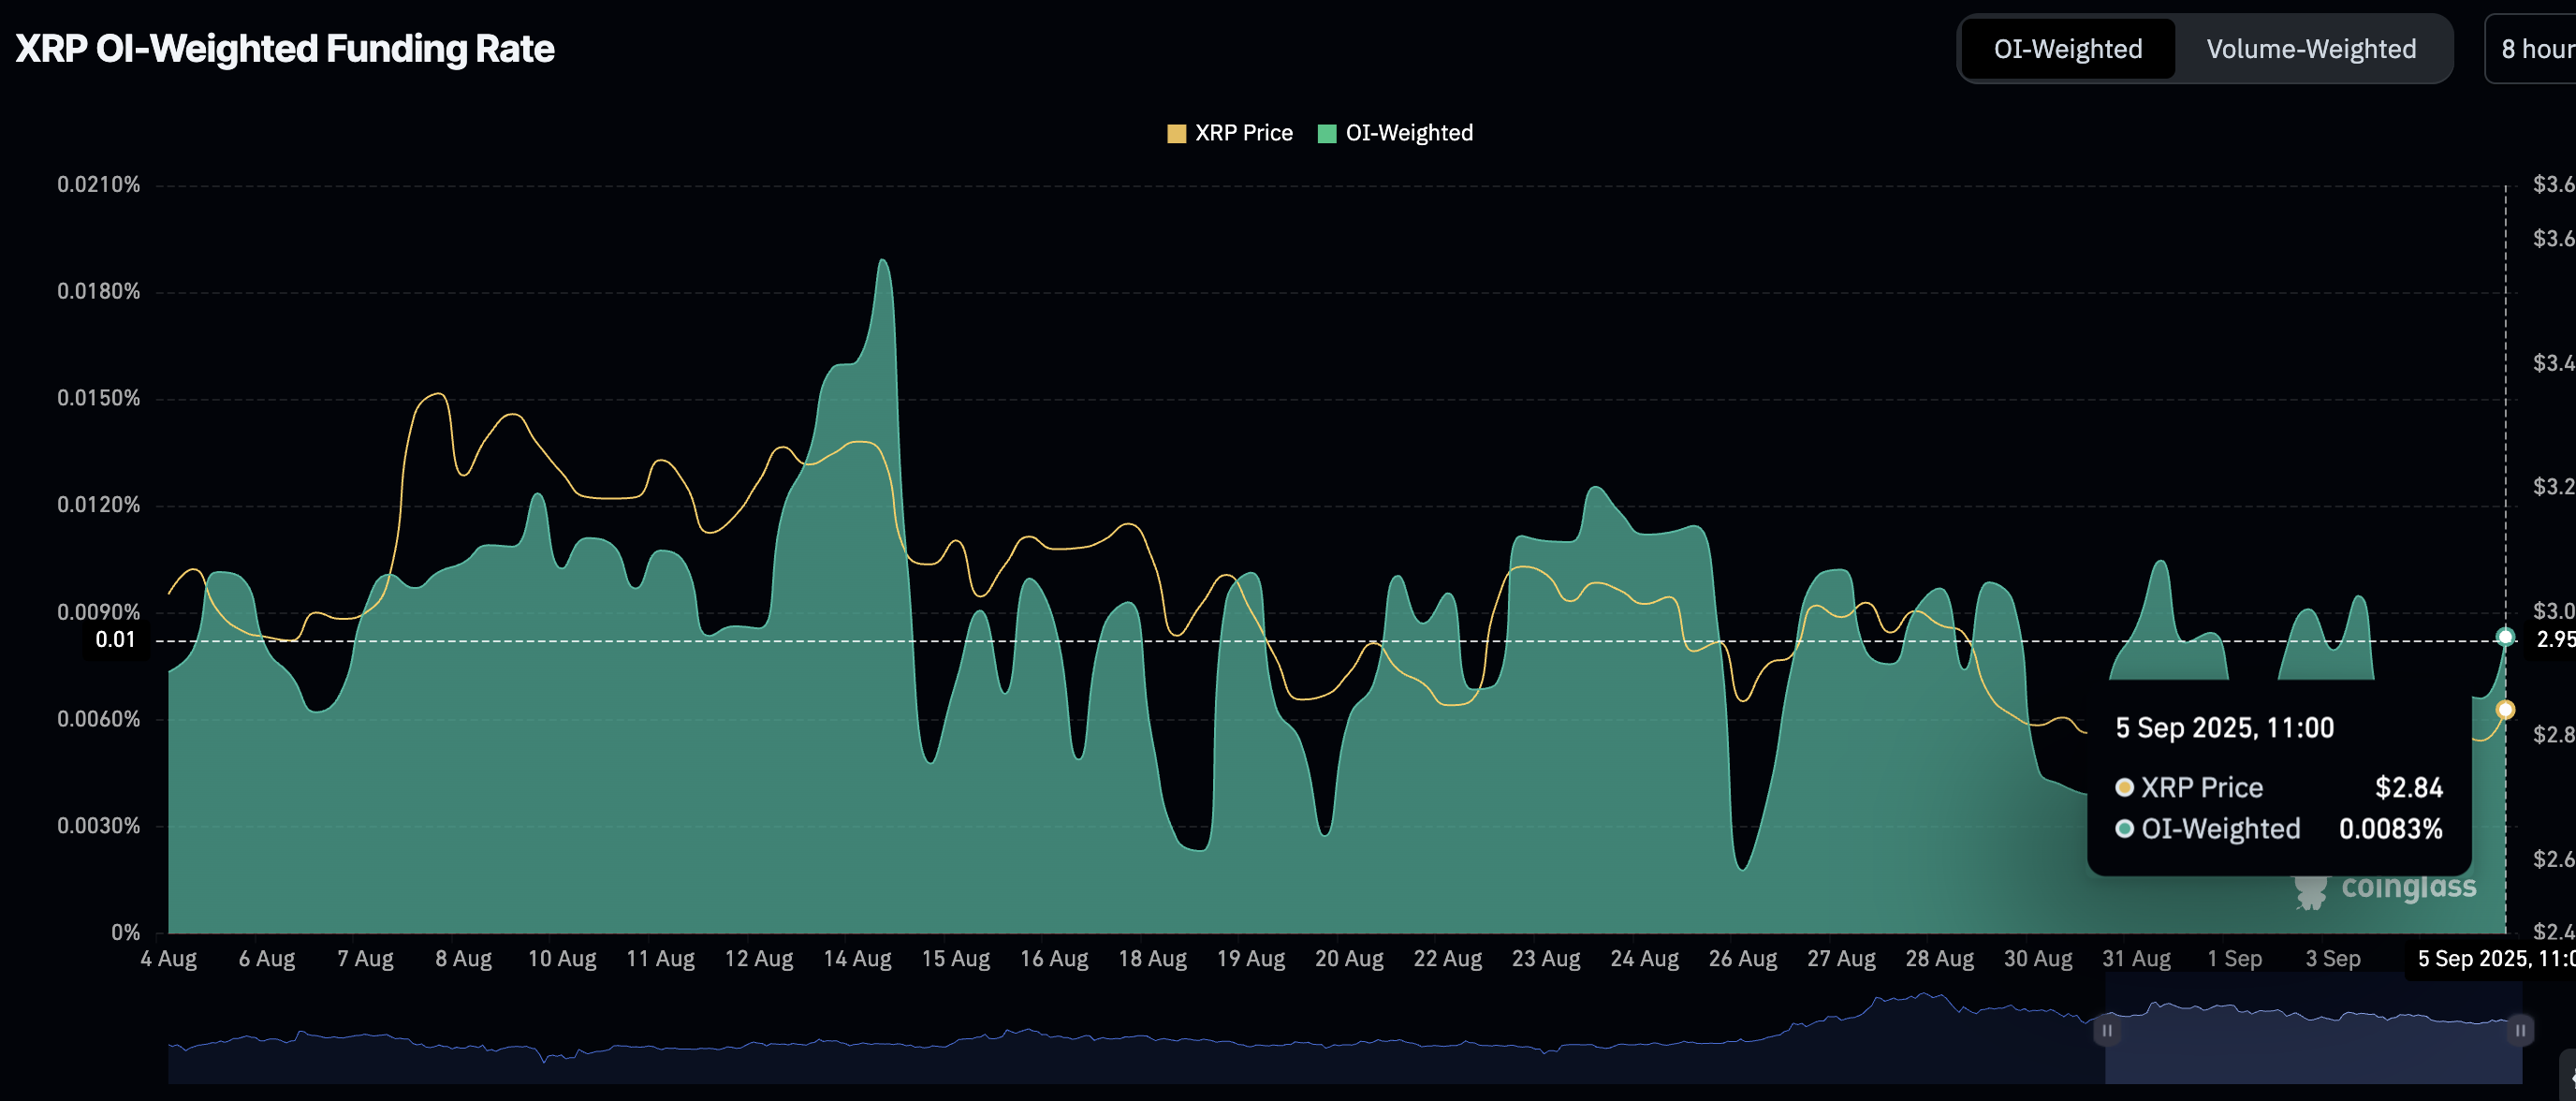
XRP Futures Weighted Funding rate | Source: CoinGlass
Technical outlook: XRP could extend its decline
XRP price is testing support at $2.80 after clawing back part of the intraday gains on Friday, reflecting the risk-off sentiment during the American session. The Relative Strength Index (RSI) at 46 and declining toward the oversold region indicates fading bullish momentum as the bears take control.
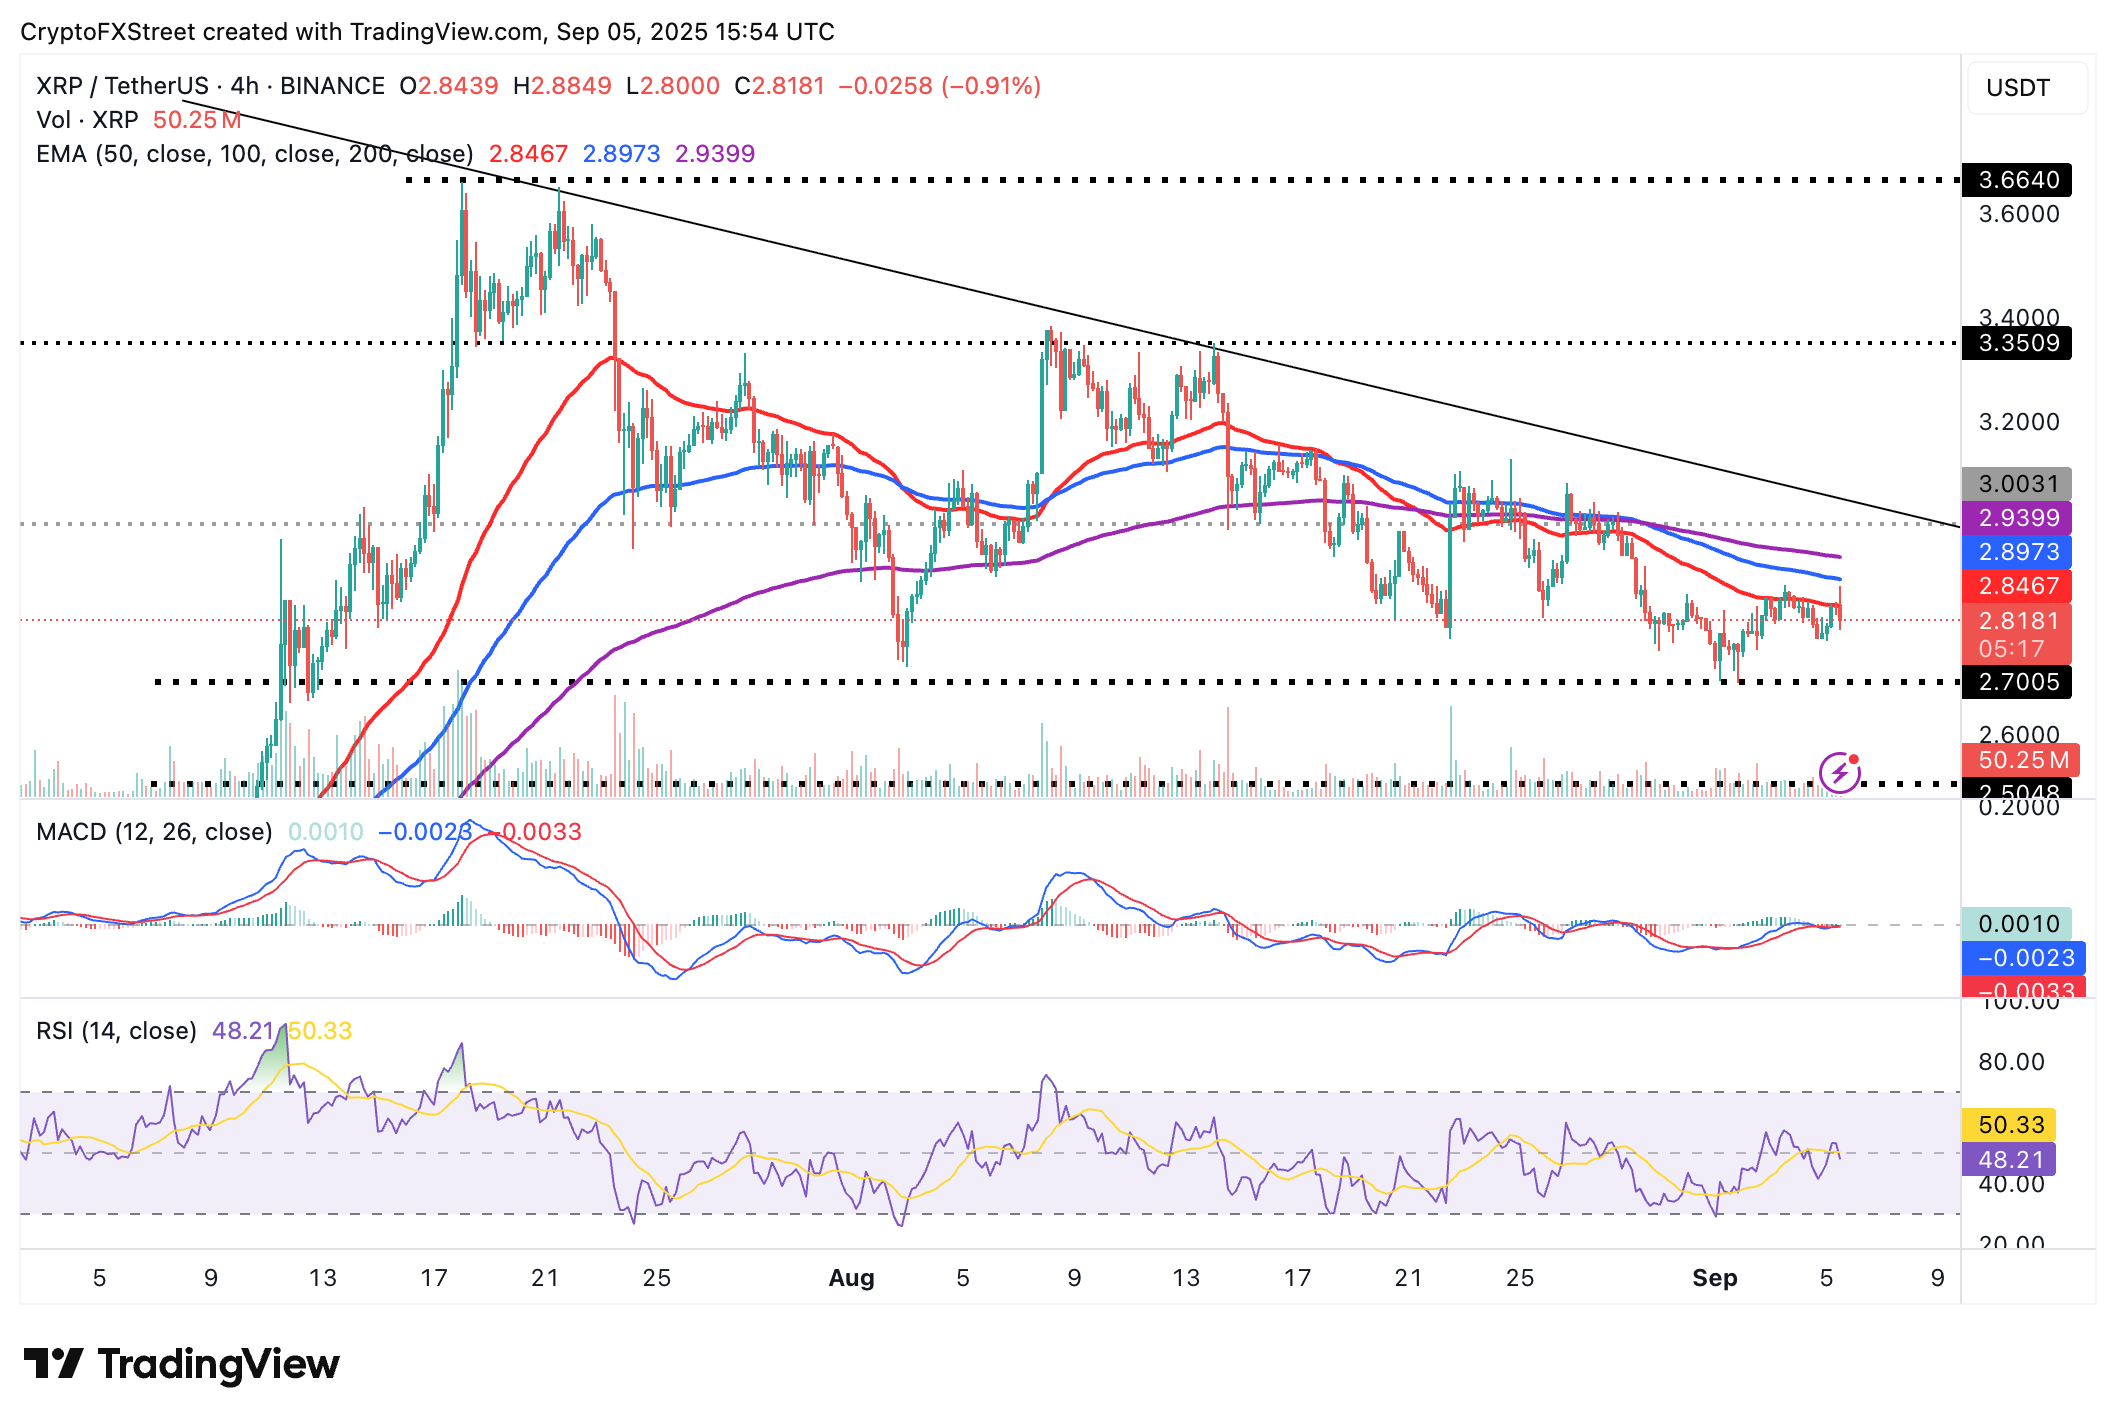
XRP/USDT 4-hour chart
The sideways movement in the Moving Average Convergence Divergence (MACD) indicator around the zero line indicates a tug-of-war between the bulls and the bears. If the MACD line in blue confirms a sell signal by dropping below the red signal line, the decline could accelerate to test support at $2.70.
If bulls regain control backed by investors buying the dip with support at $2.80 holding, a breakout above the 50-period EMA at $2.84 on the 4-hour chart could mark the beginning of an aggressive bullish push above the $3.00 pivotal level.
Cryptocurrency metrics FAQs
The developer or creator of each cryptocurrency decides on the total number of tokens that can be minted or issued. Only a certain number of these assets can be minted by mining, staking or other mechanisms. This is defined by the algorithm of the underlying blockchain technology. On the other hand, circulating supply can also be decreased via actions such as burning tokens, or mistakenly sending assets to addresses of other incompatible blockchains.
Market capitalization is the result of multiplying the circulating supply of a certain asset by the asset’s current market value.
Trading volume refers to the total number of tokens for a specific asset that has been transacted or exchanged between buyers and sellers within set trading hours, for example, 24 hours. It is used to gauge market sentiment, this metric combines all volumes on centralized exchanges and decentralized exchanges. Increasing trading volume often denotes the demand for a certain asset as more people are buying and selling the cryptocurrency.
Funding rates are a concept designed to encourage traders to take positions and ensure perpetual contract prices match spot markets. It defines a mechanism by exchanges to ensure that future prices and index prices periodic payments regularly converge. When the funding rate is positive, the price of the perpetual contract is higher than the mark price. This means traders who are bullish and have opened long positions pay traders who are in short positions. On the other hand, a negative funding rate means perpetual prices are below the mark price, and hence traders with short positions pay traders who have opened long positions.
Author

John Isige
FXStreet
John Isige is a seasoned cryptocurrency journalist and markets analyst committed to delivering high-quality, actionable insights tailored to traders, investors, and crypto enthusiasts. He enjoys deep dives into emerging Web3 tren



