Ripple Price Forecast: XRP exchange reserves soar signaling potential headwinds
- XRP sustains mid-week recovery as XRP/BTC flashes golden cross for the first time since 2017.
- Large volume holders increase XRP exposure, indicating rising demand and investor confidence.
- An increase in exchange reserves to 2.9 billion XRP from 2.7 billion XRP on May 1 signals potential selling pressure.

Ripple's (XRP) mid-week recovery remains stable as the token's price hovers at $2.44 at the time of writing on Friday. The uptick from support at $2.29 on Monday mirrored broader risk-on sentiment in the cryptocurrency market, which boosted Bitcoin's (BTC) price to new all-time highs of around $111,980. However, key on-chain metrics like Exchange Reserves and Supply Distribution show mixed signals, urging trader caution, which could slow the XRP uptrend targeting $3.00.
XRP's uptrend persists amid mixed on-chain signals
The uptick in XRP has been supported by positive broader sentiment in the market, as well as an increase in whale holdings over the past week. Santiment's Supply Distribution metric, shown in the chart below, highlights the targeted accumulation of XRP by investors with between 10 million and 100 million coins.
This cohort of investors currently holds 12.1% of the token's total supply, up from 11.88% recorded on May 12 and 11.58% on April 12. An increase in the risk appetite among whales implies confidence in the future of XRP as investors bet on a potential price increase.
 [12-1747999397677.32.40, 23 May, 2025].png)
XRP Supply Distribution metric
Traders might scale back optimism this weekend, as CryptoQuant's Exchange Reserve metric reveals a sharp rise in Binance's XRP holdings to 2.9 billion XRP from 2.7 billion XRP, as illustrated in the chart below.
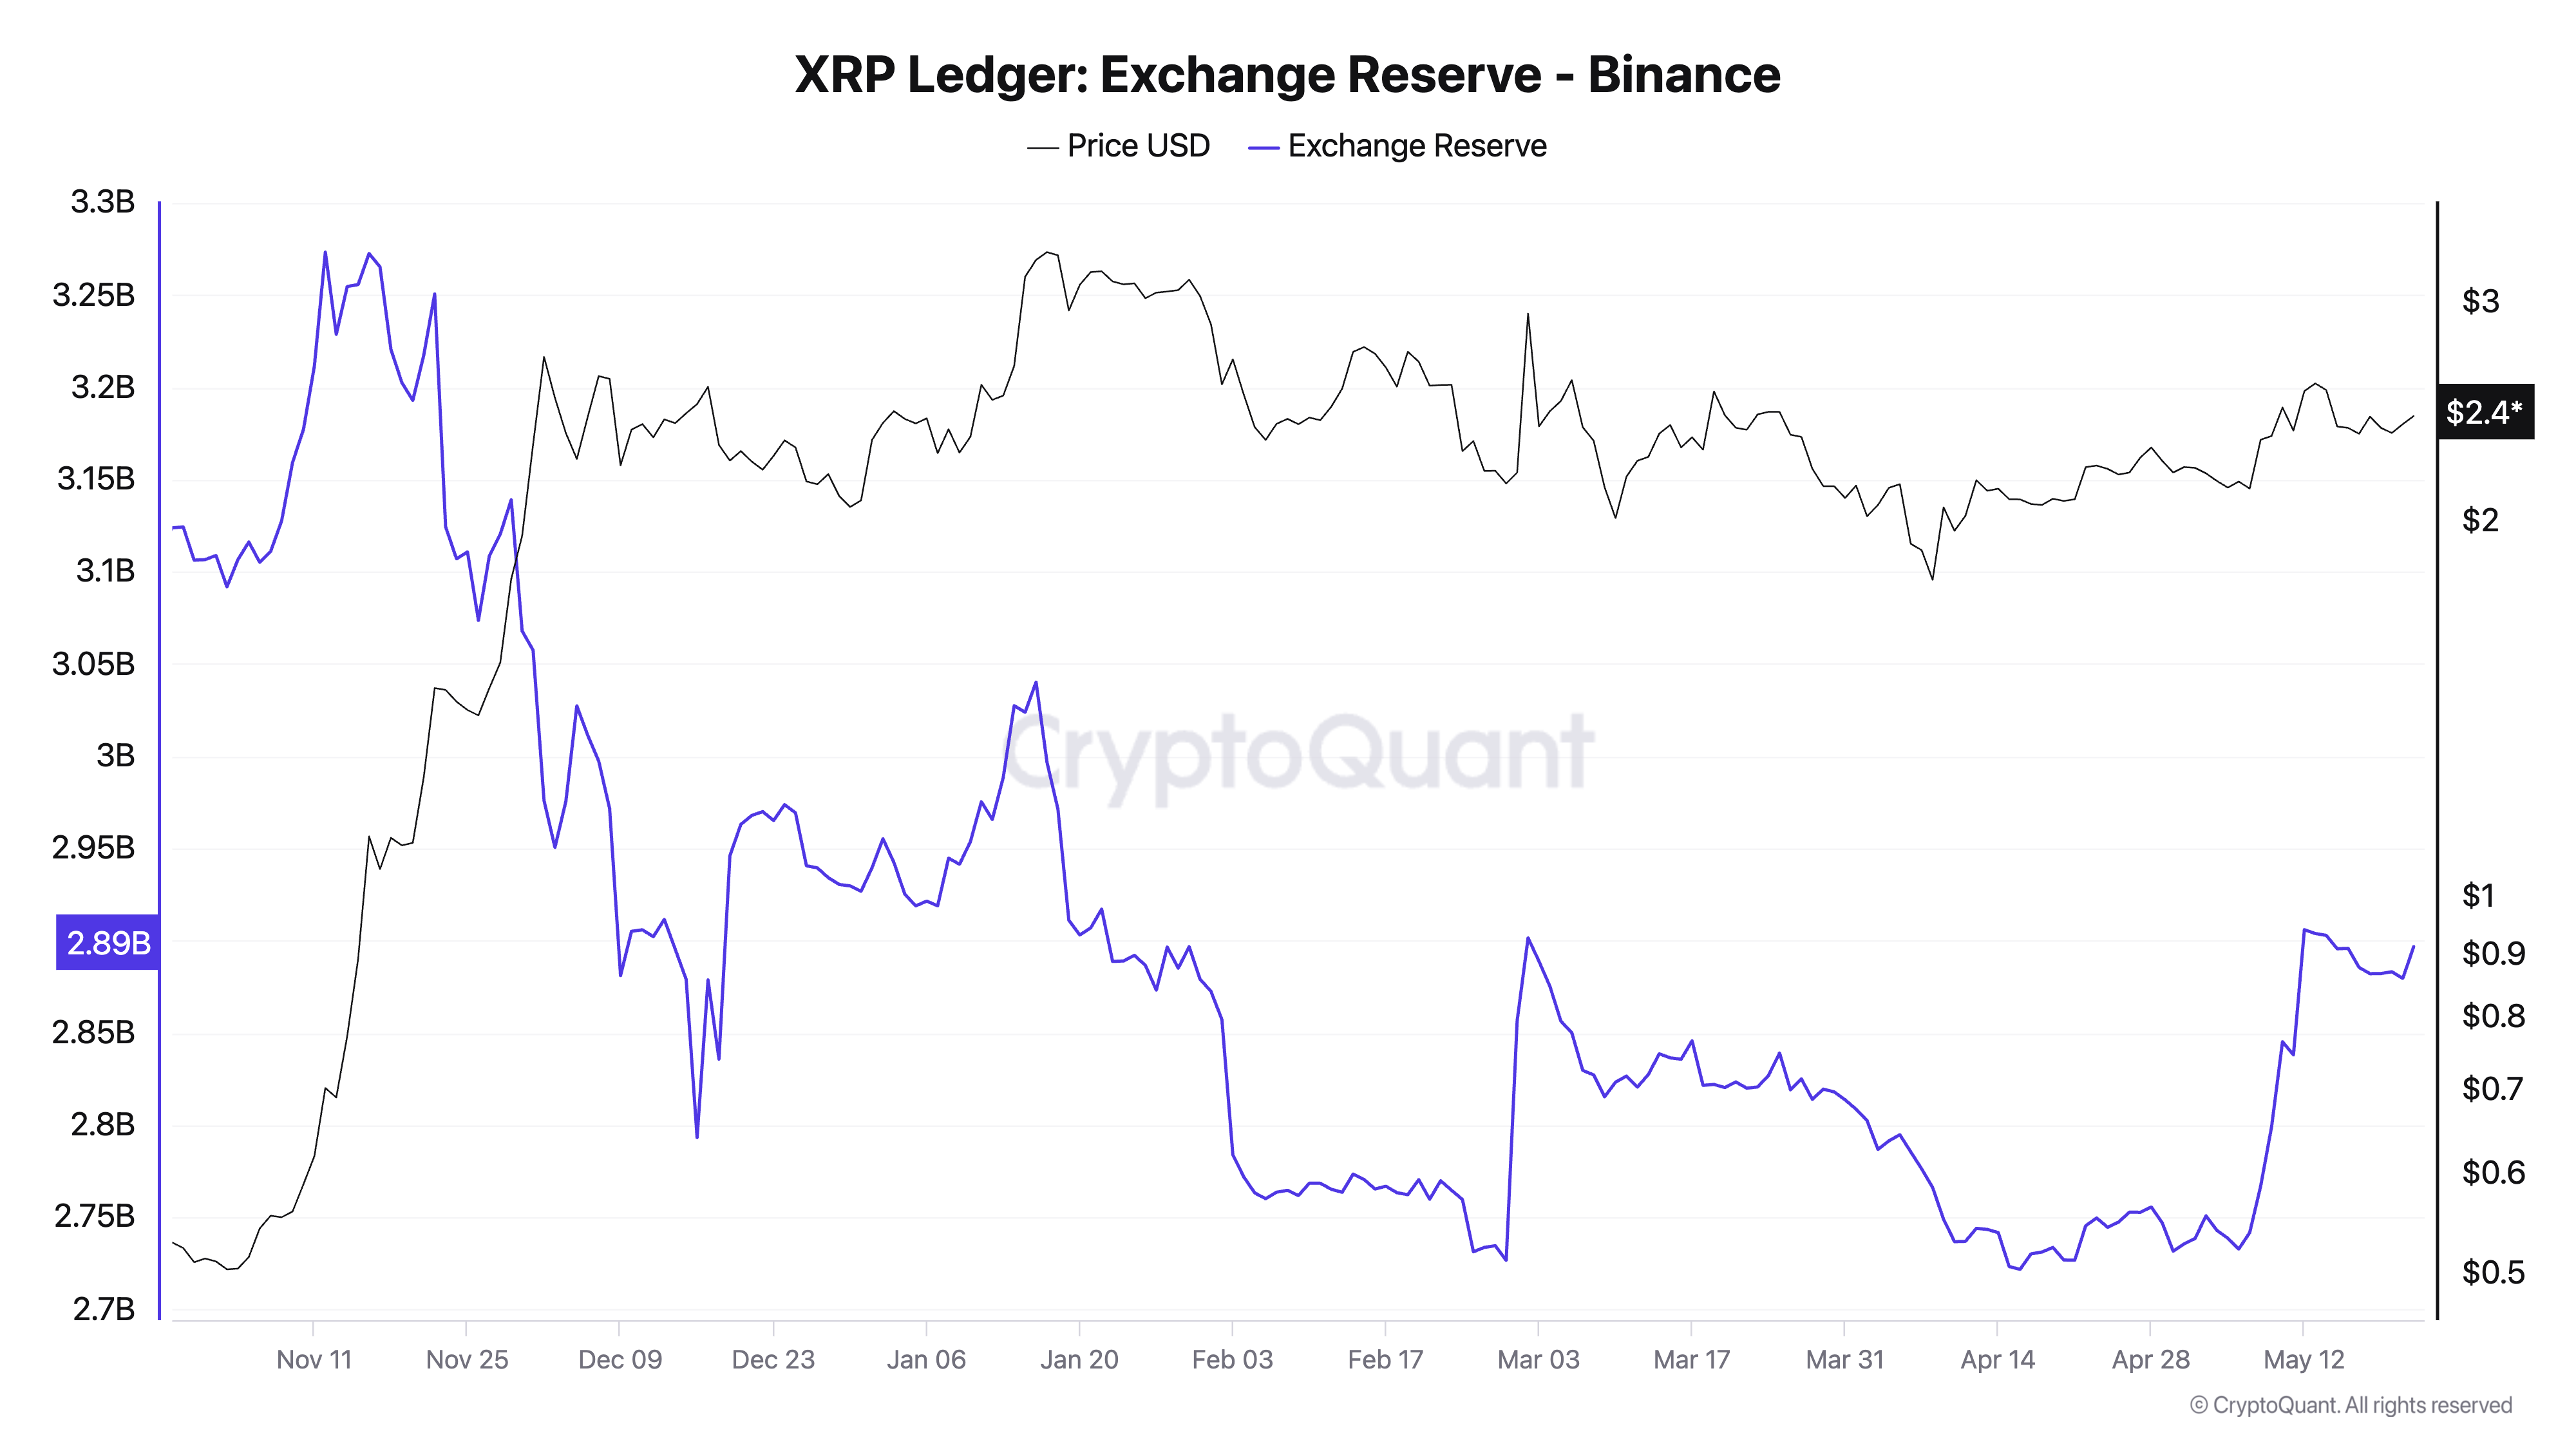
XRP Exchange Reserves | Source: CryptoQuant
As exchange reserves increase, so does the potential selling pressure or heightened volatility, especially if traders channel the coins to open both long and short positions. Generally, investors move holdings to exchange platforms intending to sell, which can significantly boost overhead pressure.
At the same time, the XRP futures contracts' Open Interest (OI) increased to $4.94 billion after falling to $4.59 billion on Wednesday. An uptick in OI suggests that trader interest is growing alongside market participation.
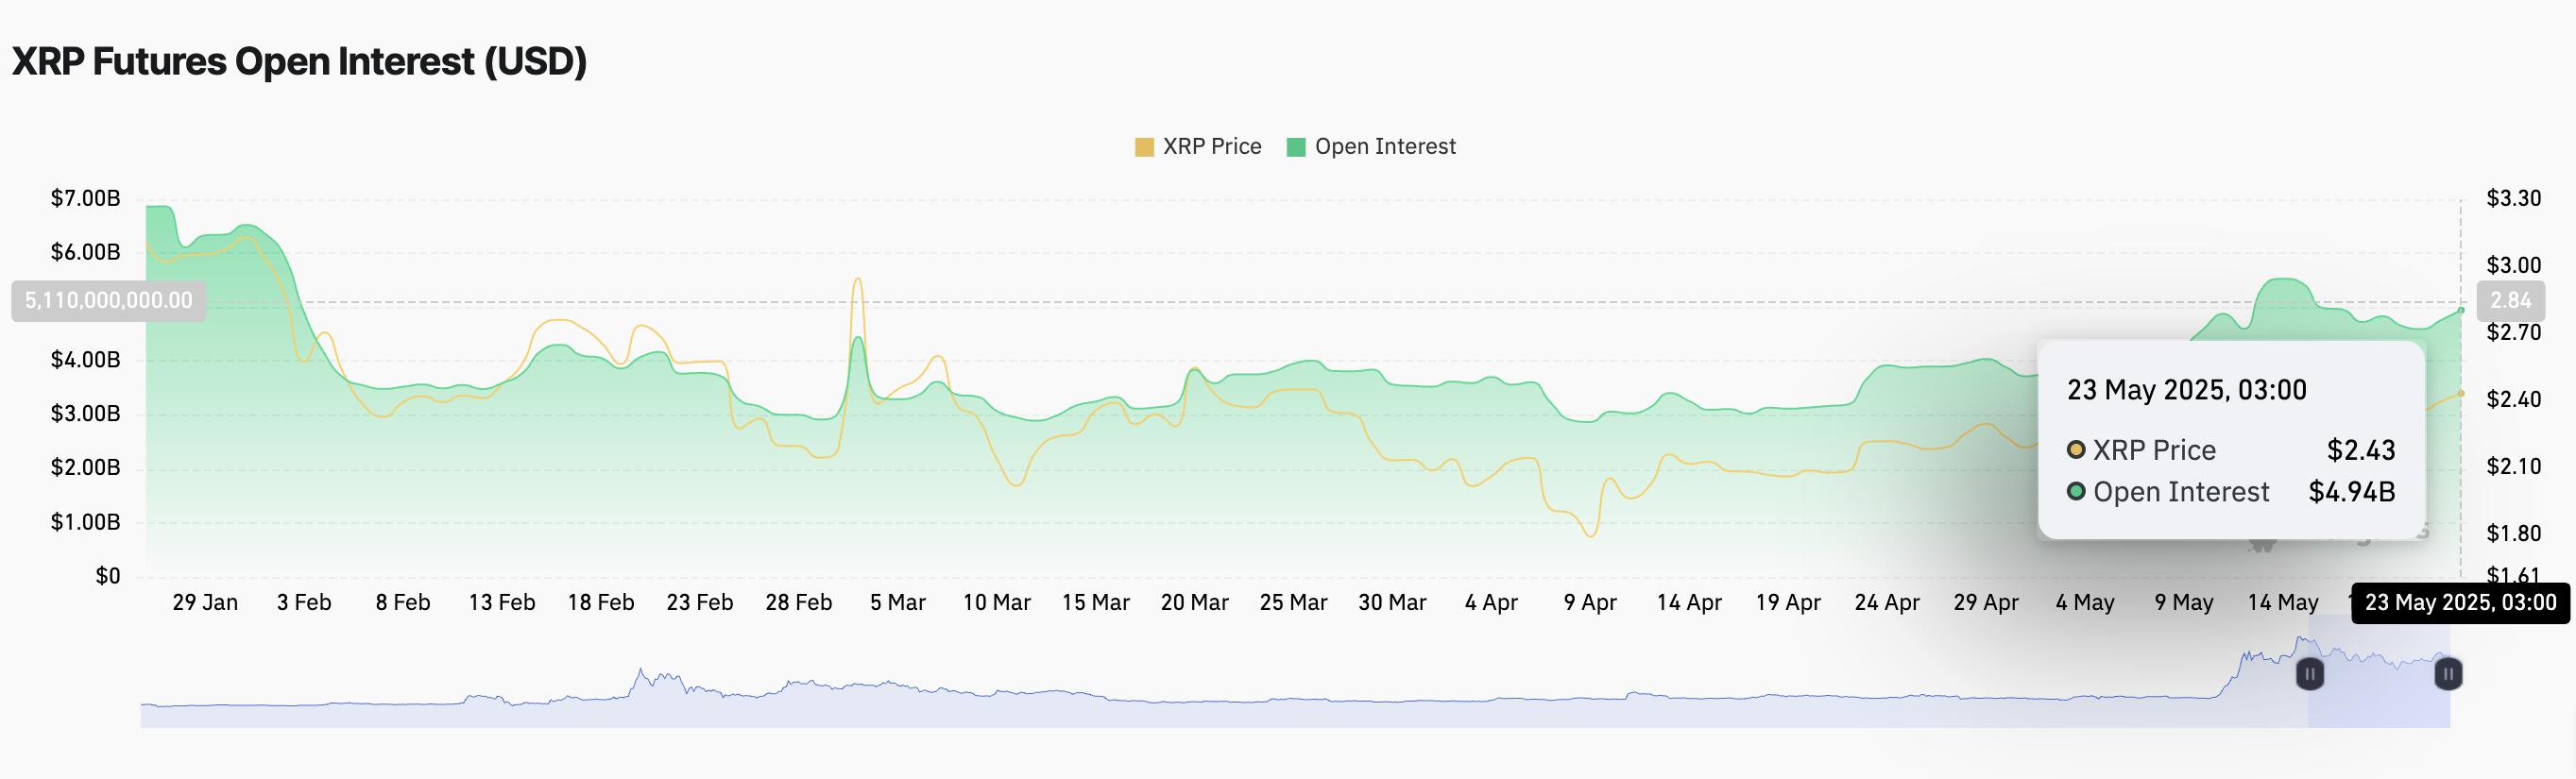
XRP futures Open Interest | Source: CoinGlass
As observed on the chart below, rising trading volume to $4.63 billion alongside the uptrend in OI signals heightened market activity and investor enthusiasm. This could fuel the ongoing uptrend for a return above $3.00.
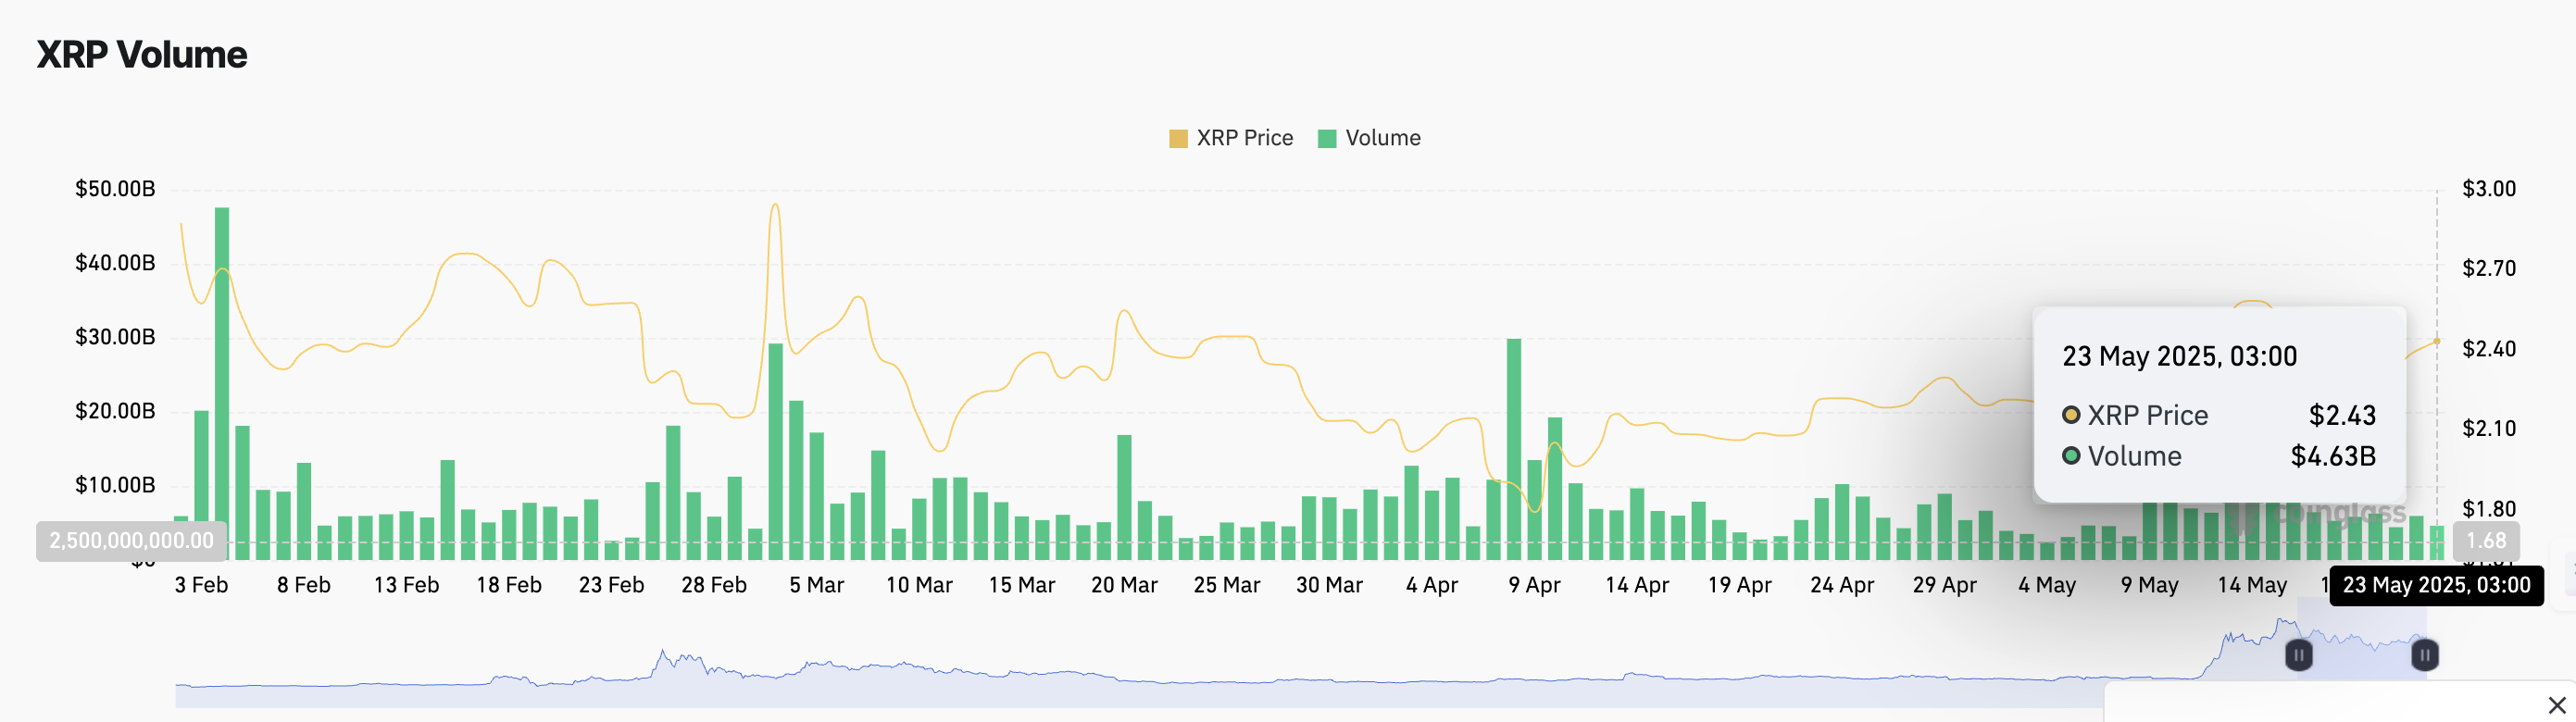
XRP futures volume | Source: CoinGlass
Looking ahead: XRP's rally holds steady
The mid-week resumed uptrend appears to hold steady above upward-trending moving averages, including the 50-day Exponential Moving Average (EMA) at $2.30, the 100-day EMA at $2.26 and the 200-day EMA at $2.06.
A higher low pattern established along an ascending trendline (dotted) affirms bullish control, supported by the Relative Strength Index (RSI) indicator's slight uptrend bias above the 50 midline. Movement of the RSI toward the overbought region above 70 would mean a strong uptrend.
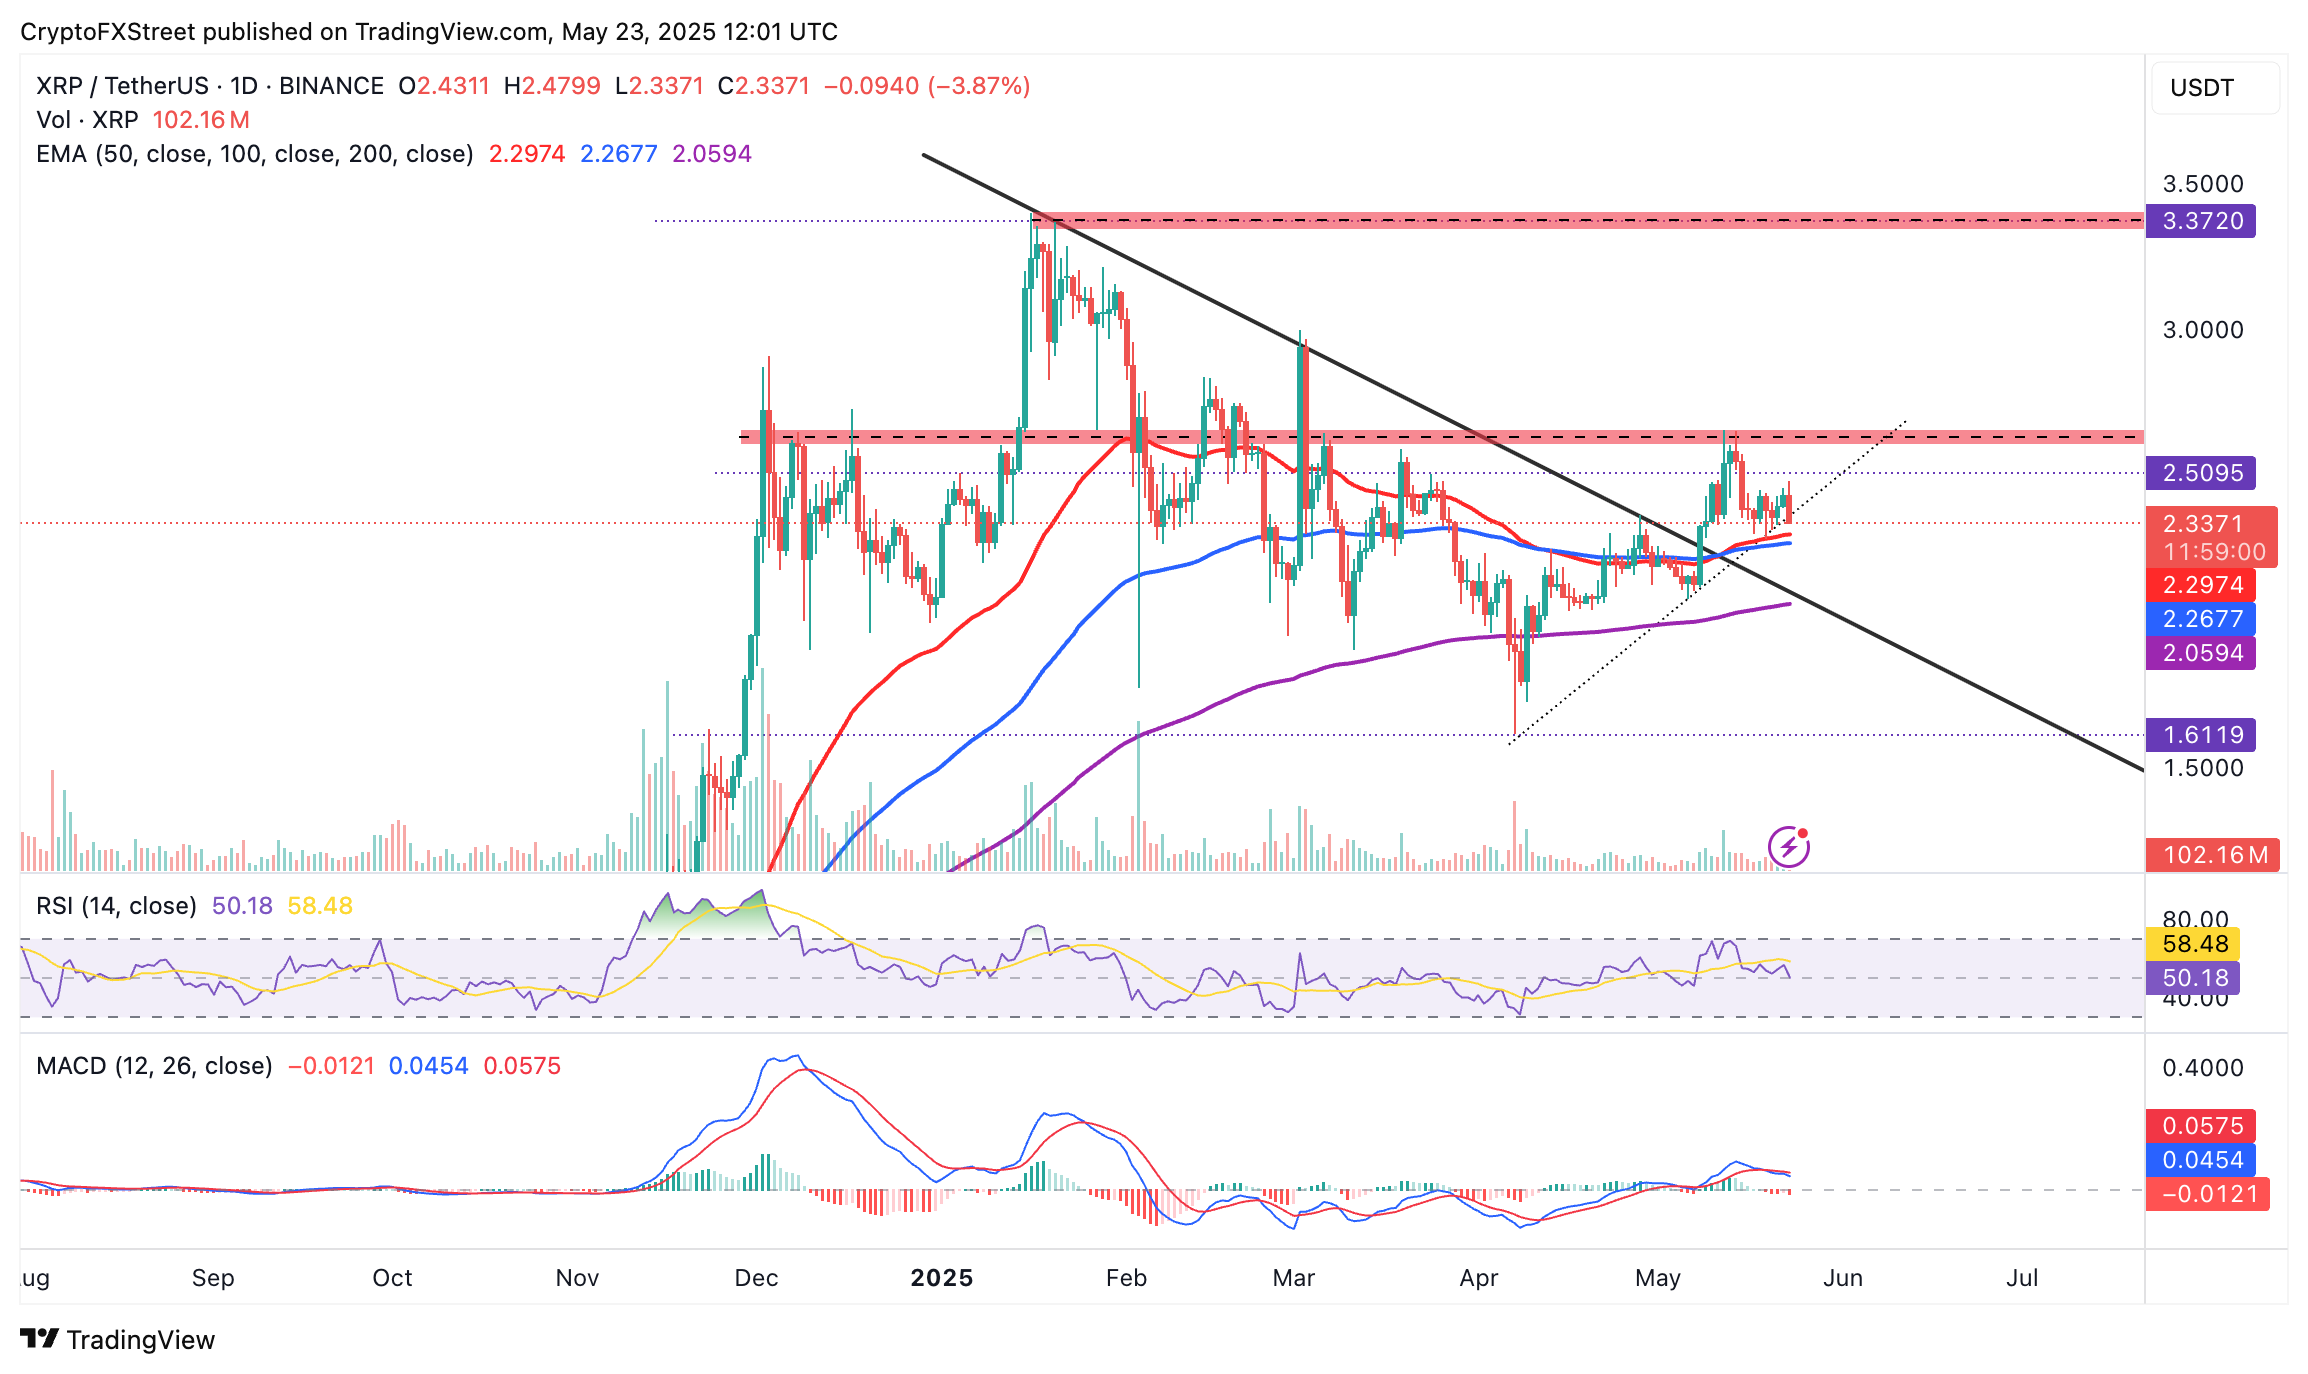
XRP/USDT daily chart
On the other hand, levels to watch in case of an increase in selling pressure include the 50-day EMA at $2.30, the 100-day EMA at $2.26 and the 200-day EMA at $2.06.
Despite the mixed signals flaunted by XRP's on-chain metrics and the technical outlook, the XRP/BTC trading pair has confirmed a golden cross pattern for the first time since 2017 in the weekly time frame, as shown in the chart.
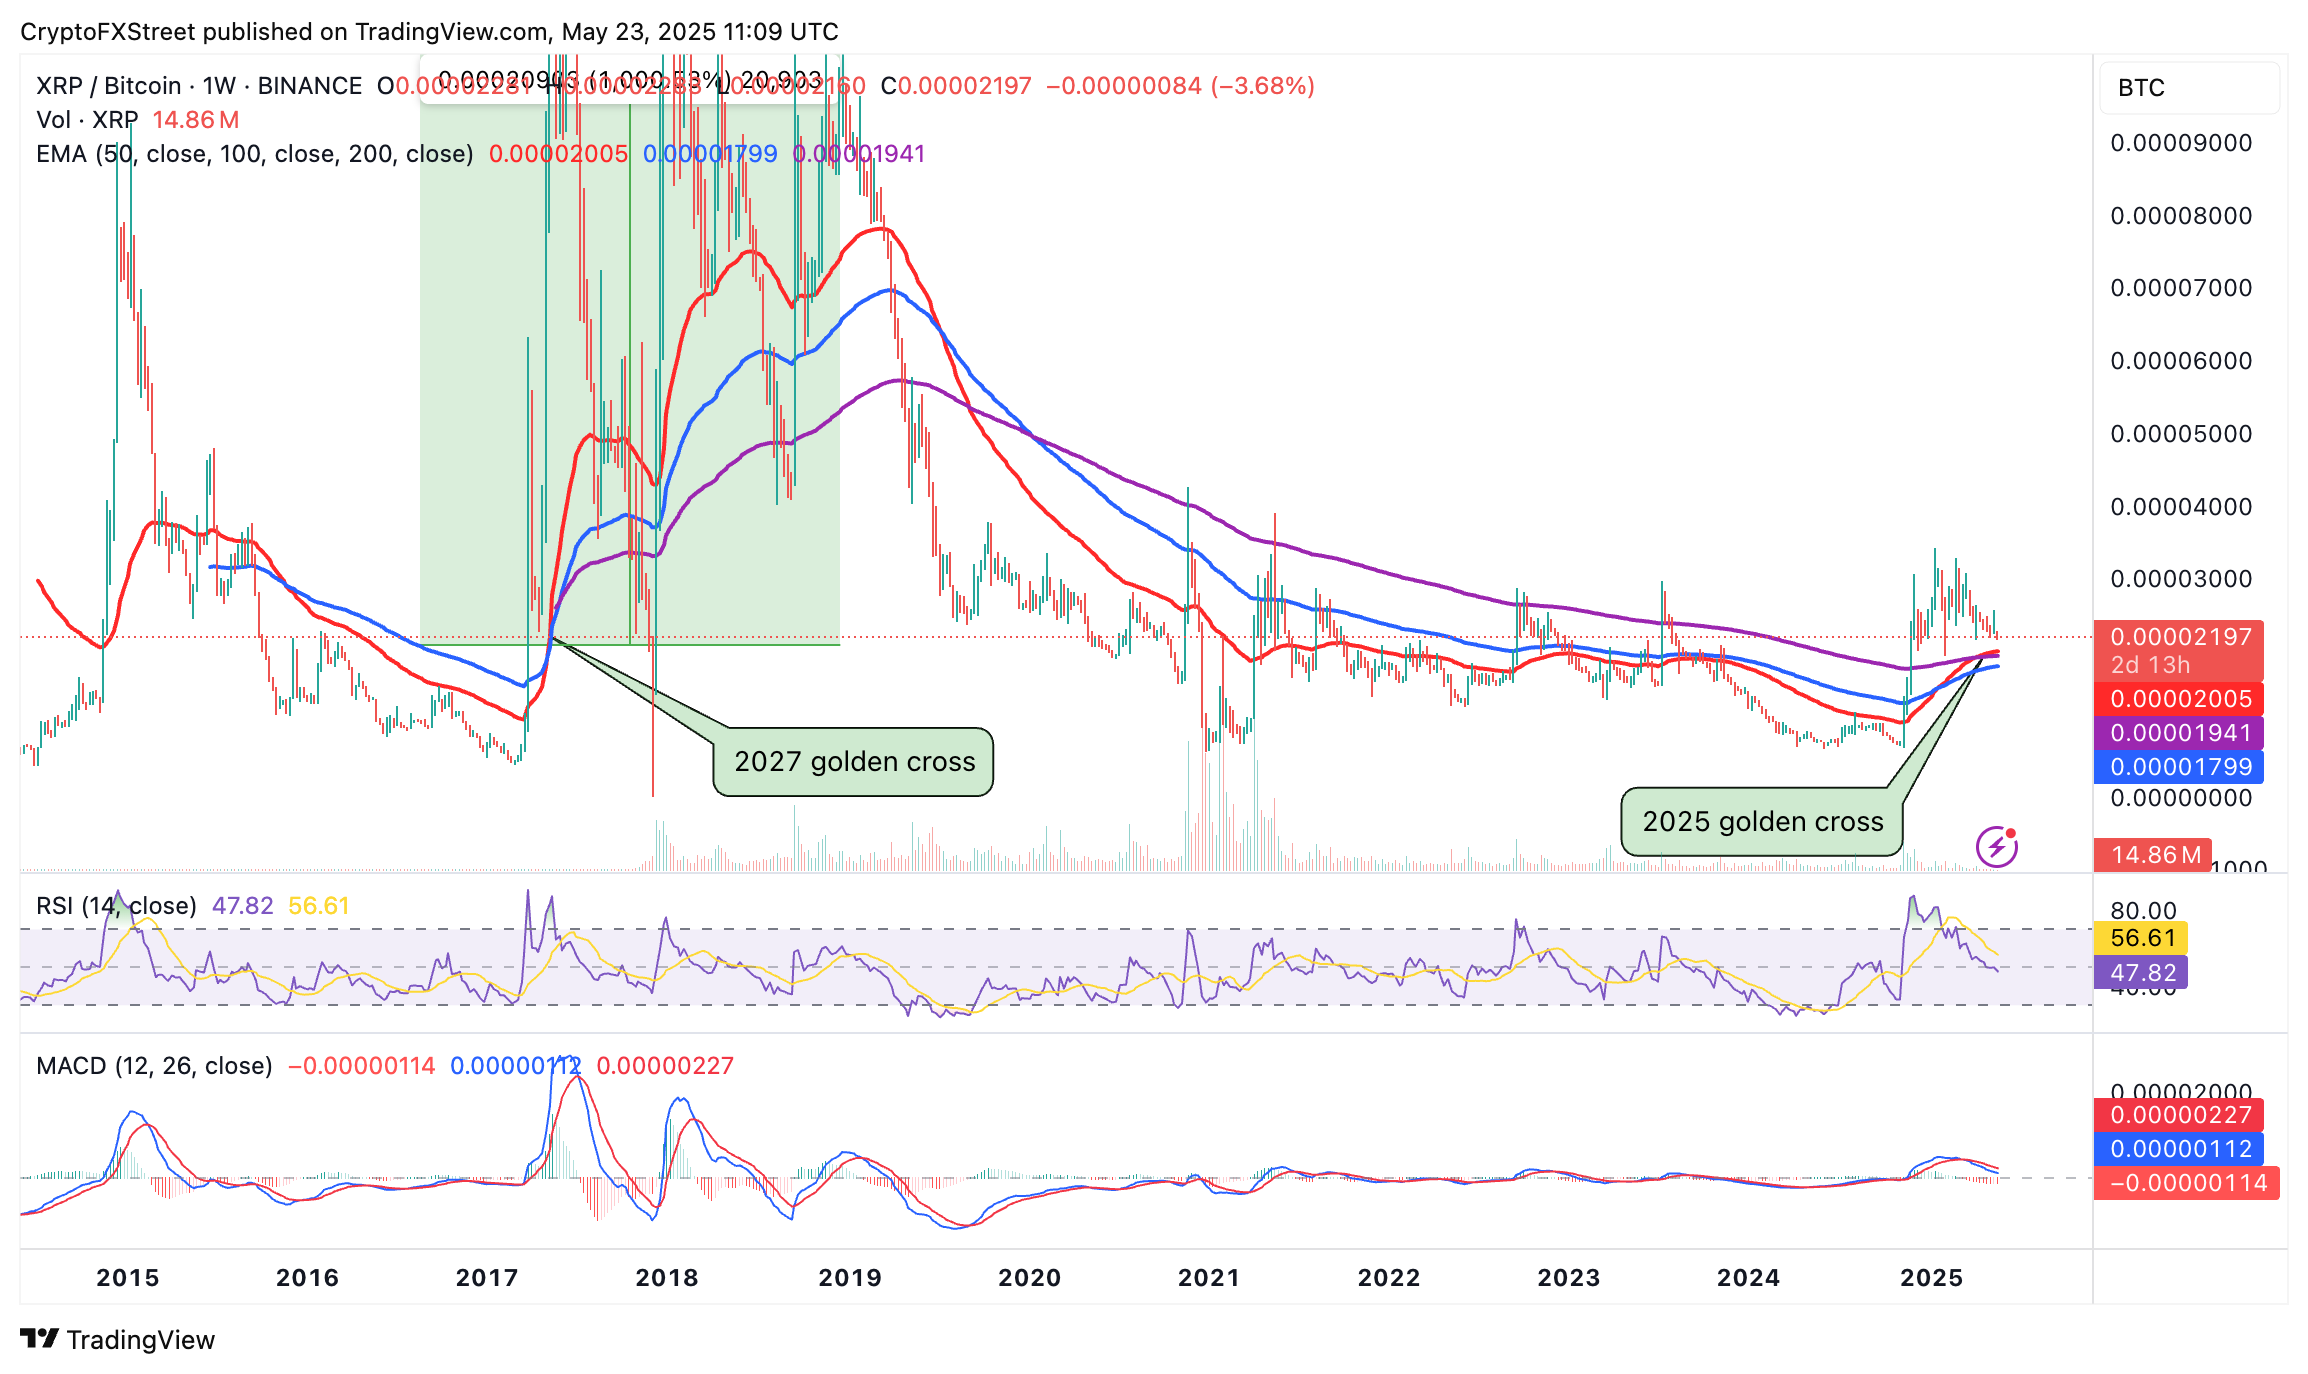
XRP/BTC weekly chart
A golden cross is a bullish pattern that occurs when a shorter-term moving average flips above a longer-term one. For instance, on the chart above, the 50-week EMA currently sits above the 200-week EMA, hinting at a potentially massive bull run.
The 2017 golden cross gave way to a massive 1,000% rally from a ratio of 0.00002 to 0.00022, which coincided with XRP's price surge to all-time highs of $3.40 in January 2018.
Cryptocurrency prices FAQs
Token launches influence demand and adoption among market participants. Listings on crypto exchanges deepen the liquidity for an asset and add new participants to an asset’s network. This is typically bullish for a digital asset.
A hack is an event in which an attacker captures a large volume of the asset from a DeFi bridge or hot wallet of an exchange or any other crypto platform via exploits, bugs or other methods. The exploiter then transfers these tokens out of the exchange platforms to ultimately sell or swap the assets for other cryptocurrencies or stablecoins. Such events often involve an en masse panic triggering a sell-off in the affected assets.
Macroeconomic events like the US Federal Reserve’s decision on interest rates influence crypto assets mainly through the direct impact they have on the US Dollar. An increase in interest rate typically negatively influences Bitcoin and altcoin prices, and vice versa. If the US Dollar index declines, risk assets and associated leverage for trading gets cheaper, in turn driving crypto prices higher.
Halvings are typically considered bullish events as they slash the block reward in half for miners, constricting the supply of the asset. At consistent demand if the supply reduces, the asset’s price climbs.
Author

John Isige
FXStreet
John Isige is a seasoned cryptocurrency journalist and markets analyst committed to delivering high-quality, actionable insights tailored to traders, investors, and crypto enthusiasts. He enjoys deep dives into emerging Web3 tren



