Assessing XRP price bullish tilt amid soaring exchange reserves
- XRP fluctuates between the 100-day EMA support and the 50-day EMA resistance on Monday.
- XRP recovery could face challenges as exchange reserves increase, exceeding 3.6 billion tokens.
- A weak XRP derivatives market hints at low retail demand.

Ripple (XRP) edges higher on Monday, trading between a key support established at $2.83 and resistance at $2.92. This short-term bullish outlook reflects the subtle recovery in the broader cryptocurrency market, which has been mirrored by Bitcoin (BTC) and Ethereum (ETH) since Friday.
If bulls steady the uptrend toward the critical $3.00 level, the path of least resistance could remain upward, increasing the chances of a breakout and targeting the all-time high of $3.66 reached on July 18. Still, traders may need to assess key metrics and indicators to gain insight into XRP's ability to sustain the uptrend, or resume the downtrend toward the round-number support at $2.50.
XRP exchange reserves expand amid a weak derivatives market
XRP holders have transferred large amounts of the token into exchanges since the beginning of September, thereby increasing reserves. According to CryptoQuant data, reserves on Binance increased by 19.4% to 3.6 billion XRP from 2.9 billion XRP as of Sunday. This surge coincided with the XRP price declining from $3.18 on September 13 to around $2.70 on September 22.
Increasing exchange reserves often signal incoming selling pressure. Investors often transfer assets to exchanges with the intention of selling. The move also signals a lack of confidence in XRP's ability to sustain the uptrend. This metric is worth monitoring, as a steady increase in exchange reserves often signals headwinds that precede sell-off activities.
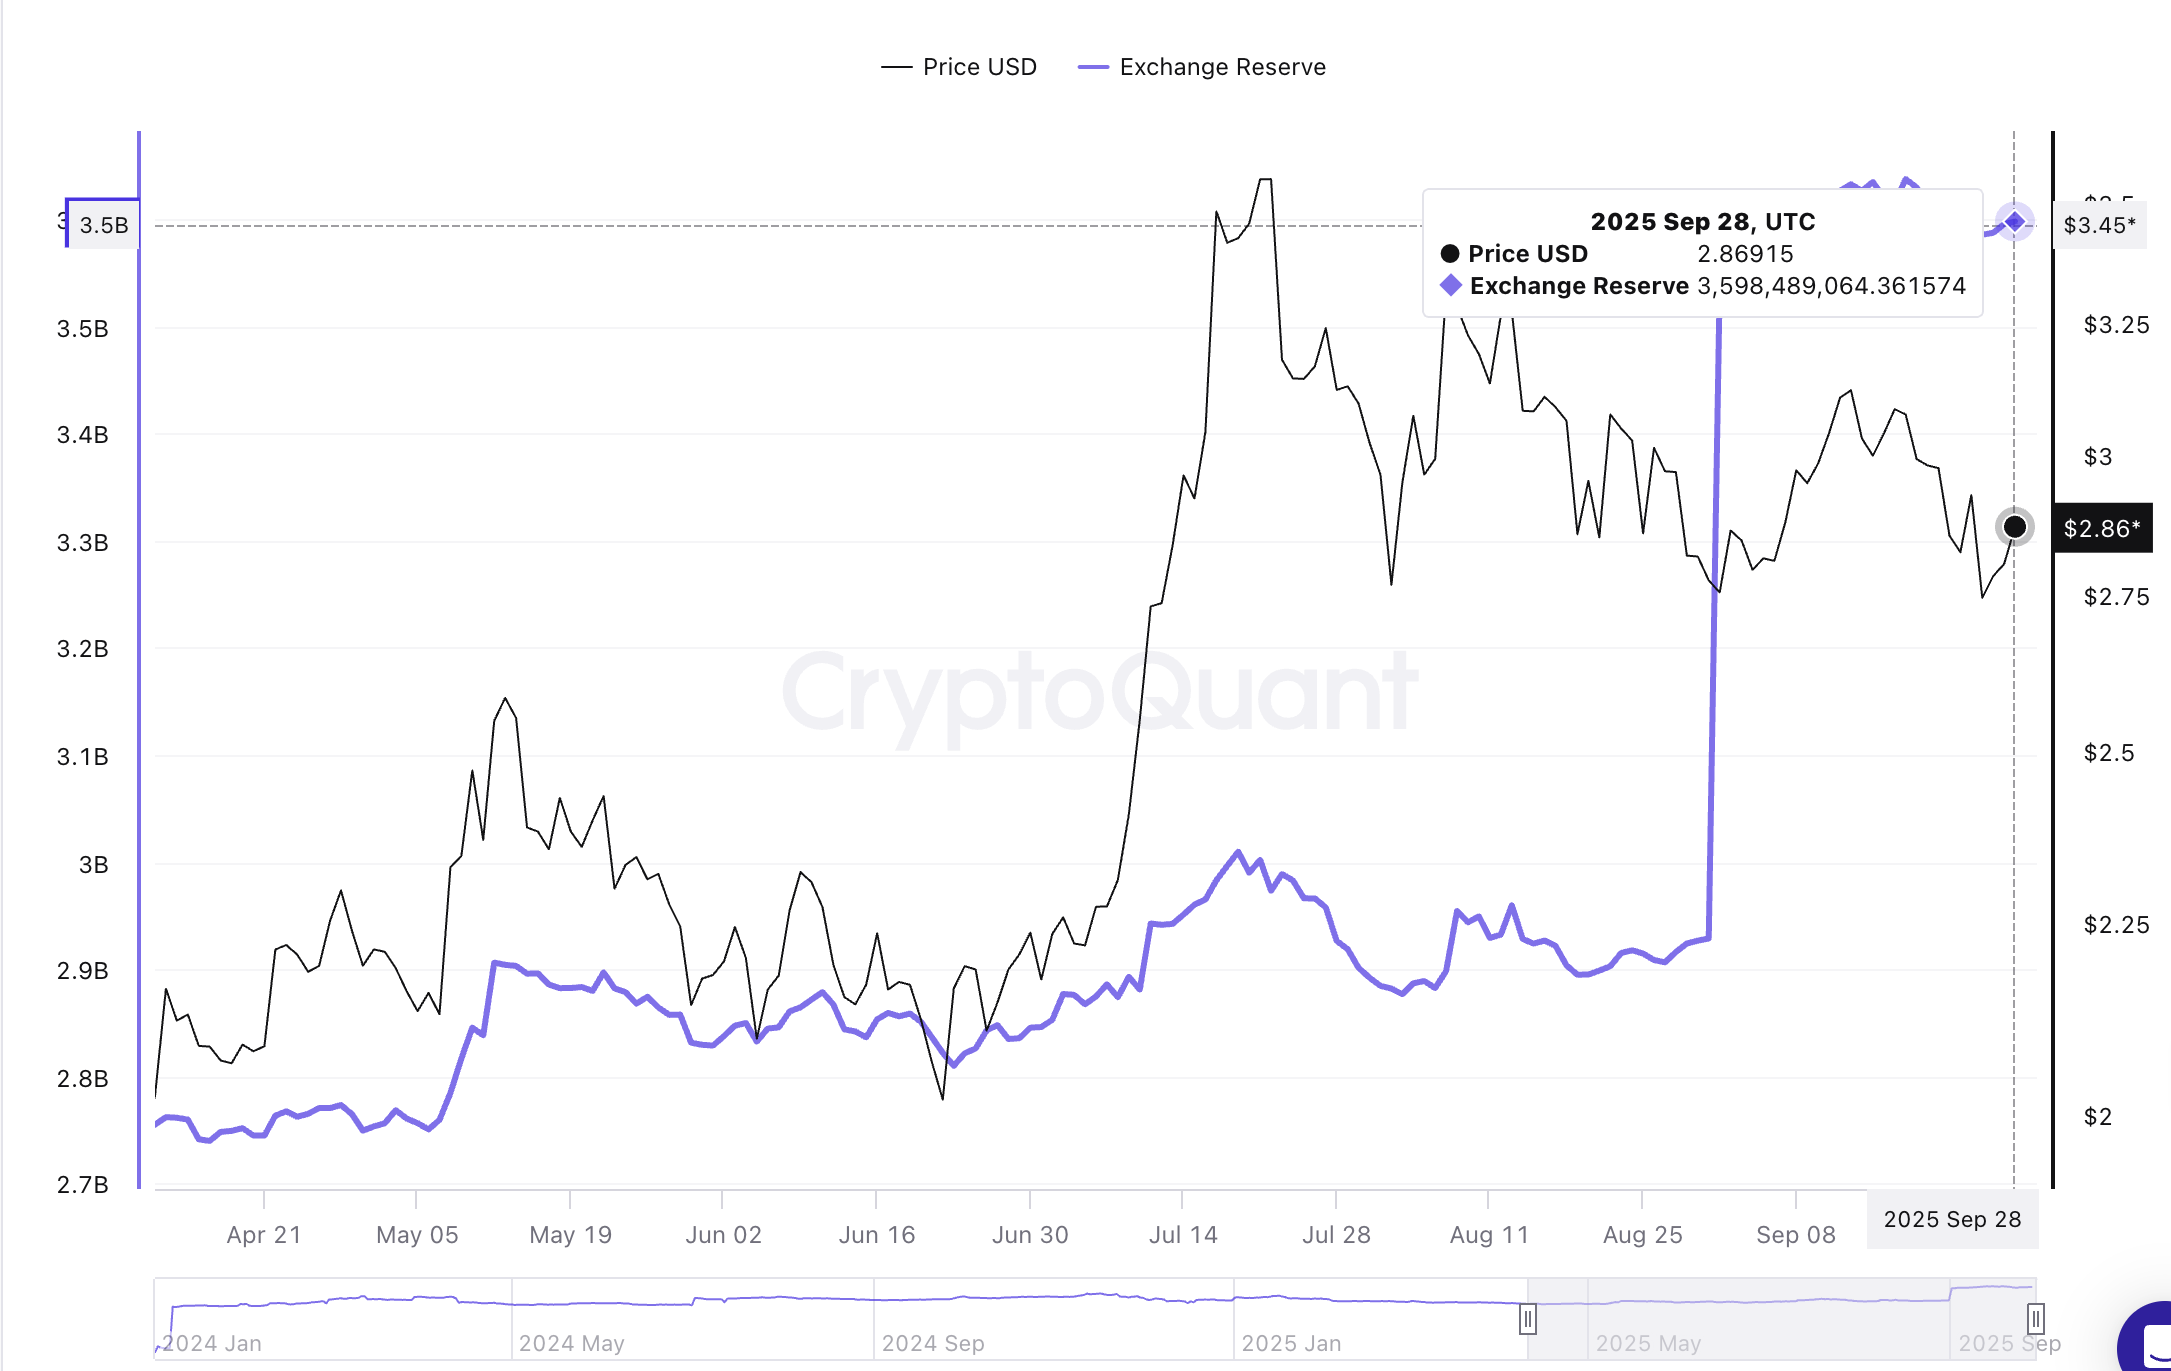
XRP Ledger: Exchange Reserve - Binance | Source: CryptoQuant
Meanwhile, retail interest in XRP has remained relatively suppressed since mid-July, marking the correction from the all-time high. CoinGlass data indicates that the futures Open Interest (OI), referring to the notional value of all futures contracts, averaged $7.56 billion by the time of writing on Monday after peaking at a record high of $10.94 billion on July 22.
Low or declining OI suggests reduced market participation, as fewer traders hold positions in XRP futures. With dwindling engagement, there is less speculation, which limits short-term price movement. Sentiment around XRP could remain bearish amid declining OI, especially if the liquidation of long positions persists, leaving traders counting losses as was experienced last week.
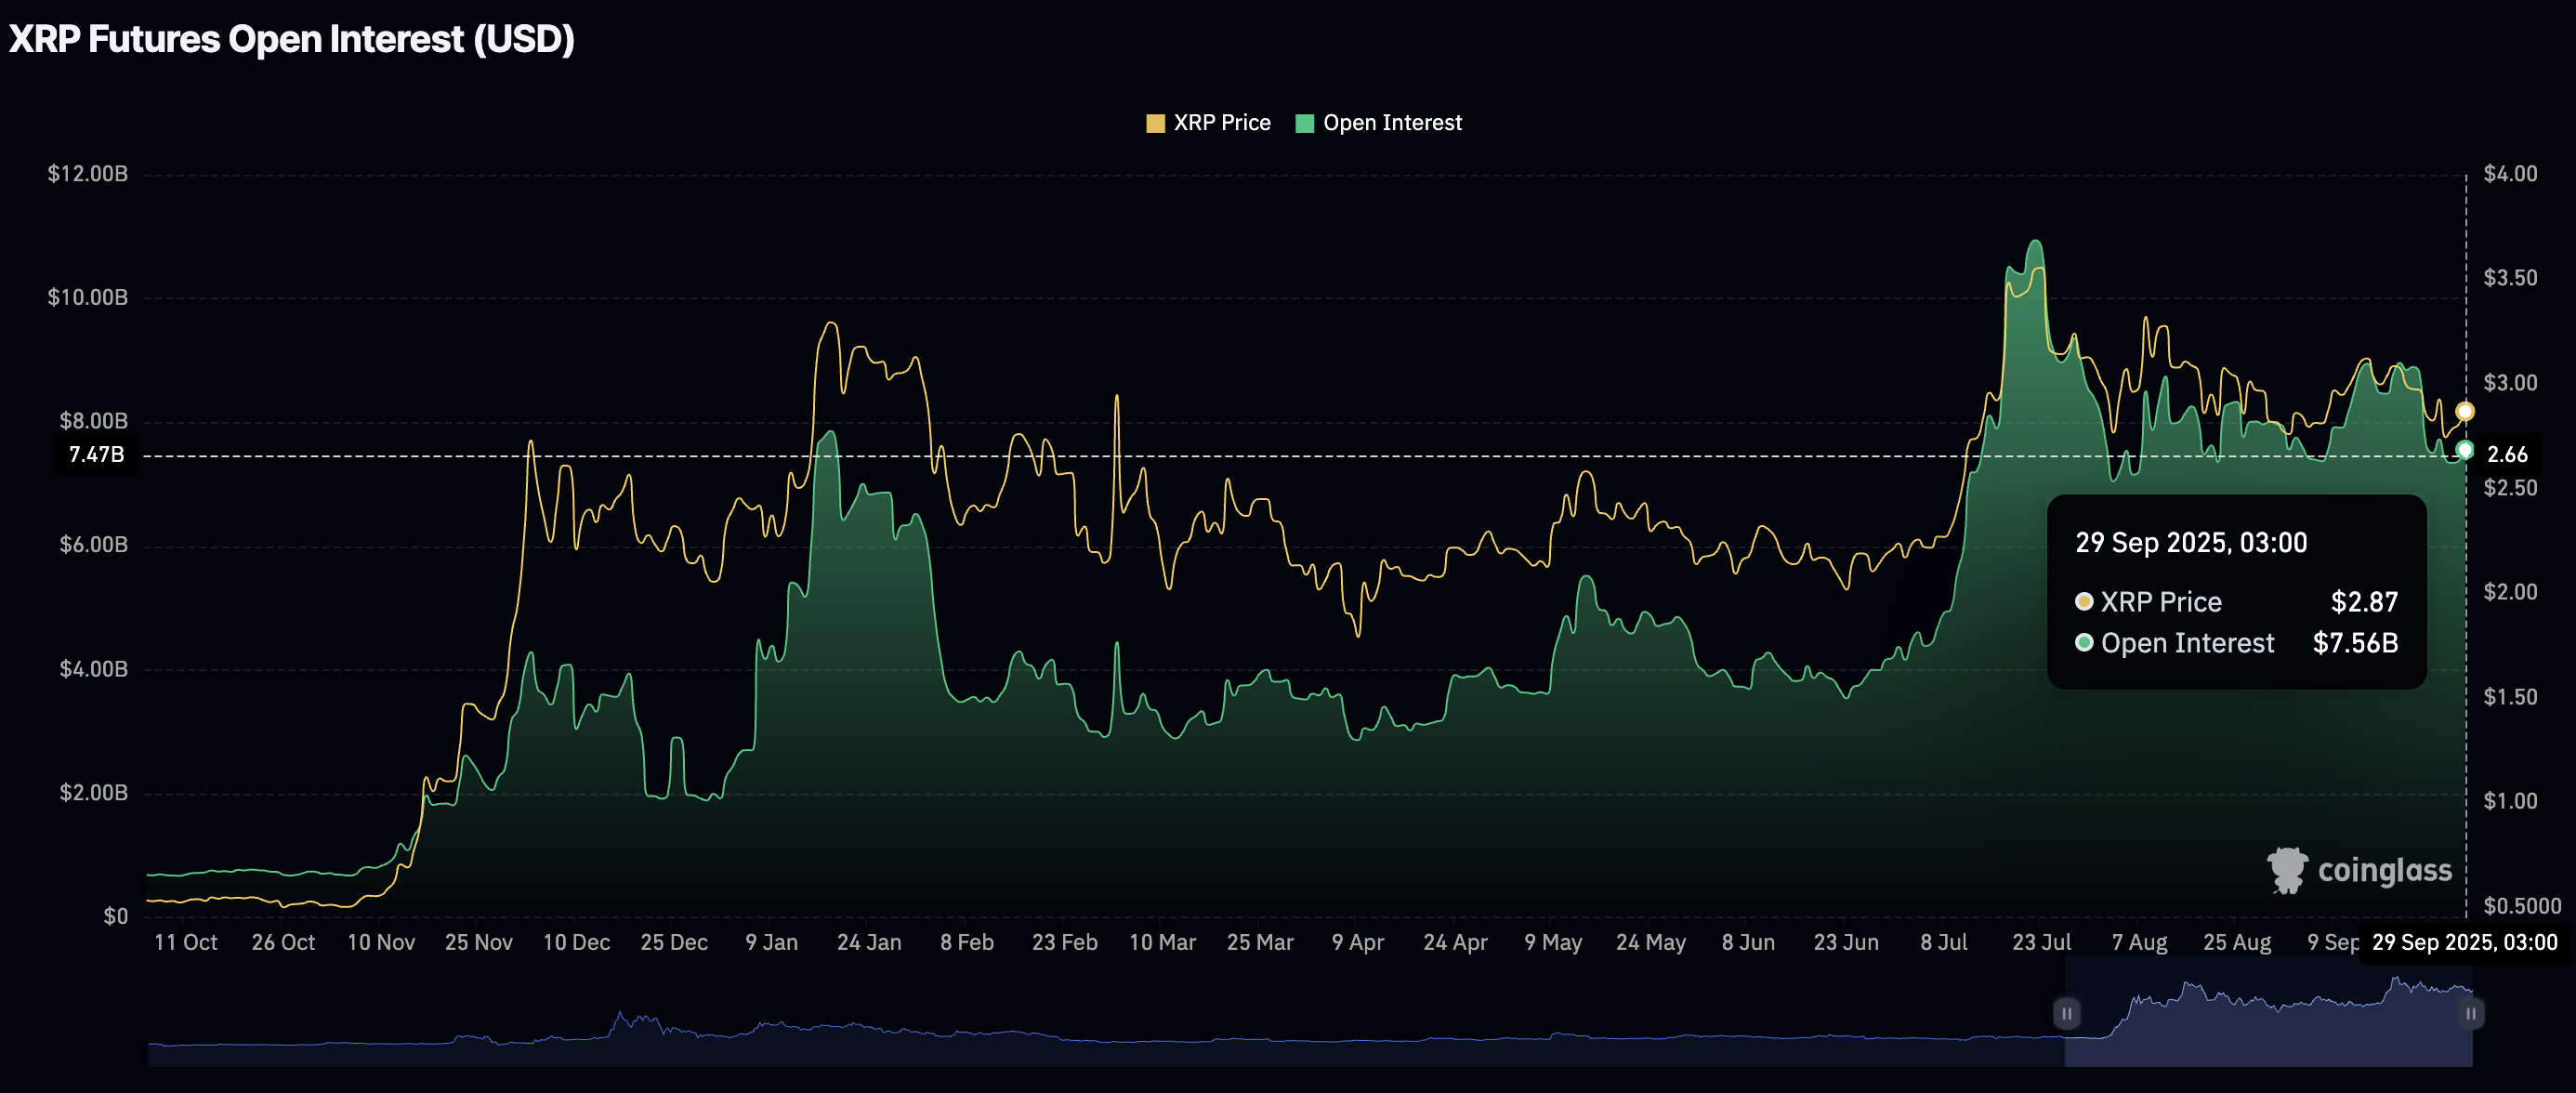
XRP Futures Open Interest | Source: CoinGlass
Technical outlook: XRP bulls eye $3.00 breakout
XRP fluctuates between support provided by the 100-day Exponential Moving Average (EMA) at $2.83 and the 50-day EMA resistance at $2.92. Bulls appear intent on extending the weekend recovery above the $3.00 critical level and later break above a descending trendline in place since the record high of $3.66.
Based on the Relative Strength Index (RSI), which has risen to 48, bullish momentum is building. If the RSI breaks into the bullish region above the midline, the path of least resistance could remain upward, supported by a strong tailwind as more traders are encouraged to seek exposure.
Traders will look out for a buy signal from the Moving Average Convergence Divergence (MACD) indicator before increasing or seeking exposure to the cross-border money remittance token. Such a signal manifests when the blue line crosses above the red signal line, encouraging traders to position themselves ahead of the next leg up.
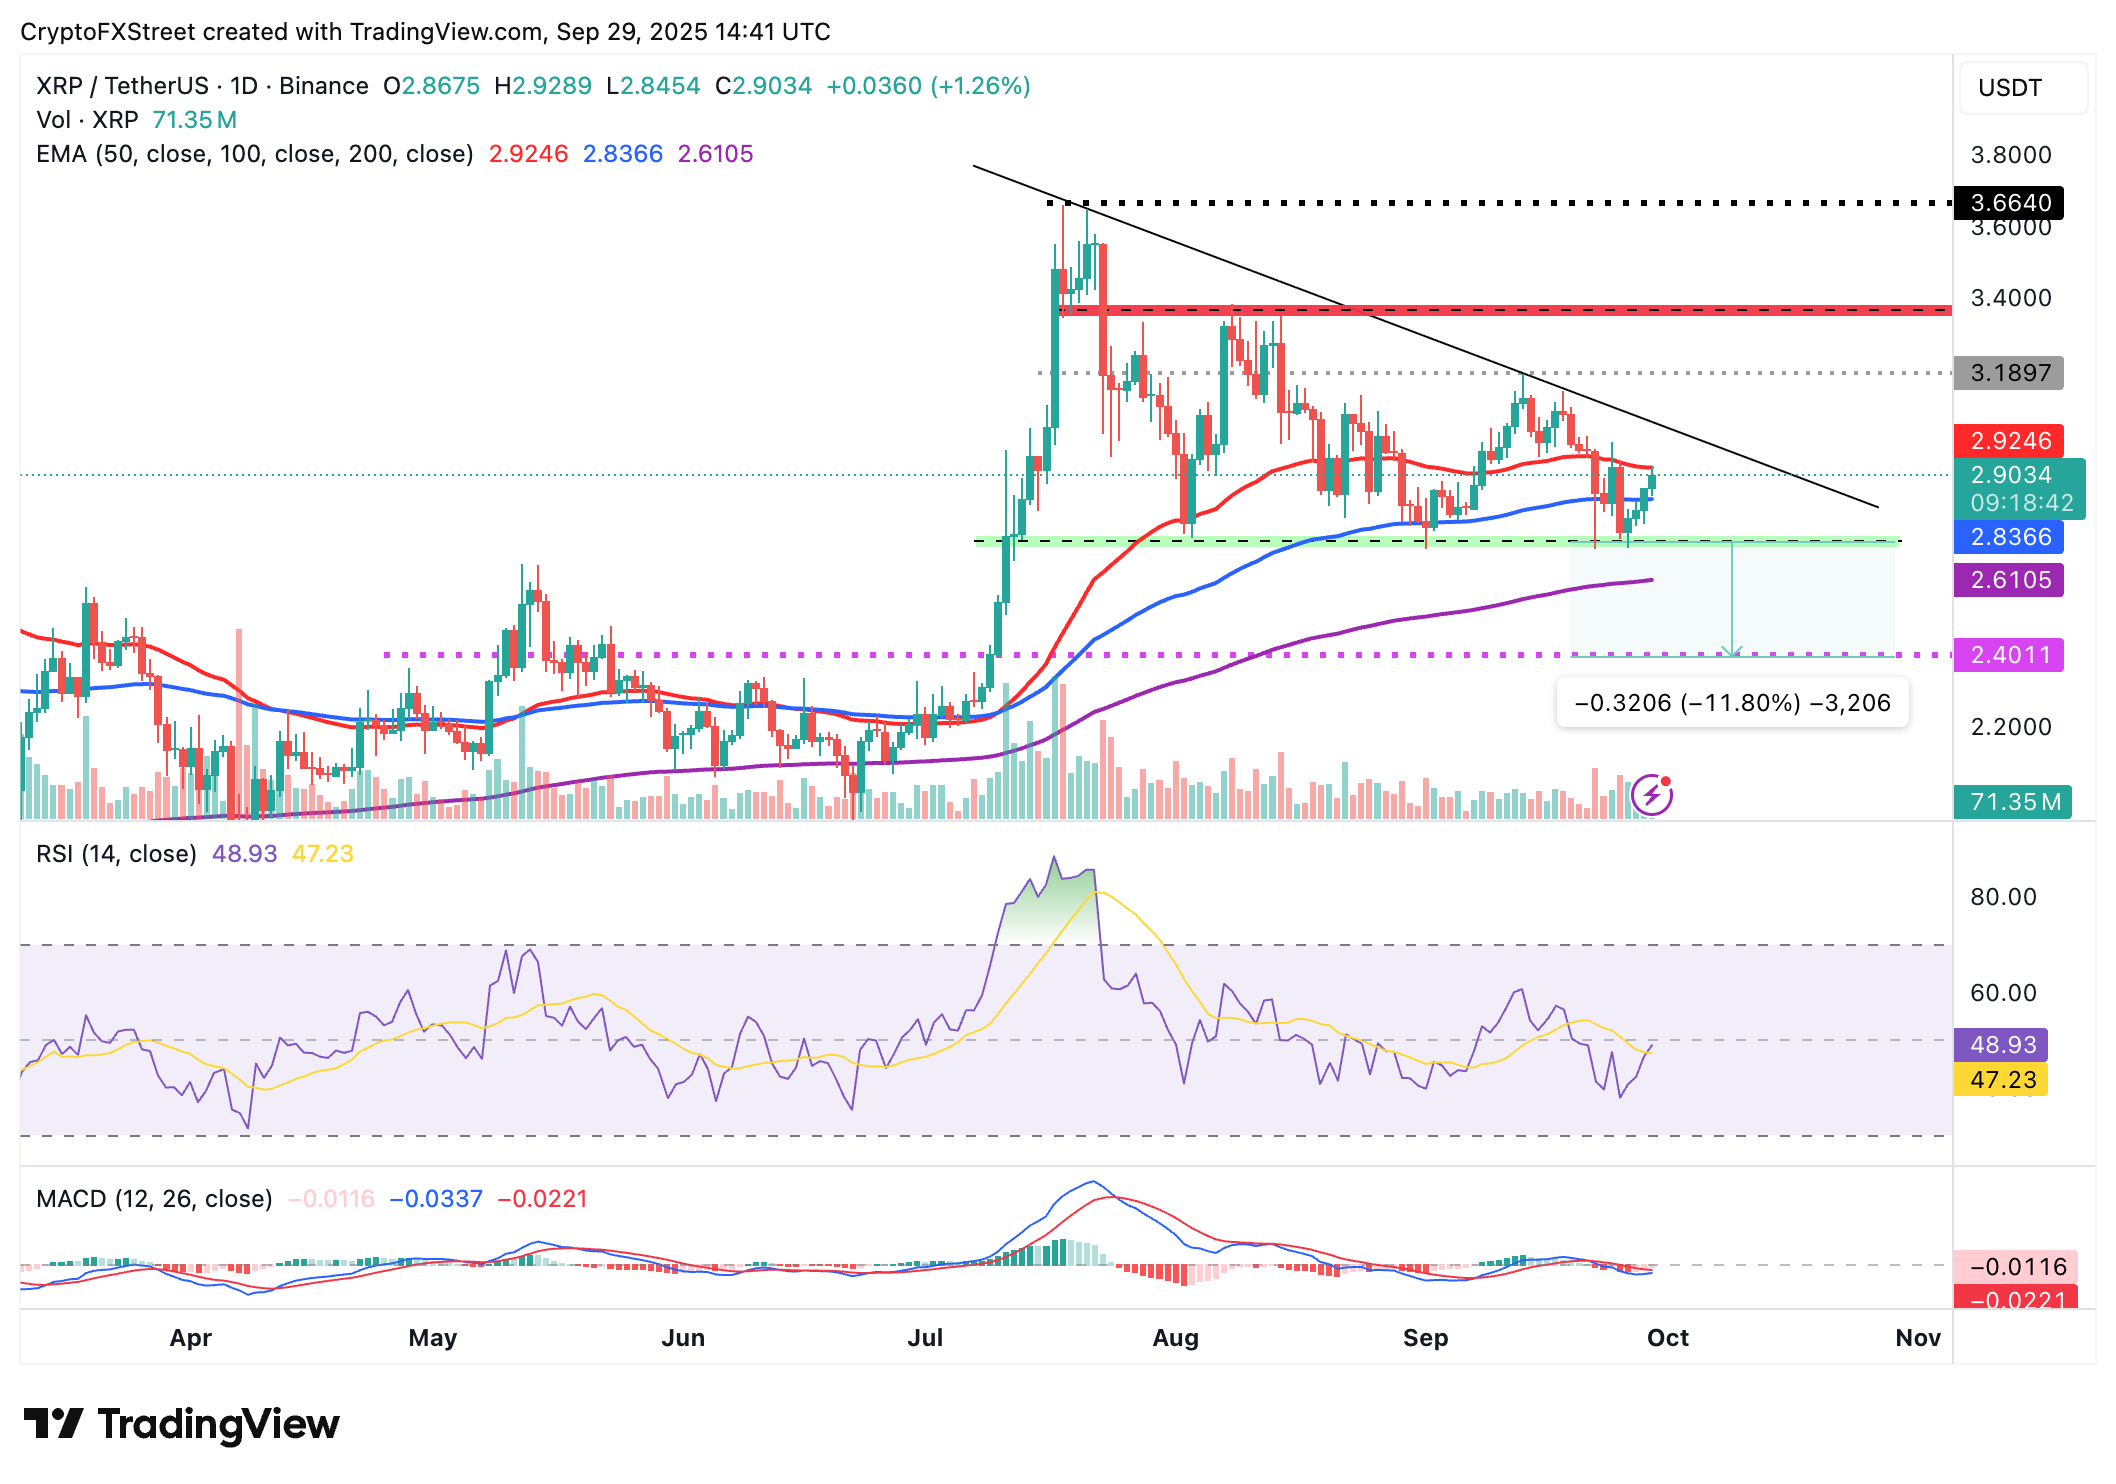
XRP/USDT daily chart
Key milestones would include a sustained break above the short-term 50-day EMA at $2.92, followed by gains above the descending trendline and the supply zone at $3.18. On the other hand, losing the 100-day EMA support at $2.83 could encourage risk-on sentiment, increasing the probability of XRP resuming the downtrend toward the near-term support at $2.70 and the 200-day EMA at $2.61.
Cryptocurrency metrics FAQs
The developer or creator of each cryptocurrency decides on the total number of tokens that can be minted or issued. Only a certain number of these assets can be minted by mining, staking or other mechanisms. This is defined by the algorithm of the underlying blockchain technology. On the other hand, circulating supply can also be decreased via actions such as burning tokens, or mistakenly sending assets to addresses of other incompatible blockchains.
Market capitalization is the result of multiplying the circulating supply of a certain asset by the asset’s current market value.
Trading volume refers to the total number of tokens for a specific asset that has been transacted or exchanged between buyers and sellers within set trading hours, for example, 24 hours. It is used to gauge market sentiment, this metric combines all volumes on centralized exchanges and decentralized exchanges. Increasing trading volume often denotes the demand for a certain asset as more people are buying and selling the cryptocurrency.
Funding rates are a concept designed to encourage traders to take positions and ensure perpetual contract prices match spot markets. It defines a mechanism by exchanges to ensure that future prices and index prices periodic payments regularly converge. When the funding rate is positive, the price of the perpetual contract is higher than the mark price. This means traders who are bullish and have opened long positions pay traders who are in short positions. On the other hand, a negative funding rate means perpetual prices are below the mark price, and hence traders with short positions pay traders who have opened long positions.
Author

John Isige
FXStreet
John Isige is a seasoned cryptocurrency journalist and markets analyst committed to delivering high-quality, actionable insights tailored to traders, investors, and crypto enthusiasts. He enjoys deep dives into emerging Web3 tren


