|

Ripple Price Analysis: XRP/USD struggles to build on Friday's recovery gains

  • Ripple trades with modest losses near $0.18 on Saturday.
  • XRP/USD remains on track to close third straight week in the negative territory.

After finding resistance near $0.19, Ripple (XRP/USD) posted losses for three straight days but staged a modest recovery on Friday. However, the pair seems to be struggling to extend its rebound on Saturday and was last seen losing 0.47% on the day at $0.1818.

On a weekly basis, Ripple is down more than 2% and remains on track to close in the negative territory for the third straight week.
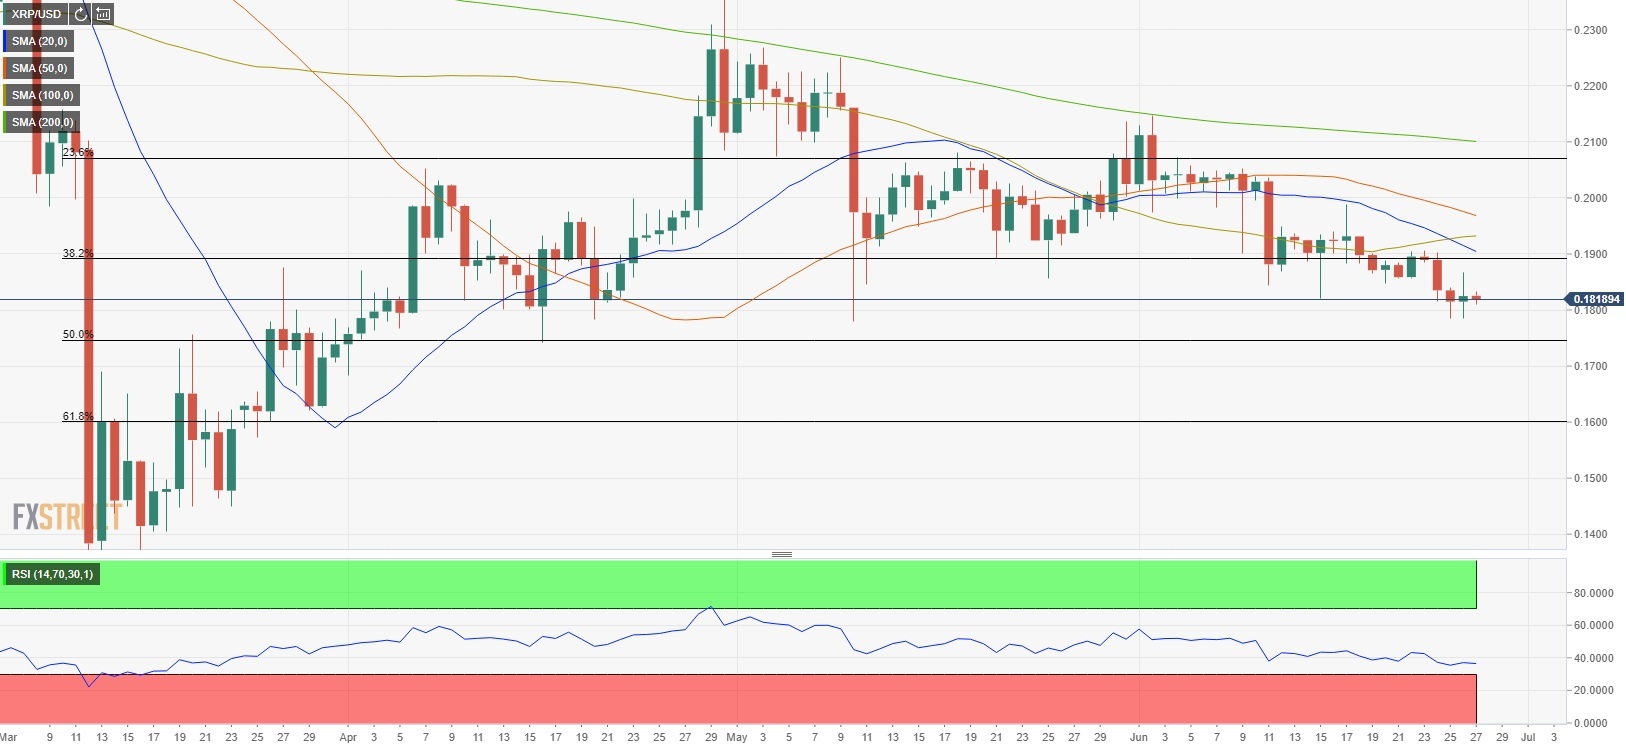
Technical outlook

On the daily chart, the Relative Strength Index (RSI) indicator continues to inch lower below 40, suggesting that the bearish pressure is likely to remain intact in the near-term. Additionally,  the 20-day SMA made a bearish cross with the 100-day SMA, confirming the negative outlook.

On the downside, the initial support aligns at $0.1750 (Fibonacci 50% retracement of the uptrend that started around mid-March). With a daily close below that level, Ripple could extend its slide toward the next Fibonacci support at $0.16.

Resistances, on the other hand, could be seen at $0.19 (Fibonacci 38.2% retracement/20-day SMA) ahead of $0.20 (psychological level) and $0.2070 (Fibonacci 23.6% retracement).

XRP/USD daily chart

Author

Eren Sengezer

As an economist at heart, Eren Sengezer specializes in the assessment of the short-term and long-term impacts of macroeconomic data, central bank policies and political developments on financial assets.

More from Eren Sengezer
Share:

Editor's Picks

Ripple technical weakness persists as selling intensifies toward $1.00

Ripple grinds lower, trading around $1.10 at the time of writing on Wednesday. The sticky bearish outlook mirrors the broader crypto market, with major coins such as Bitcoin and Ethereum facing weak demand as investors de-risk.

Crypto Today: Bitcoin, Ethereum, XRP face downside pressure amid investor de-risking

Major crypto assets trade under intense headwinds on Wednesday, as market participants navigate complex geopolitical and macroeconomic environments. Bitcoin has slipped toward $61,000 after its recent rebound was sold near $64,000, leaving buyers exhausted.

Bitcoin Price Forecast: Sticky inflation fears threaten deeper sell-off in BTC

Bitcoin extends its decline on Wednesday, trading below $61,500 at the time of writing as renewed US-Iran tensions keep the risk sentiment capped. In addition, persistent capital outflows from US-listed spot Exchange Traded Funds continue to fuel selling pressure on BTC.

Pi Network extends decline as CEX outflows fail to offset bearish pressure

Pi Network edges lower on Wednesday, extending its third consecutive day of losses. The technical outlook for PI is largely bearish, with a risk of a steeper correction below $0.1184.

Bitcoin: After the bloodbath, everyone looks at $60,000
Bitcoin (BTC) hovers above $62,000 at the time of writing on Friday, weighed down by growing risk-off sentiment due to persistent geopolitical tensions in the Middle East and sticky macroeconomic uncertainty. The institutional sell-off continued to wreak havoc on capital flows, with spot Bitcoin Exchange-Traded Funds (ETFs) recording billions in outflows.