|

Ripple price analysis: XRP/USD is stable for now; bleak days lie ahead

  • Both the 50 SMA and the 100 SMA are limiting upward movements at $0.3189 and $0.3298 respectively.
  • The current consolidation is likely to culminate in further declines.

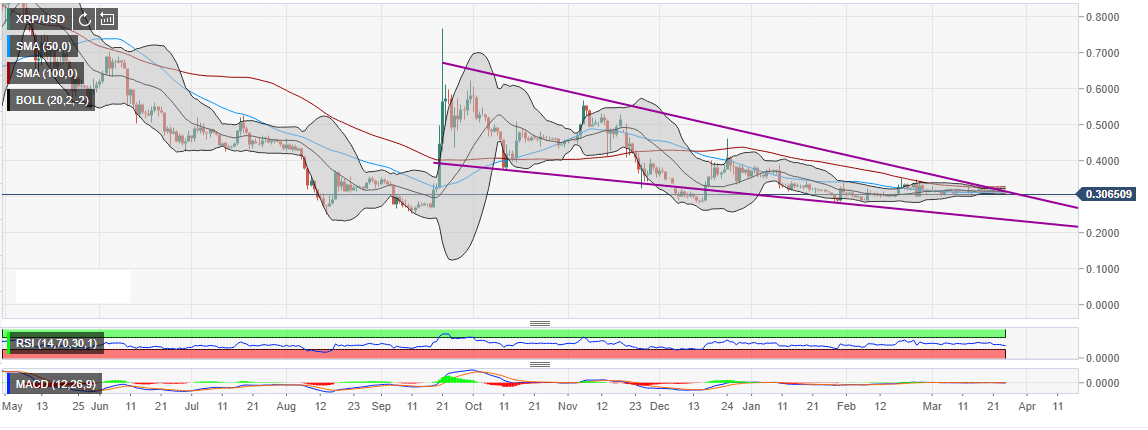
XRP/USD daily chart shows a cryptocurrency that is struggling to escape the long-term bear pressure. The price is battling with the resistance from the six-months-long falling wedge pattern. Besides, both the 50 SMA and the 100 SMA are limiting upward movements at $0.3189 and $0.3298 respectively.

The technical levels for this pair are getting bearish with each coming day. Take the RSI, for instance, is on a downward trend at 41.37. Moreover, the indicator has not been able to pass the 65 mark since January 2019. The MACD, on the same chart, has been flirting with the mean line (0.0) unable to make any significant movements into the positive territory. In addition to that, the 50 SMA is under the longer term 100 SMA to show that the bears are still in control.

The current consolidation is likely to culminate in further declines according to the trend shown by the Bollinger Band daily. However, if the bull can manage to push the price above the falling wedge pattern resistance, we could see a reversal towards $0.5. Meanwhile, initial support is $0.30 while the next support target is $0.28.

XRP/USD daily chart


Get 24/7 Crypto updates in our social media channels: Give us a follow at @FXSCrypto and our FXStreet Crypto Trading Telegram channel

Author

John Isige

John Isige

FXStreet

John Isige is a seasoned cryptocurrency journalist and markets analyst committed to delivering high-quality, actionable insights tailored to traders, investors, and crypto enthusiasts. He enjoys deep dives into emerging Web3 tren

More from John Isige
Share:

Editor's Picks

Crypto Today: Bitcoin, Ethereum, XRP trade under sustained selling pressure despite mild ETF inflows

Cryptocurrency prices remain under pressure as a risk-off mood persists on Friday, with Bitcoin consolidating its losses above $62,000. Altcoins, including Ethereum and Ripple, are extending their weakness, trading near lower support levels around $1,600 and $1.12, respectively.

Bitcoin Weekly Forecast: After the bloodbath, everyone looks at $60,000

Bitcoin (BTC) hovers above $62,000 at the time of writing on Friday, weighed down by growing risk-off sentiment due to persistent geopolitical tensions in the Middle East and sticky macroeconomic uncertainty.

Cardano hits five-year low even as Hoskinson clarifies "break" isn't an exit

Cardano price is down 10% at press time on Friday, extending losses over 30% so far this week amid Charles Hoskinson's clarification that "break" isn't an exit. A reactionary spike in on-chain activity and social chatter, reflecting a strength of community, but fails to absorb the price decline.

Arthur Hayes' “Holy Trinity” is dead: Exits Zcash after Orchard Pool exploit

Arthur Hayes dumped his entire Zcash holdings on Friday, a day after selling his HYPE and NEAR holdings. Zcash is down 13% so far on Friday, extending the 26% drop from the previous day.

Bitcoin: After the bloodbath, everyone looks at $60,000
Bitcoin (BTC) hovers above $62,000 at the time of writing on Friday, weighed down by growing risk-off sentiment due to persistent geopolitical tensions in the Middle East and sticky macroeconomic uncertainty. The institutional sell-off continued to wreak havoc on capital flows, with spot Bitcoin Exchange-Traded Funds (ETFs) recording billions in outflows.