Ripple Price Analysis: XRP/USD bears step in this Thursday to correct an overpriced market
- XRP/USD went up from $0.2395 to $0.278 over the last five days.
- The RSI indicator is looking to drop down from the overbought zone.

XRP/USD daily chart
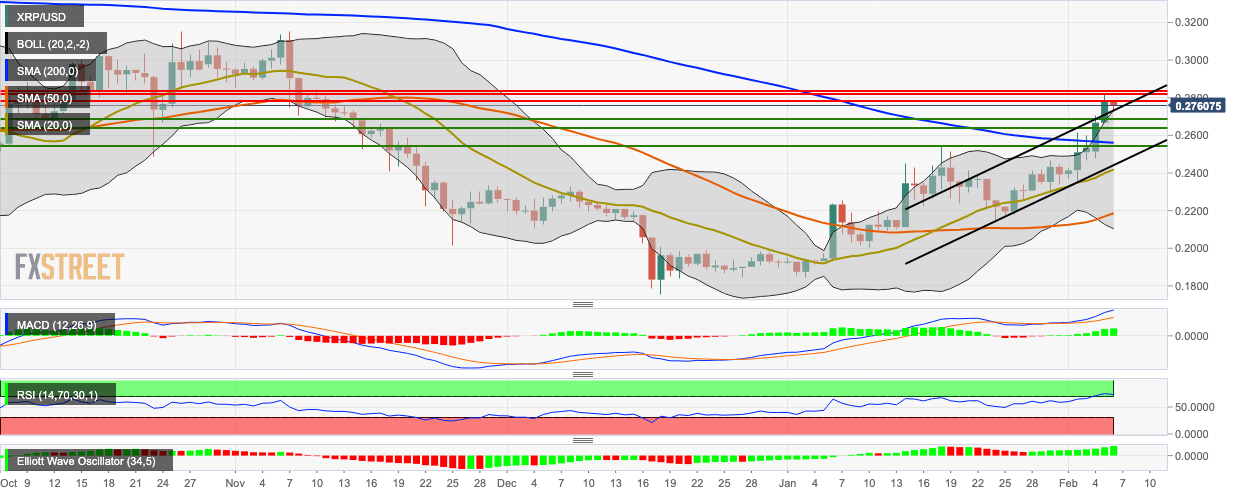
XRP/USD dropped from $0.278 to $0.276 in the early hours of Thursday. Before this, the bulls had full control for five straight days, during which XRP/USD flew up from $0.2395 to $0.278. During this upward movement, XRP/USD climbed above the 20-day Bollinger band and the RSI indicator crossed above 70 - both of which indicate that the asset is currently overpriced. The 20-day Bollinger has widened considerably, indicating that the market volatility has increased and XRP/USD is sitting on top of the upper jaw. The MACD indicator and the Elliott Oscillator both show sustained bullish sentiment. The RSI indicator has dipped down and is looking to leave the overbought zone.
Author

Rajarshi Mitra
Independent Analyst
Rajarshi entered the blockchain space in 2016. He is a blockchain researcher who has worked for Blockgeeks and has done research work for several ICOs. He gets regularly invited to give talks on the blockchain technology and cryptocurrencies.


