• Ripple corrects from three-week lows, in sync with major Cryptocurrencies.
  • 0.3090/95 is the level to beat for the XRP bulls.

Ripple (XRP/USD) consolidates the overnight bounce from three-week lows of 0.2897 so far this Saturday, as the weekend love for the cryptocurrencies appears to have returned. The third-most traded cryptocurrency pauses its four straight days of losses and regains the 0.30 handle, but the bulls appear to take a breather before the next push higher. Despite the latest declines, the coin trades with a market capitalization of about $ 12.93 billion, down nearly 1.80% over the last 24 hours.

Technical perspective

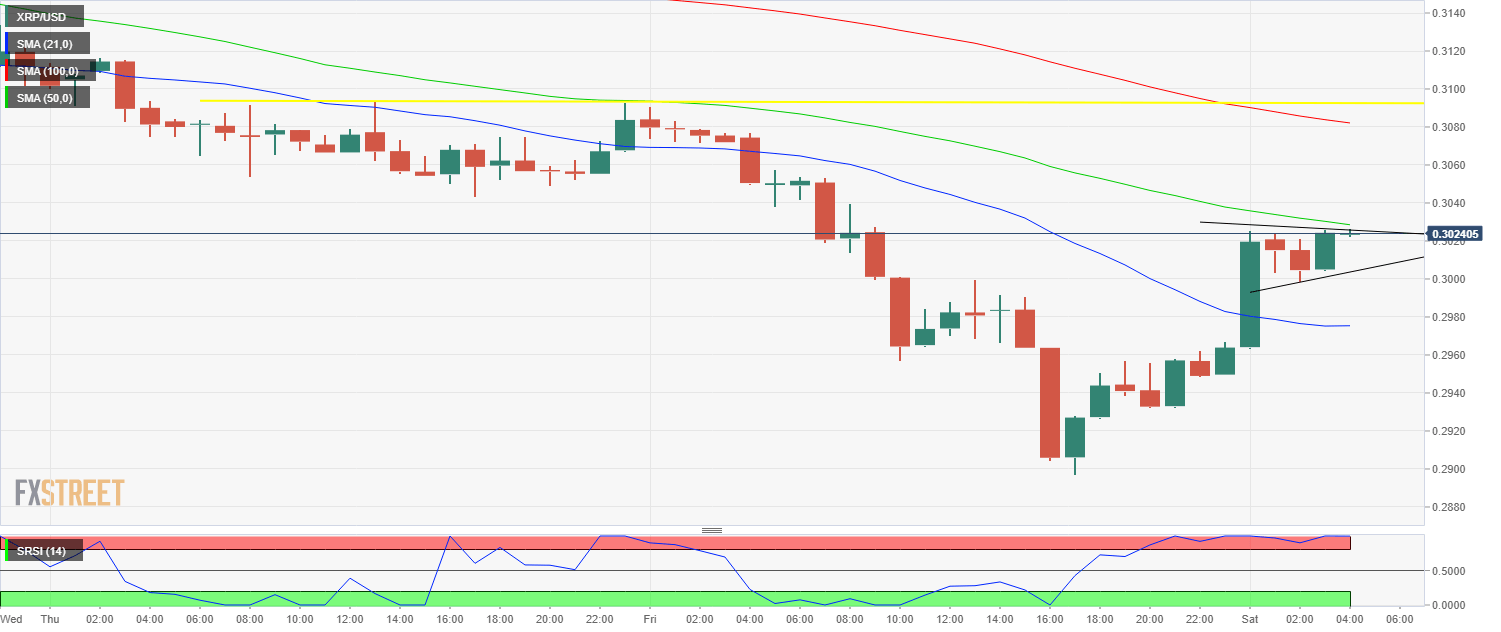
A bullish pennant formation is spotted on the hourly sticks, pointing towards a continuation of the latest recovery in XRP/USD. The price is seen testing the 0.3028 level, the confluence of the descending trend line resistance and downward sloping 50-Hour Simple Moving Average (HMA). A sustained break above the last would validate the bullish pennant pattern, opening doors for a test of the next resistance aligned at 0.3082, the downward sloping 100-HMA. On the upside, only an hourly close above the horizontal resistance placed around 0.3090/95 levels will negate the dead cat bounce sentiment. The bulls will likely take back complete control above the last, calling for a sustained recovery from multi-week lows.

On the flip side, strong support is located at the key 0.3000 level, where the ascending trendline appears. A breach of the round number will see the sellers scrambling for the next support aligned at the horizontal 21-HMA at 0.2975. Selling pressure is likely to intensify if the buyers fail to defend the last, with downside opening towards the three-week troughs near the 0.29 handle.

It's worth noting that the hourly Relative Strength Index (RSI) is highly overbought, suggesting that the pull of gravity is likely to be stronger in the session ahead.

XRP/USD 1-hour chart

XRP/USD Levels to watch

XRP/USD

Overview
Today last price 0.3021
Today Daily Change 0.0059
Today Daily Change % 1.99
Today daily open 0.2964
 
Trends
Daily SMA20 0.3146
Daily SMA50 0.357
Daily SMA100 0.3721
Daily SMA200 0.3445
Levels
Previous Daily High 0.3091
Previous Daily Low 0.2897
Previous Weekly High 0.3308
Previous Weekly Low 0.2897
Previous Monthly High 0.4196
Previous Monthly Low 0.2835
Daily Fibonacci 38.2% 0.2971
Daily Fibonacci 61.8% 0.3017
Daily Pivot Point S1 0.2877
Daily Pivot Point S2 0.279
Daily Pivot Point S3 0.2683
Daily Pivot Point R1 0.3071
Daily Pivot Point R2 0.3178
Daily Pivot Point R3 0.3265


Information on these pages contains forward-looking statements that involve risks and uncertainties. Markets and instruments profiled on this page are for informational purposes only and should not in any way come across as a recommendation to buy or sell in these assets. You should do your own thorough research before making any investment decisions. FXStreet does not in any way guarantee that this information is free from mistakes, errors, or material misstatements. It also does not guarantee that this information is of a timely nature. Investing in Open Markets involves a great deal of risk, including the loss of all or a portion of your investment, as well as emotional distress. All risks, losses and costs associated with investing, including total loss of principal, are your responsibility. The views and opinions expressed in this article are those of the authors and do not necessarily reflect the official policy or position of FXStreet nor its advertisers. The author will not be held responsible for information that is found at the end of links posted on this page.

If not otherwise explicitly mentioned in the body of the article, at the time of writing, the author has no position in any stock mentioned in this article and no business relationship with any company mentioned. The author has not received compensation for writing this article, other than from FXStreet.

FXStreet and the author do not provide personalized recommendations. The author makes no representations as to the accuracy, completeness, or suitability of this information. FXStreet and the author will not be liable for any errors, omissions or any losses, injuries or damages arising from this information and its display or use. Errors and omissions excepted.

The author and FXStreet are not registered investment advisors and nothing in this article is intended to be investment advice.

Join Telegram

Recommended content


Recommended Content

Editors’ Picks

Ripple wipes out weekly gains, experts comment on role of Ripple stablecoin

Ripple wipes out weekly gains, experts comment on role of Ripple stablecoin

Ripple declined to $0.52 on Thursday, erasing all gains registered earlier this week. Ripple SVP Eric van Miltenburg’s comments on the firm’s stablecoin, and how it is expected to benefit the XRP Ledger and native token XRP have raised concerns among crypto experts. 

More Ripple News

Hedera HBAR slips nearly 10% after air is cleared on mistaken link with giant BlackRock

Hedera HBAR slips nearly 10% after air is cleared on mistaken link with giant BlackRock

HBAR price is down nearly 10% on Thursday, partly erasing gains inspired by the misinterpreted link with BlackRock. Despite the recent correction, Hedera’s price is up 44% in the past seven days.

More Hedera News

The reason behind Bonk’s 105% rise and if you should buy now Premium

The reason behind Bonk’s 105% rise and if you should buy now

Bonk price has shot up 105% in the past five weeks. A retracement into $0.0000216 or the $0.0000152 to $0.0000186 imbalance would be a good buying opportunity. Patient investors can expect double-digit gains from BONK that could extend up to 70%.

More Cryptocurrencies News

Injective price weakness persists despite over 5.9 million INJ tokens burned

Injective price weakness persists despite over 5.9 million INJ tokens burned

Injective price is trading with a bearish bias, stuck in the lower section of the market range. The bearish outlook abounds despite the network's deflationary efforts to pump the price. Coupled with broader market gloom, INJ token’s doomed days may not be over yet.

More Injective News

Bitcoin: BTC post-halving rally could be partially priced in Premium

Bitcoin: BTC post-halving rally could be partially priced in

Bitcoin (BTC) price briefly slipped below the $60,000 level for the last three days, attracting buyers in this area as the fourth BTC halving is due in a few hours. Is the halving priced in for Bitcoin? Or will the pioneer crypto note more gains in the coming days? 

Read full analysis

BTC

ETH

XRP