Ripple Elliott Wave technical analysis [Video]
![Ripple Elliott Wave technical analysis [Video]](https://editorial.fxstreet.com/images/Markets/Currencies/Cryptocurrencies/Coins/Ripple/Ripple_Watch_XtraLarge.jpg)
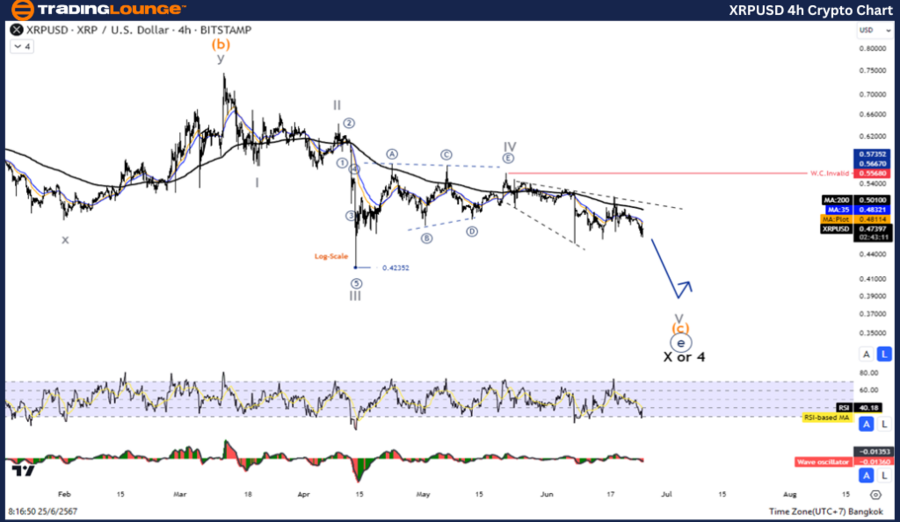
XRP/USD Elliott Wave technical analysis
Function: Counter trend.
Mode: Corrective.
Structure: Triangle.
Position: Wave E
Direction next higher degrees: Wave 4 of impulse.
Details: Movement within the triangle pattern before the price declines again in wave 5.
XRP/USD trading strategy
Decreasing wave ((E)), which is the last wave in the triangle pattern before prices re-enter the uptrend. So wait for the correction to complete to join the trend again.
XRPUSD technical indicators
The price is below the MA200 indicating a downtrend, the wave oscillator is a bearish momentum.
.thumb-638548840069226942.png.de4941c84e5db2892673bc2c7209829d-638548840069226942.png)
XRP/USD Elliott Wave technical analysis
Function: Counter trend.
Mode: Corrective.
Structure: Triangle.
Position: Wave E
Direction next higher degrees: Wave 4 of impulse.
Wave cancel invalid level: 0.486.
Details: Movement within the triangle pattern before the price declines again in wave 5.
XRP/USD trading strategy
Decreasing wave ((E)), which is the last wave in the Triangle pattern before prices re-enter the uptrend. So wait for the correction to complete to join the trend again.
XRPUSD technical indicators
The price is below the MA200 indicating a downtrend, the wave oscillator is a bearish momentum.
XRP/USD Elliott Wave technical analysis [Video]
Author

Peter Mathers
TradingLounge
Peter Mathers started actively trading in 1982. He began his career at Hoei and Shoin, a Japanese futures trading company.


