Quant Price Prediction: Award-winning payment platform eyes bullish reversal
- Quant edges higher by 1% so far on Monday, after winning the Best Programmable Payment Platform at the Future of Finance Awards.
- The optimism surrounding Quant grows in the derivatives market, evident with the QNT Open Interest spike.
- The technical outlook suggests a bullish reversal possibility, with a potential morning star pattern forming.

Quant (QNT) trades in the green by 1% at press time on Monday, indicating a potential bullish reversal pattern formation. Quant winning the Best Programmable Payment Platform at the Future of Finance Awards catalyzes a spike in QNT Open Interest (OI) and surrounding optimism. The technical outlook points to a possible reversal brewing in QNT with the potential to reclaim the $100 psychological mark.
Quant’s optimism shoots up
Quant blockchain won the award for Best Programmable Payment Platform at the Future of Finance Awards last week. The awards come a couple of weeks after Quant announced its role in helping the ECB develop secure, trusted, and private digital Euro payments.
Coupled with the intraday crypto market recovery, the announcement boosts sentiment surrounding Quant. It is evident from the QNT Open Interest (OI), which has risen by 3% to reach $15.44 million. Typically, such a spike in Open Interest is related to increased buying activity, leading to greater inflows in the derivatives market.
Further up, the short-term traders’ activity reflects a decline in bearish trading activity as the OI-weighted funding rate bounces to -0.0019% from an intraday low of -0.0195%. A negative plunge in the funding rate translates to a premium paid by bears to bullish-aligned traders to maintain alignment between the spot and swap prices.
Sharing the inclination, the liquidation data points to long liquidations worth $67k in the last 24 hours, while short liquidations are worth $11k. This aligns with the spot price fall due to the United States' strikes on Iran news over the weekend, wiping out bullish-aligned positions.
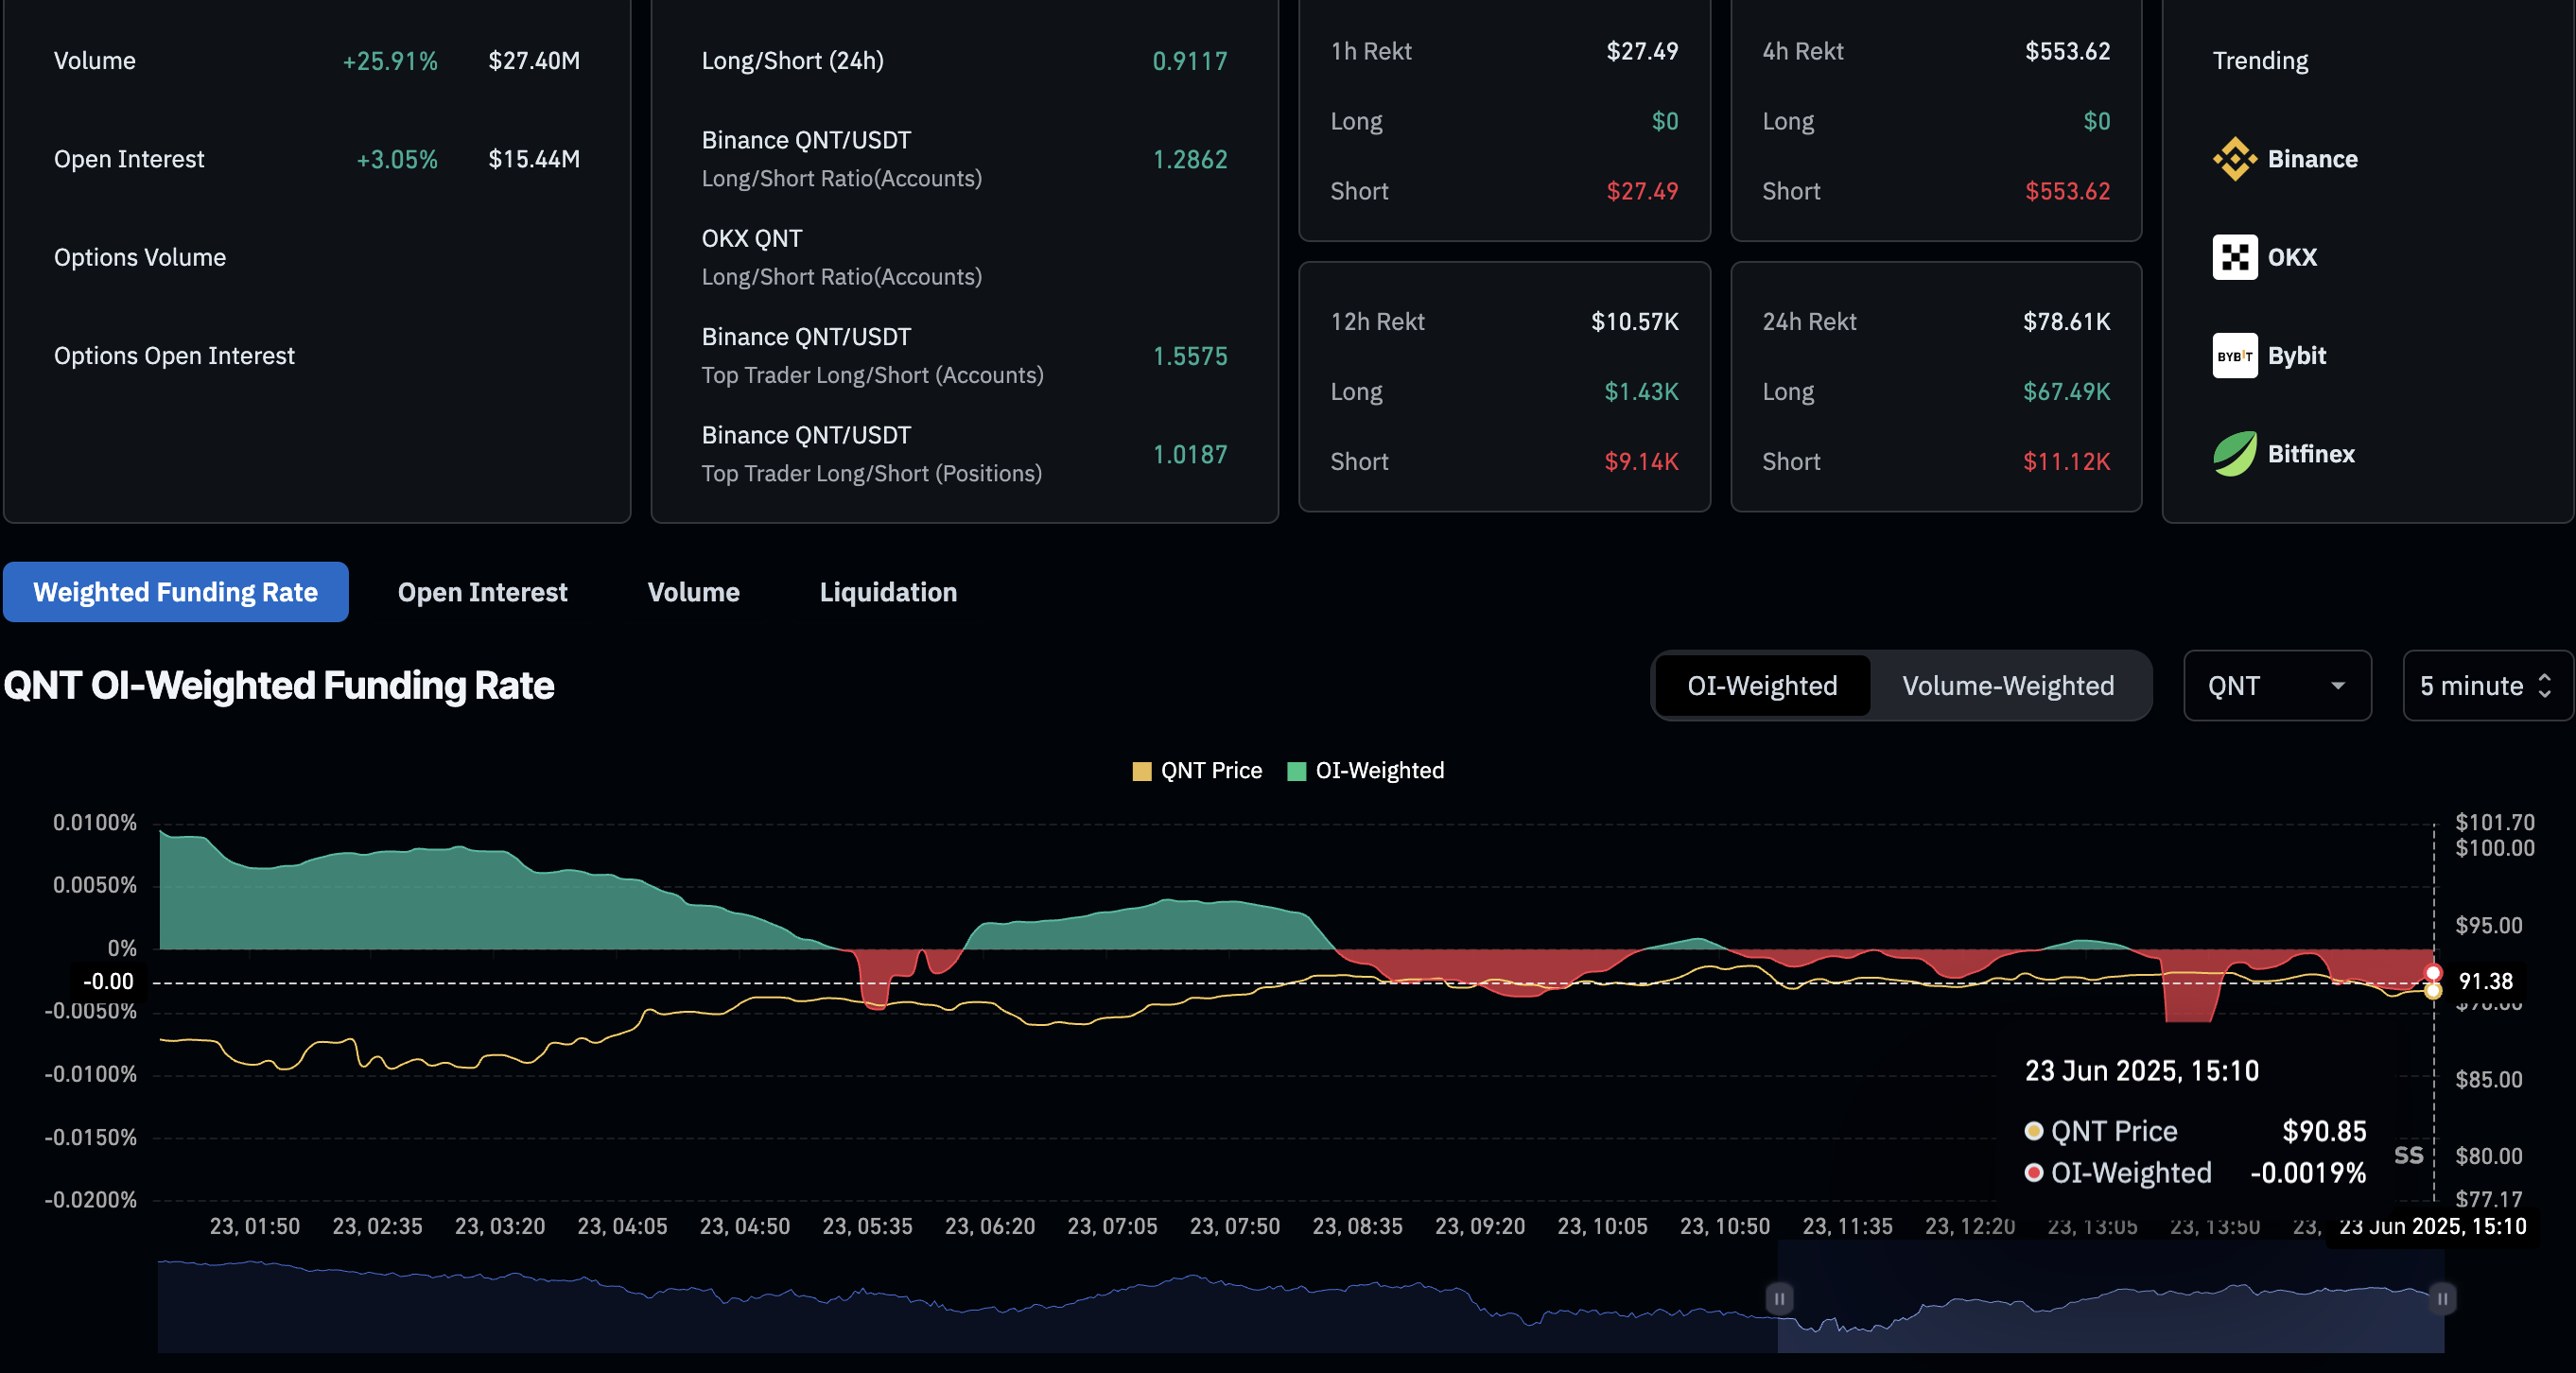
Quant derivatives. Source: Coinglass
Quant prepares for a trend reversal
Quant maintains a declining trend so far in June, accounting for two consecutive bearish weeks, resulting in a 26% plunge. At the time of writing, QNT trades below the 200-day Exponential Moving Average (EMA) at $92.20.
With an intraday gain of over 1% so far on Monday, QNT forms the first bullish candle in five days. Coupled with a bearish Doji on Sunday, the price action hints at a morning star pattern formation, a trend reversal pattern generally seen after a downtrend.
A positive closing in QNT will complete the morning star, indicating bullish chances to reach the $100 psychological level, aligned with a demand-turned-supply zone.
Shifting to momentum indicators, a bearish momentum persists. The Moving Average Convergence/Divergence (MACD) indicator falls with its signal line below the zero line on the daily chart. With red histogram bars rising from the zero line, the indicator flashes a sell signal.
Still, the Relative Strength Index (RSI) at 35 notes a minor uptick as bullish momentum returns slightly before reaching the oversold conditions. This aligns with the trend reversal pattern and an easing in bearish momentum.
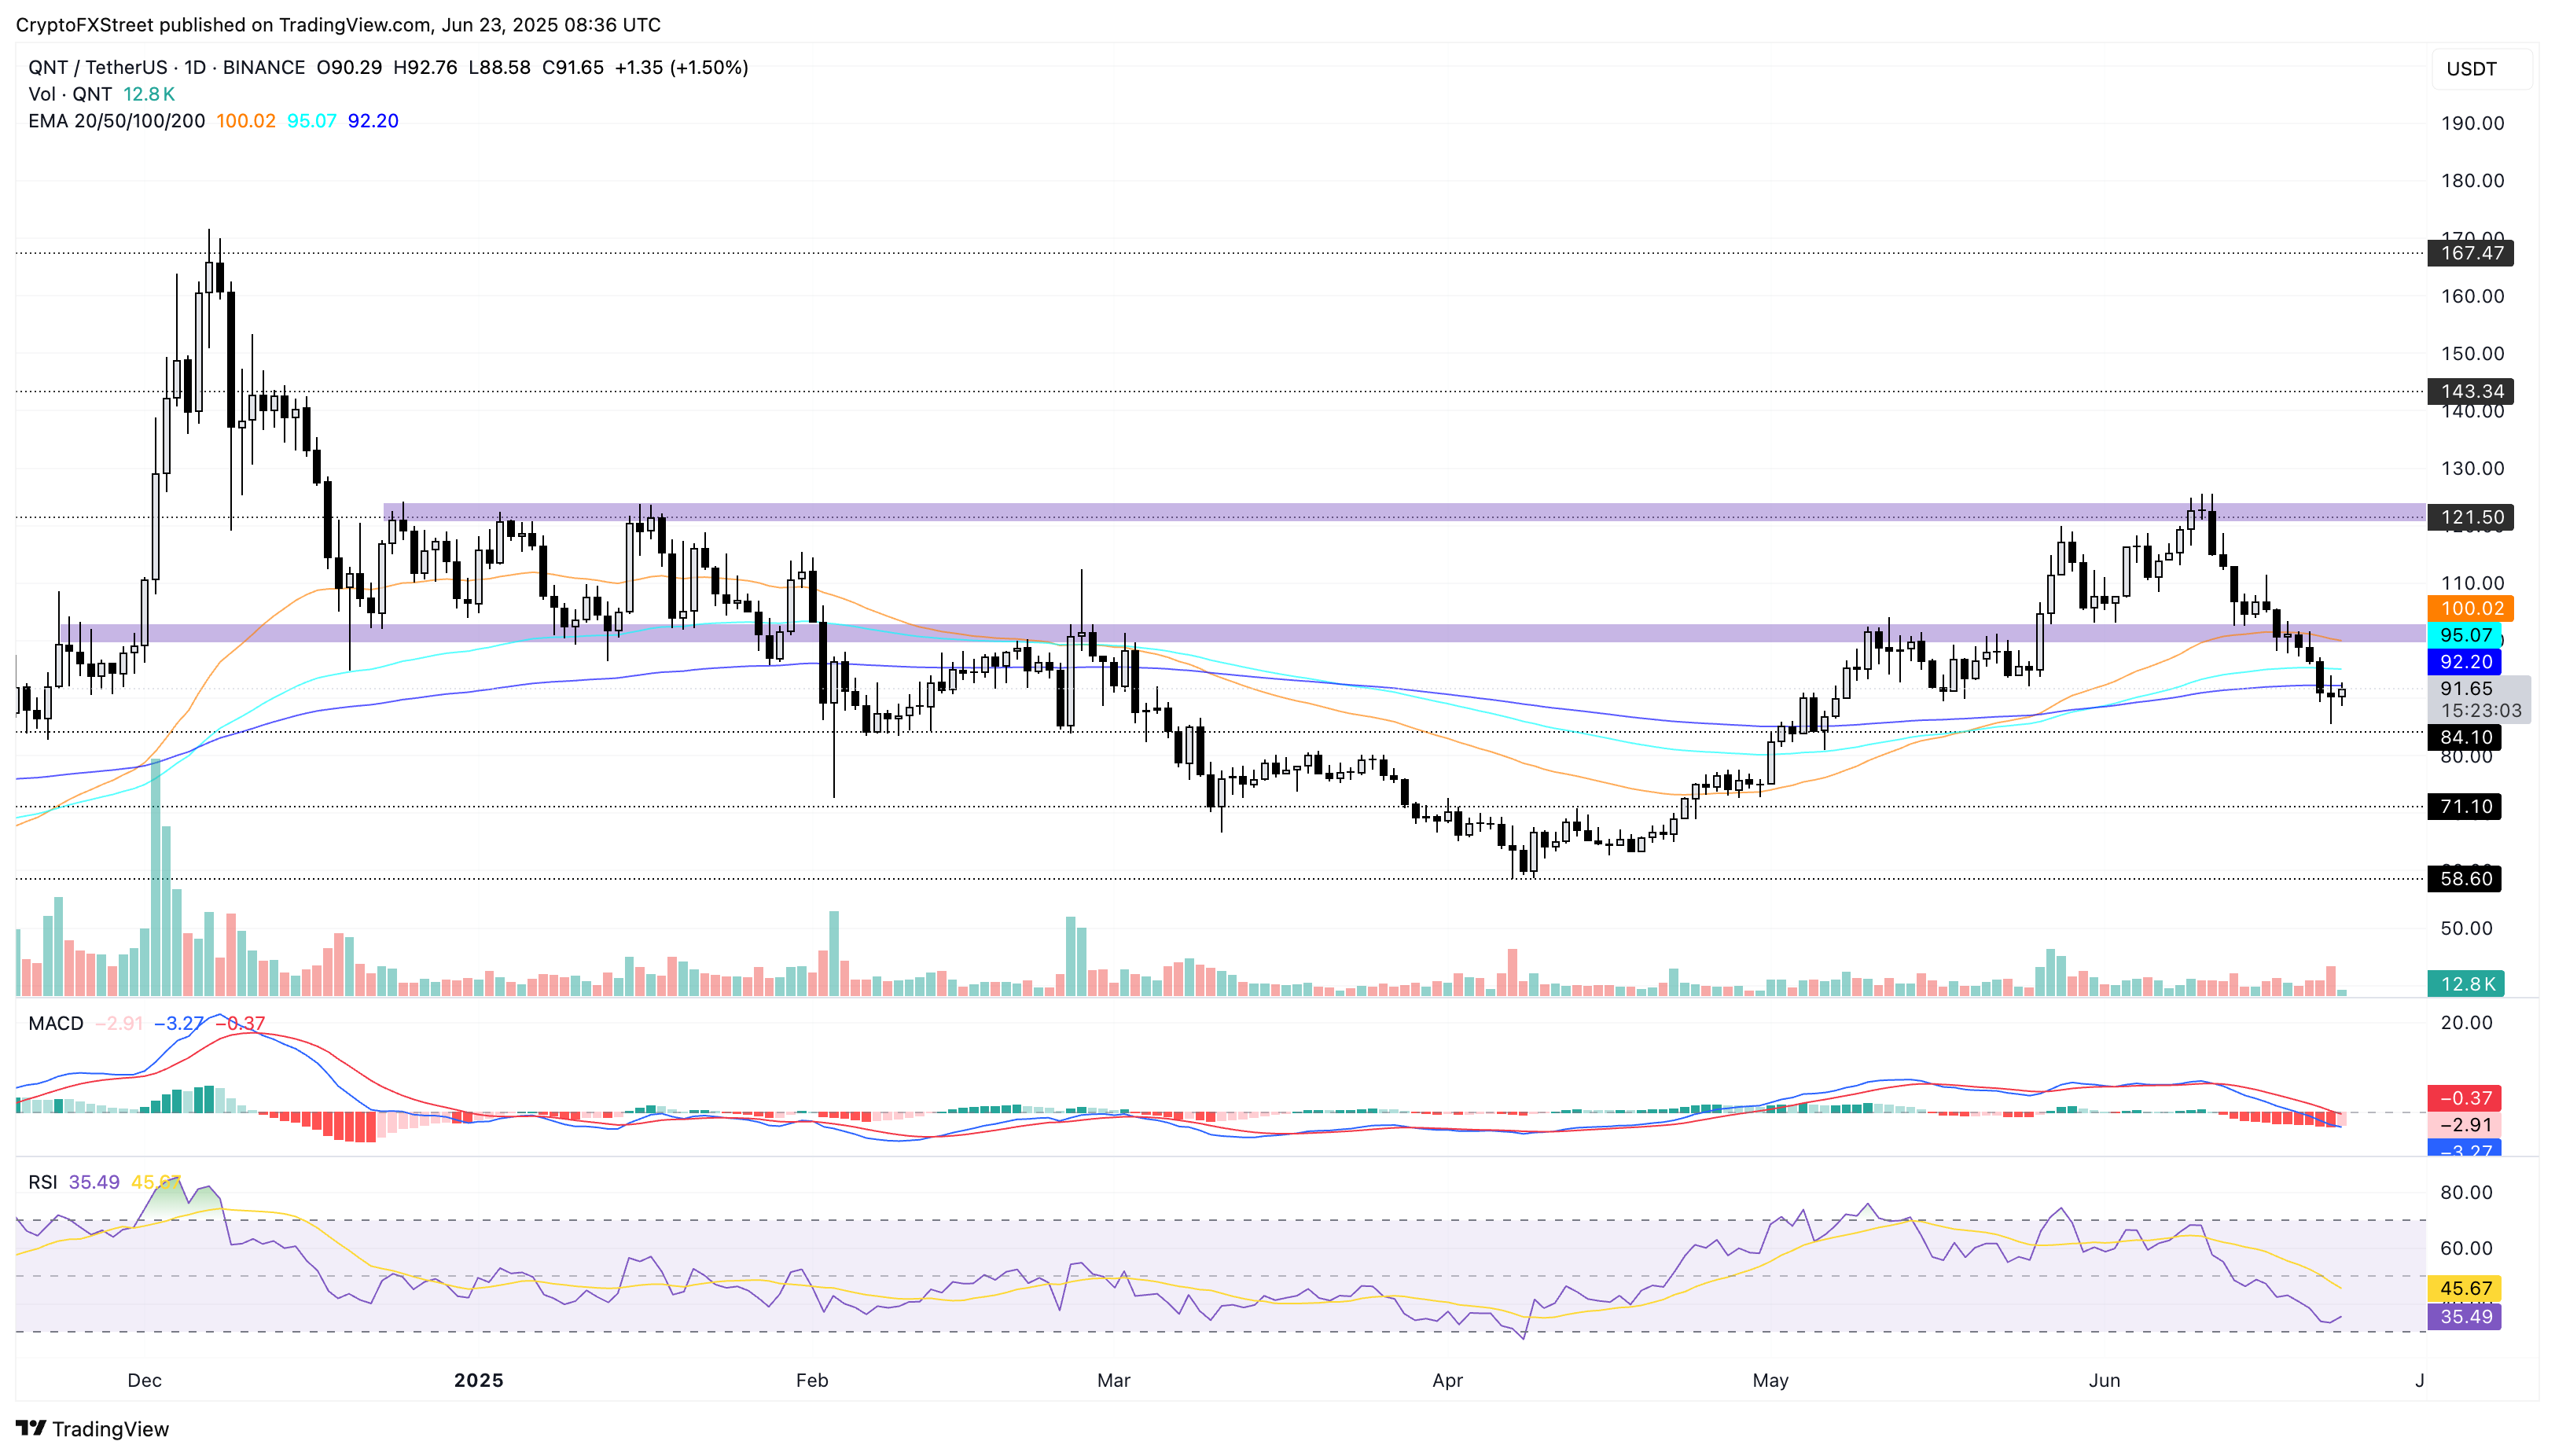
QNT/USDT daily price chart.
However, if QNT closes below the $84.10 support level, last tested in early May, bears could extend the declining trend towards $71.10, last tested on April 24.
Author

Vishal Dixit
FXStreet
Vishal Dixit holds a B.Sc. in Chemistry from Wilson College but found his true calling in the world of crypto.



