Pump.fun Price Forecast: PUMP shows signs of bottoming amid strong technicals, revenue rebound
- Pump.fun surges amid optimism across the crypto market.
- Pump.fun meme coin launchpad revenue rises to $1.33 million on Tuesday after falling to $753K earlier in September.
- A strong technical structure supports PUMP's short-term bullish outlook.

Pump.fun (PUMP) is gaining bullish momentum, advancing up over 13% to trade at $0.0067 on Wednesday. After surging to a new all-time high of $0.0089 on September 14, the meme coin platform native token trimmed most of the gains, testing support at around $0.0048.
PUMP's correction reflected negative sentiment in the broader cryptocurrency market, in addition to pressure from profit-taking activity following the rally.
Pump.fun revenue rises as crypto sentiment improves
The notion that September is generally a bearish month for crypto suppressed activities across the board] with meme coin launchpad Pump.fun experiencing a significant decline in revenue.
According to DefiLlama, Pump.fun's revenue dropped 69% from a record high of $2.44 million on September 15 to about $753,000 last Sunday. As sentiment across the crypto market improves, interest in meme coins grows, as evidenced by the DEX revenue increasing to $1.33 million by Monday.
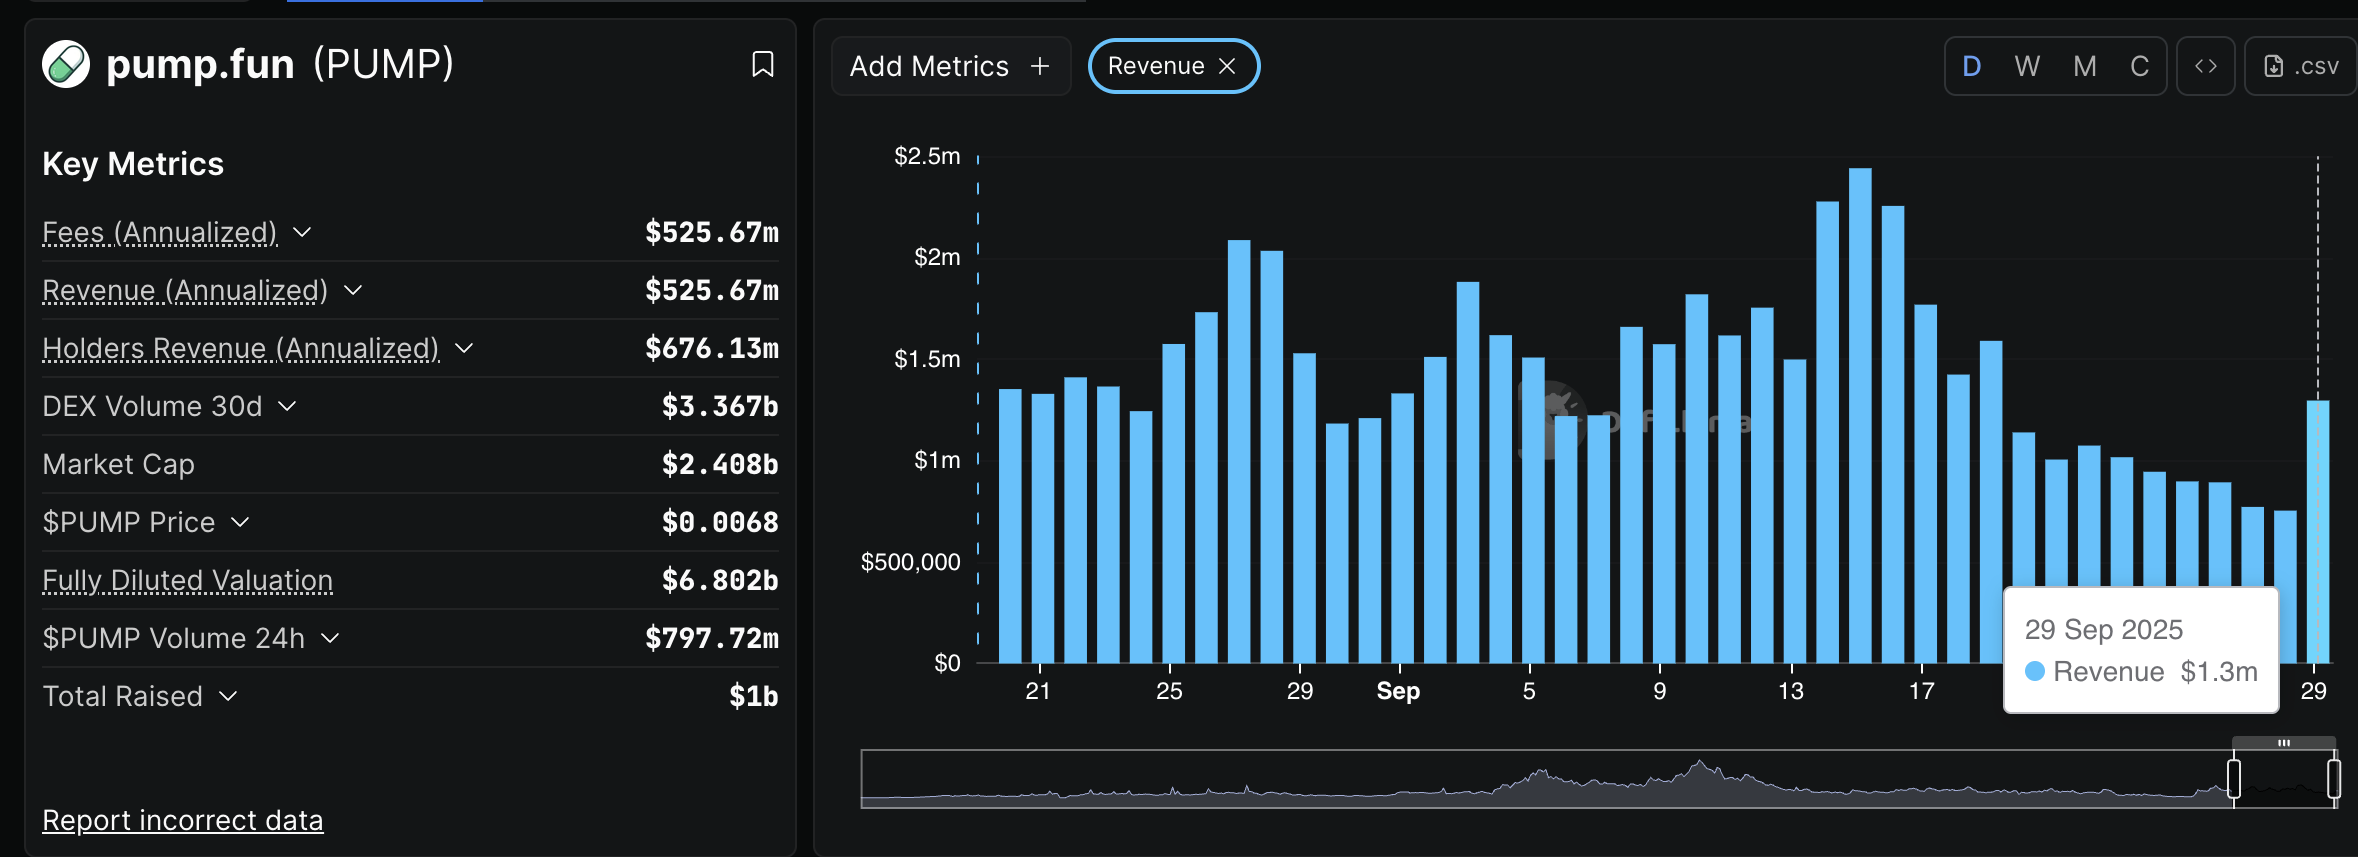
Pump.fun revenue | Source: DefiLlama
Pump.fun conducts frequent token buybacks using the revenue from the launchpad. Therefore, when revenue declines, buybacks also reduce. If revenue steadily rises in October and through the fourth quarter, PUMP could extend the rally above the psychological level at $0.0100.
Pump.fun has also experienced a significant increase in DEX volume, from the lowest level in September at $57 million to $102 million by Tuesday.
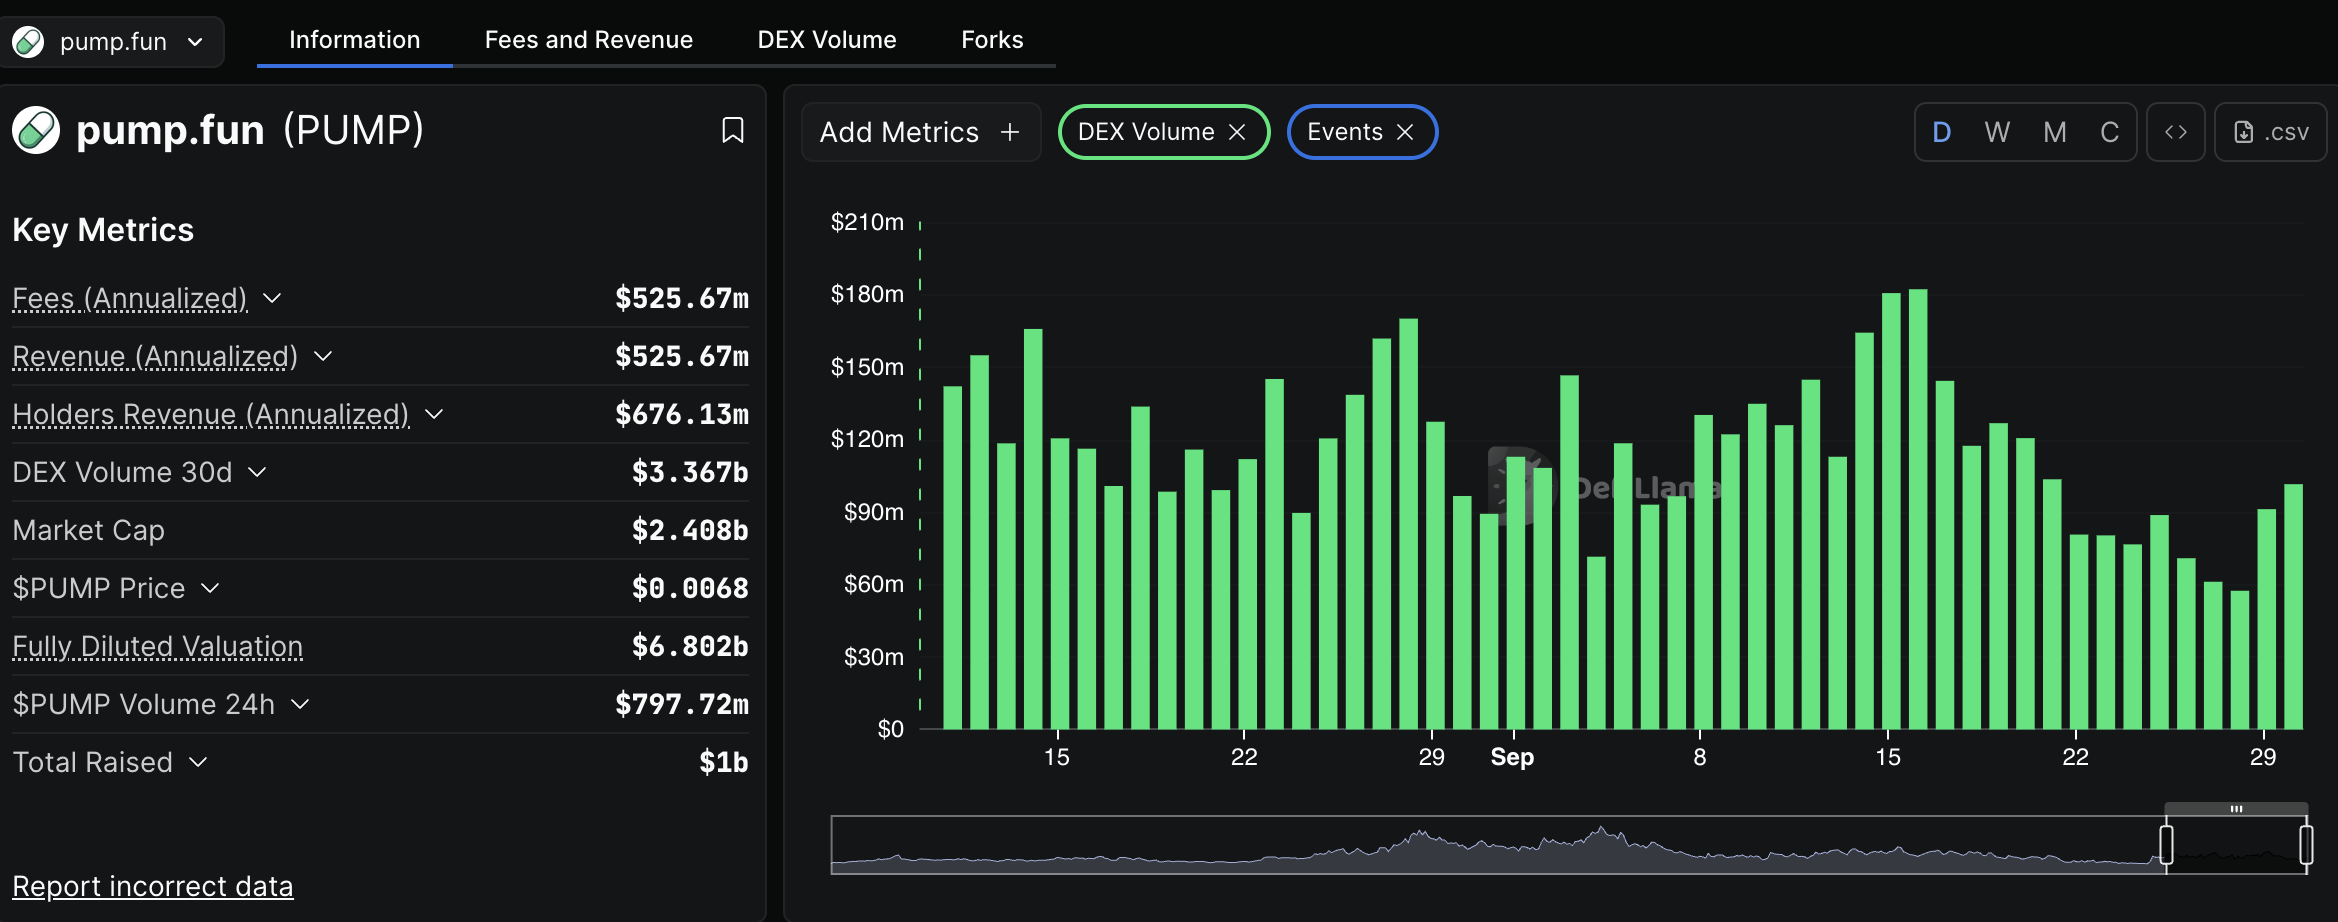
Pump.fun DEX volume | Source: DefiLlama
Technical outlook: Pump bulls tighten grip
Pump.fun is currently holding above $0.0067 at the time of writing, after pulling back from an intraday high of $0.0069. The Relative Strength Index (RSI), which is currently approaching overbought territory, supports the token's short-term bullish structure.
A buy signal maintained by the Moving Average Convergence Divergence (MACD) indicator suggests that bullish momentum is robust and may continue to support the uptrend as investors seek to increase risk exposure. The green histogram bars above the mean line hint at a grounded bullish outlook.
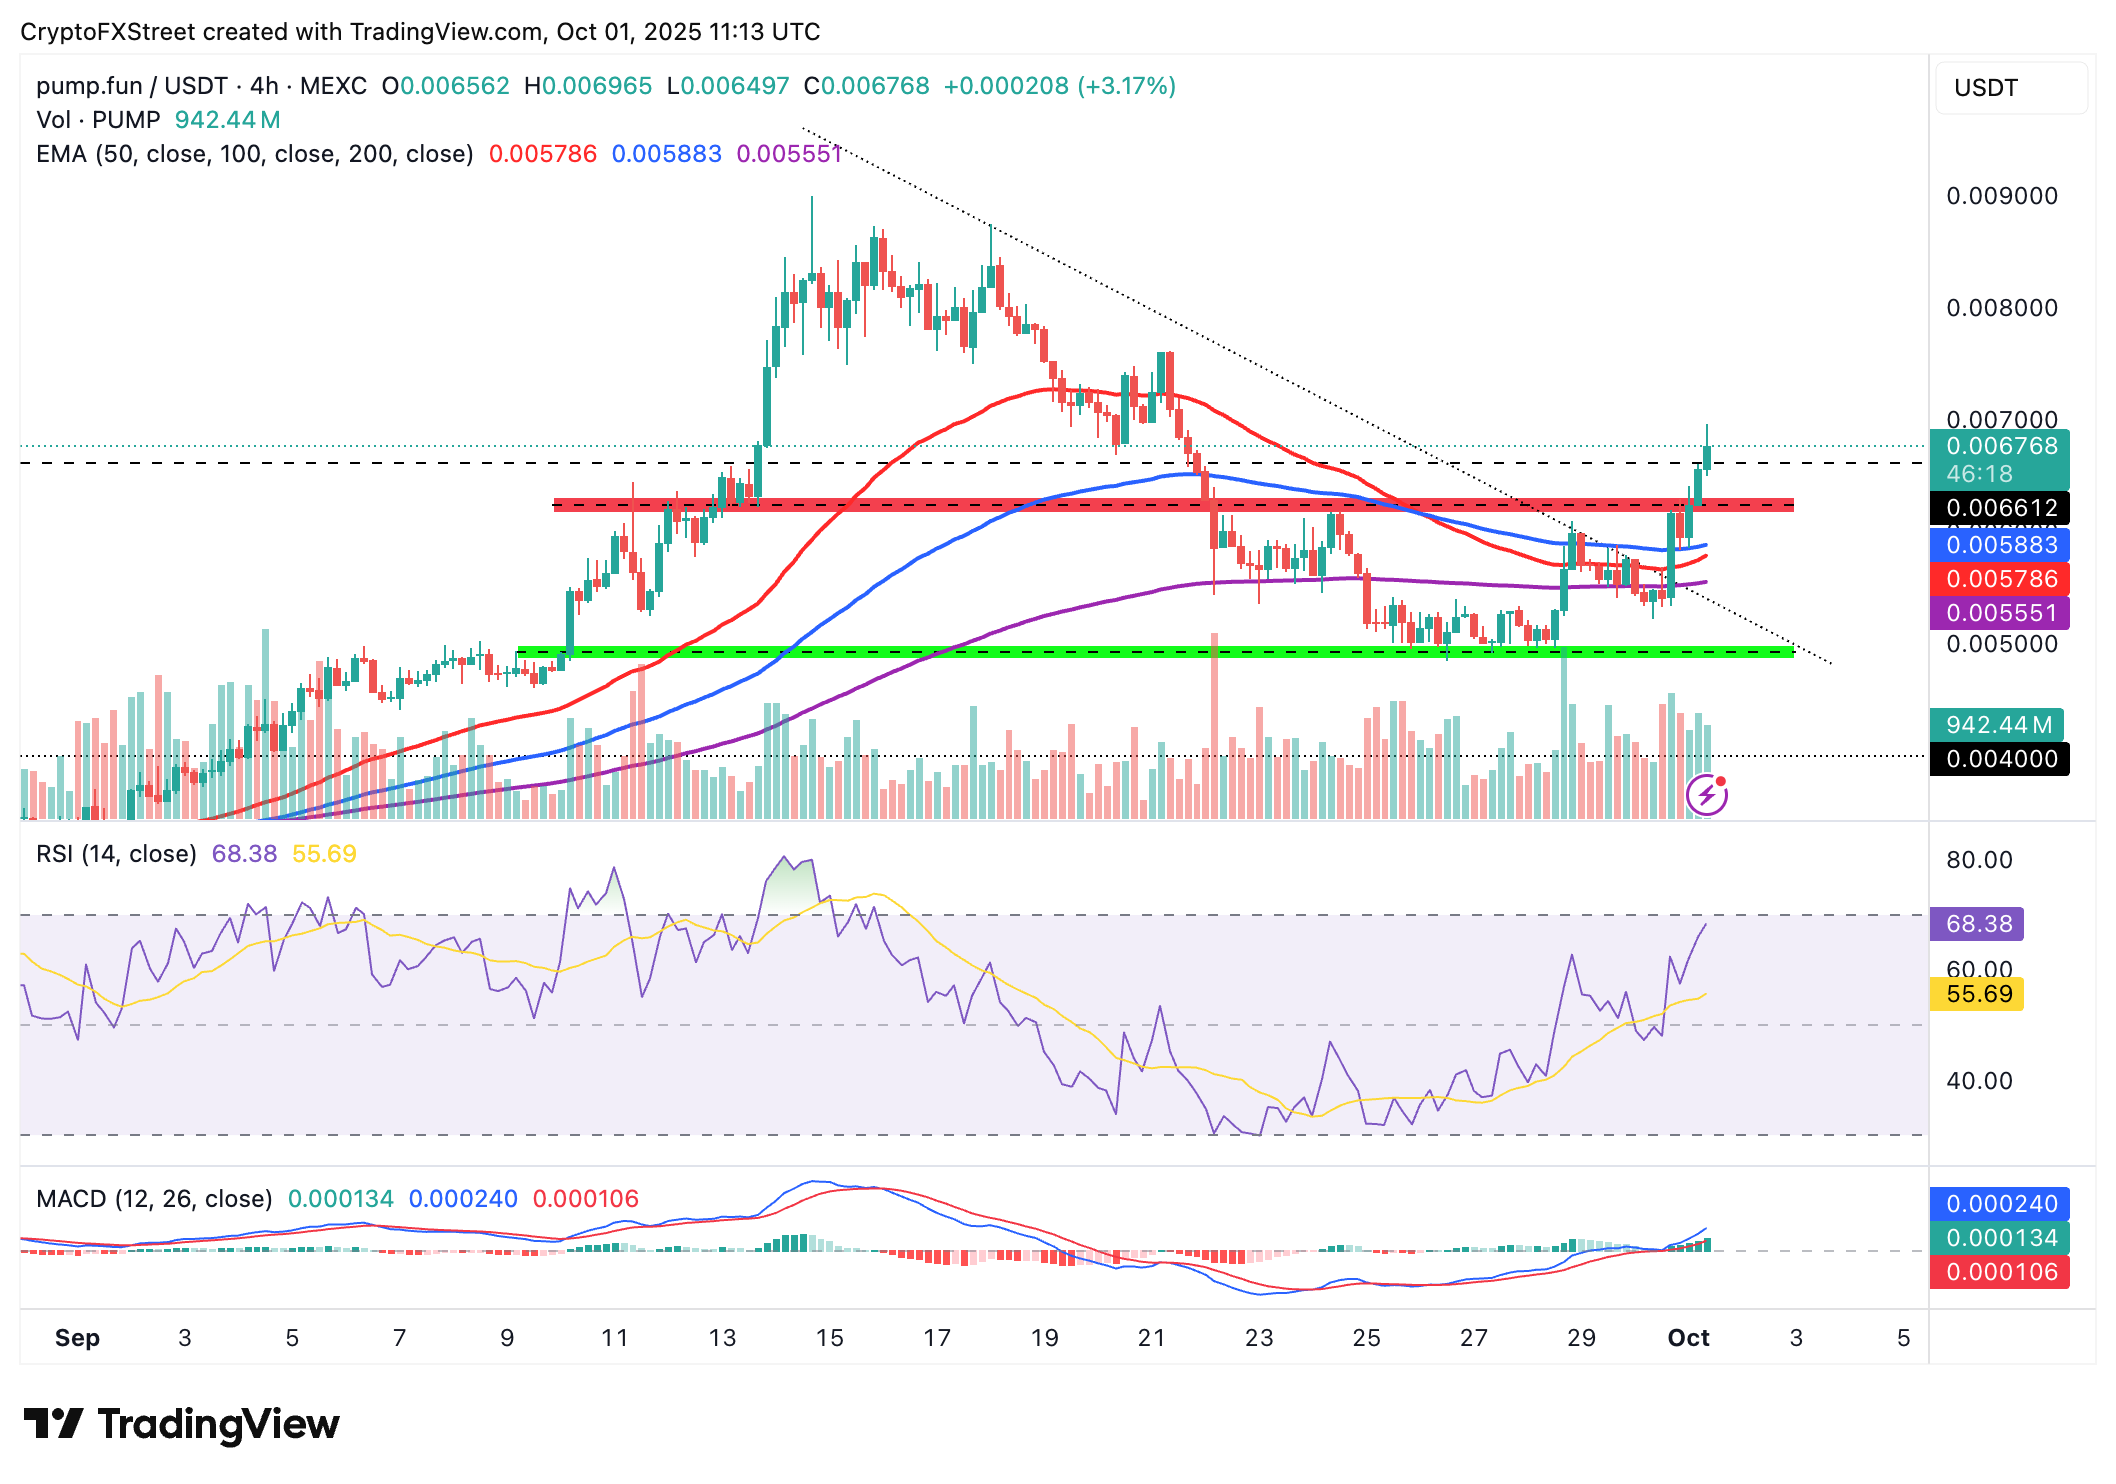
PUMP/USDT daily chart
A potential price movement above the next key hurdle at $0.0070 would go a long way in encouraging traders to increase exposure, anticipating a breakout toward PUMP's record high of $0.0089.
Traders should be cautiously optimistic as the RSI approaches overbought territory. Extremely high RSI readings in this region are often a precursor to sudden pullbacks, as observed after the rally to new record highs in mid-September.
Other key areas of interest for traders are the 100-period Exponential Moving Average (EMA) at $0.0058, the 50-period EMA at $0.0057 and the 200-day EMA at $0.0055, all of which could serve as tentative support if PUMP reverses the trend.
Cryptocurrency prices FAQs
Token launches influence demand and adoption among market participants. Listings on crypto exchanges deepen the liquidity for an asset and add new participants to an asset’s network. This is typically bullish for a digital asset.
A hack is an event in which an attacker captures a large volume of the asset from a DeFi bridge or hot wallet of an exchange or any other crypto platform via exploits, bugs or other methods. The exploiter then transfers these tokens out of the exchange platforms to ultimately sell or swap the assets for other cryptocurrencies or stablecoins. Such events often involve an en masse panic triggering a sell-off in the affected assets.
Macroeconomic events like the US Federal Reserve’s decision on interest rates influence crypto assets mainly through the direct impact they have on the US Dollar. An increase in interest rate typically negatively influences Bitcoin and altcoin prices, and vice versa. If the US Dollar index declines, risk assets and associated leverage for trading gets cheaper, in turn driving crypto prices higher.
Halvings are typically considered bullish events as they slash the block reward in half for miners, constricting the supply of the asset. At consistent demand if the supply reduces, the asset’s price climbs.
Author

John Isige
FXStreet
John Isige is a seasoned cryptocurrency journalist and markets analyst committed to delivering high-quality, actionable insights tailored to traders, investors, and crypto enthusiasts. He enjoys deep dives into emerging Web3 tren


