Pump.fun Price Forecast: PUMP rallies as whales accumulate
- Pump.fun extends recovery above $0.0050, supported by growing risk appetite.
- Whales increase exposure by accumulating PUMP and withdrawing from exchanges.
- Pump.fun revenue surpassed the $1 million, rising from $545K on October 12.

Pump.fun (PUMP) extends recovery, breaking above $0.0050 on Tuesday. This bullish outlook builds on positive sentiment in the broader cryptocurrency market, hinting at a potential end-of-month rally.
PUMP soars amid whale accumulation
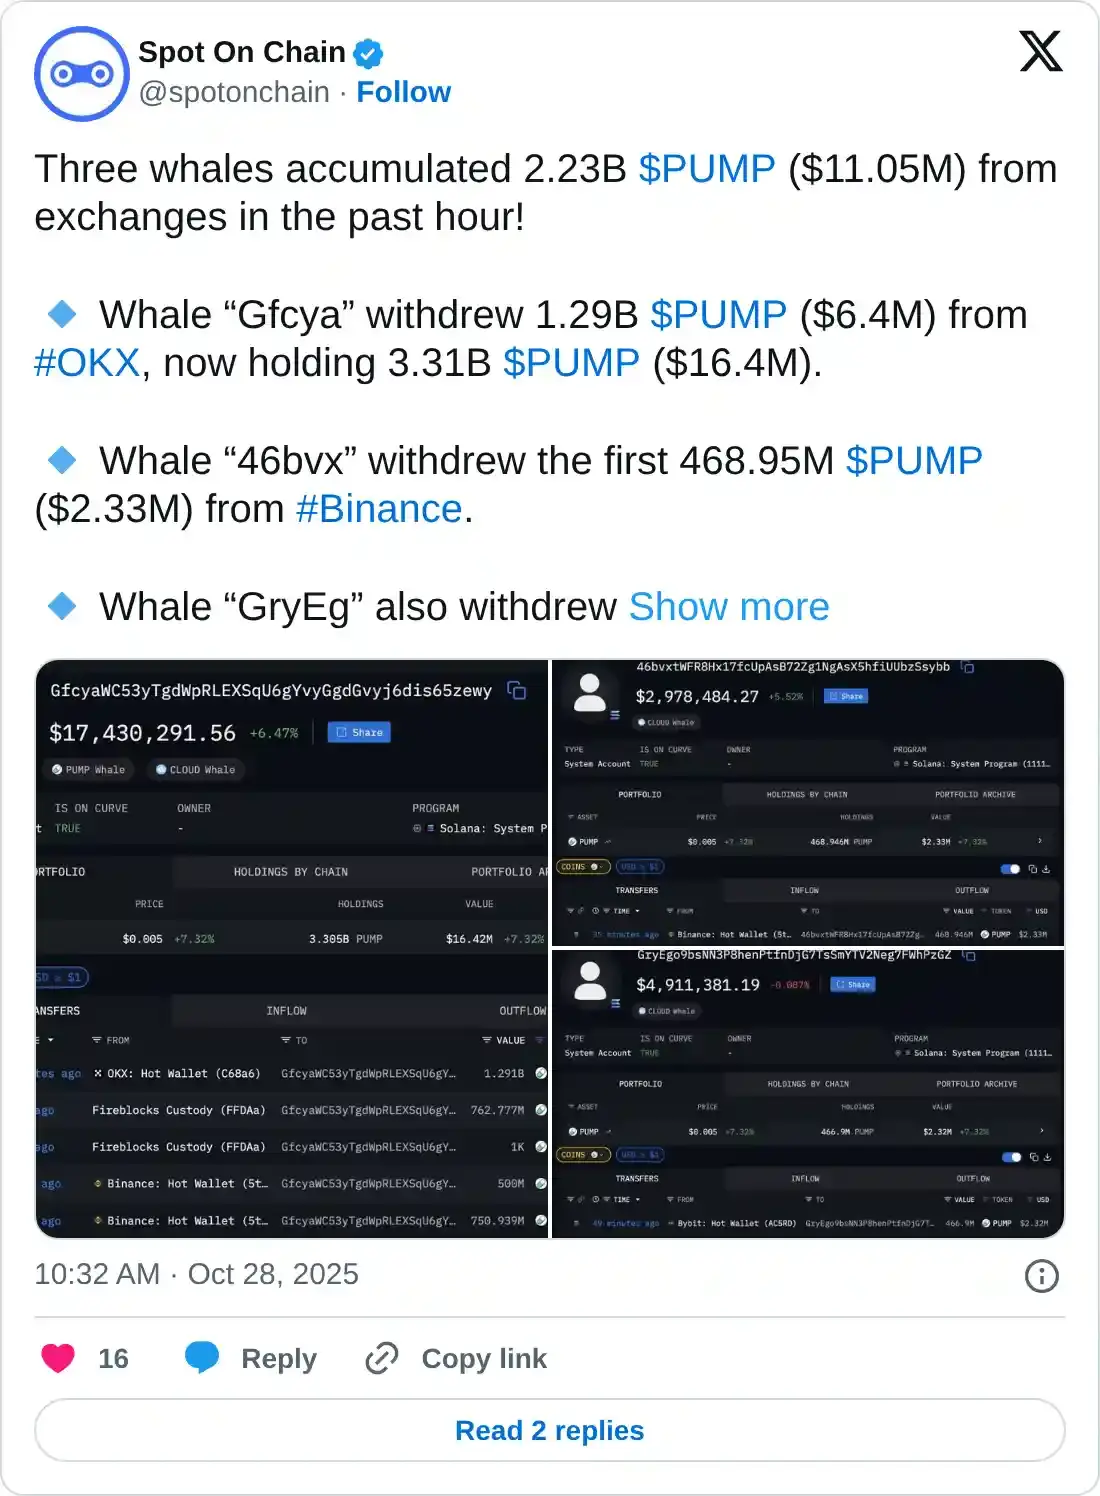
Interest in PUMP, the native token of Pump.fun, a meme coin launchpad, is gaining momentum, increasing the odds of a steady price increase. According to Spot On Chain, three whales accumulated 2.23 billion PUMP valued at $11.05 million across different exchanges on Tuesday.
The first whale withdrew 1.29 billion PUMP, worth around $6.4 million, from the OKX exchange, increasing total holdings to 3.31 billion PUMP valued at $16.4 million.
The second whale withdrew 468.95 million PUMP, valued at $2.33 million from Binance, while the third whale withdrew a total of 466.9 million PUMP, approximately $2.32 million from Bybit.
Meanwhile, the meme coin launchpad is experiencing a resurgence in platform revenue, which averages $1.01 million, up from approximately $545,000 on October 12.
Platform revenue comprises fees collected from trading and token launching activities. Pump.fun operates a token buyback program using the revenue, a move expected to have a long positive impact on the token as circulating supply decreases.
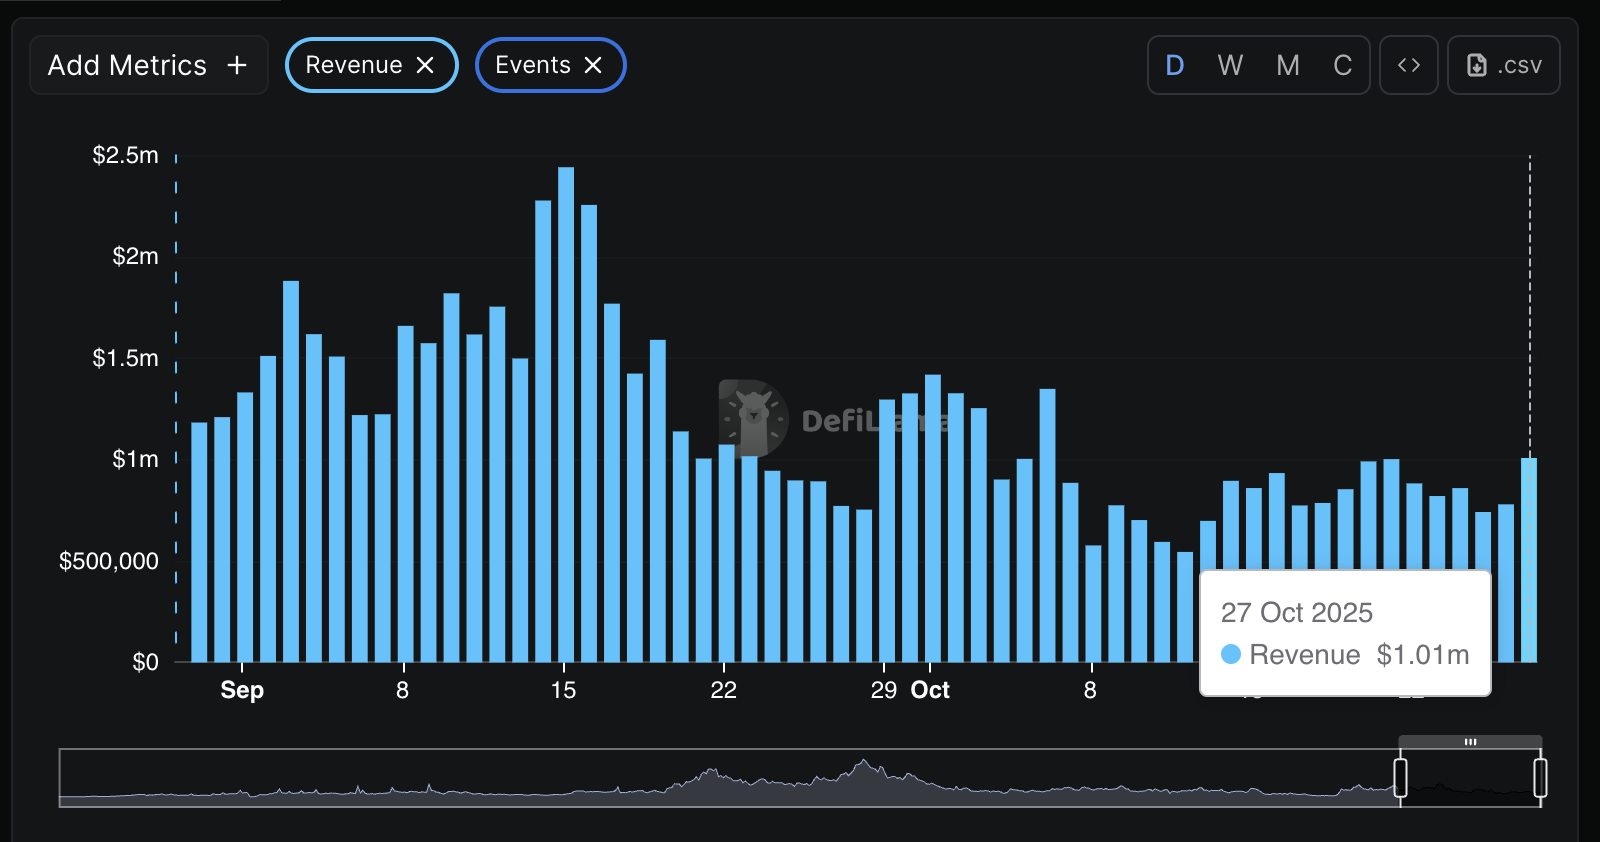
Pump.fun revenue | Source DefiLlama
CoinGlass data shows that retail interest in the token is slowly recovering, with the futures Open Interest (OI) averaging $431 million at the time of writing, from approximately $267 million on October 11. As investors increase their exposure, they create a strong tailwind, increasing the probability of a continued recovery. PUMP hit a new all-time high of $0.0089 on September 14, two days before the OI peaked at $1.23 billion on September 16.
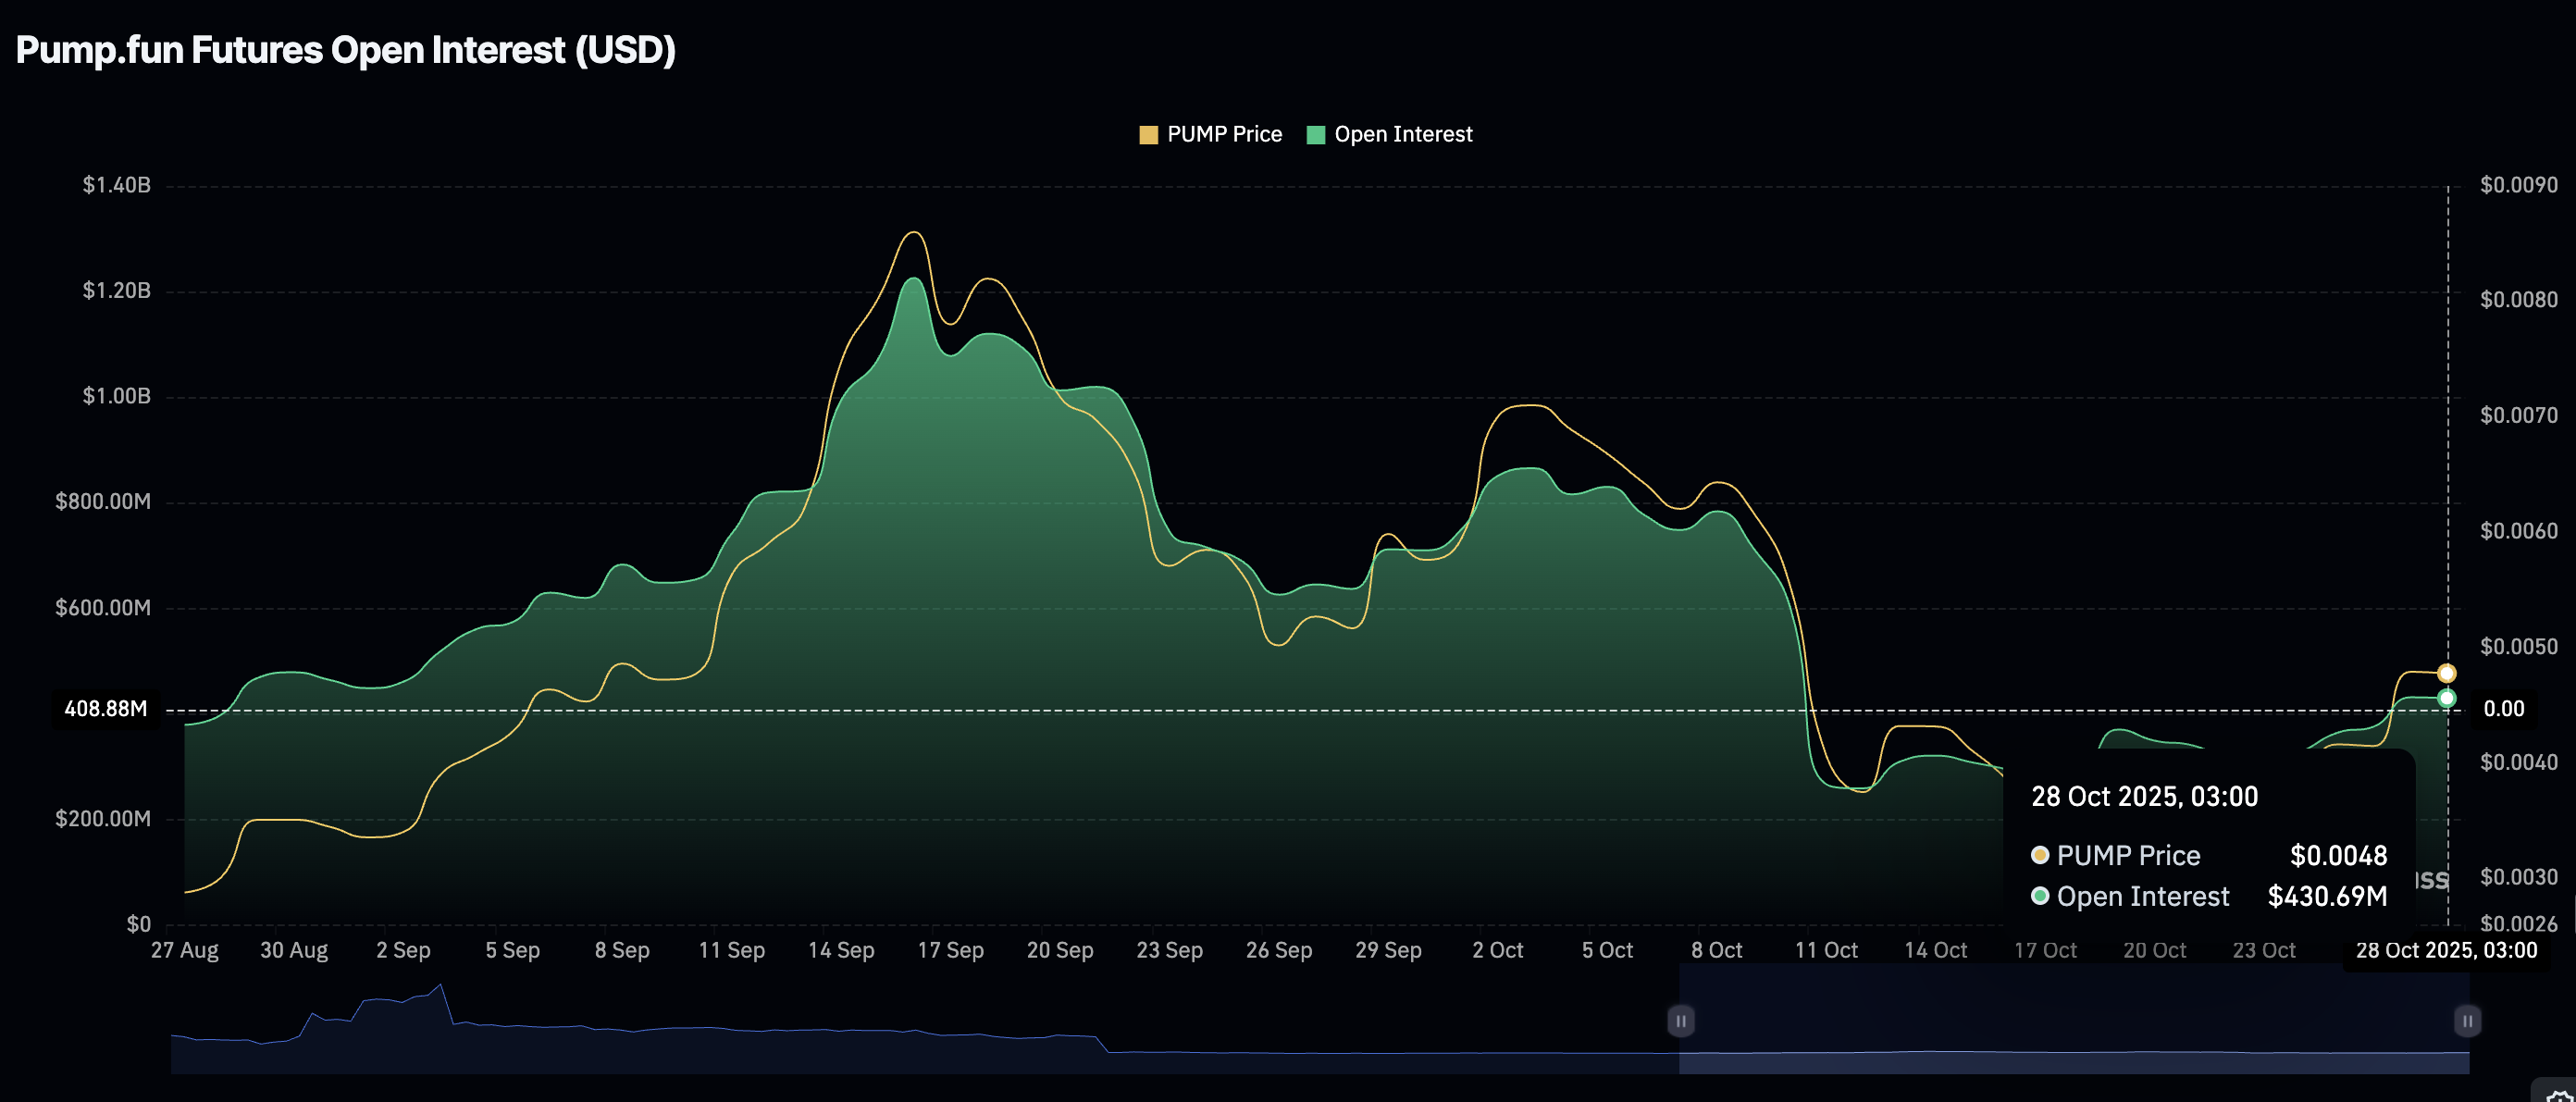
PUMP Futures Open Interest | Source: CoinGlass
Technical outlook: PUMP bulls tighten their grip
PUMP is trading above $0.0050 at the time of writing on Tuesday, supported by bullish sentiment across the crypto market and demand from whales and retail traders.
The Moving Average Convergence Divergence (MACD) indicator on the 4-hour chart has upheld a buy signal since Friday, validating PUMP’s bullish outlook.
Traders will watch for a daily close above the initial support of $0.0050 to ascertain the uptrend’s strength. Other key milestones include a break above a descending trendline, which has been in place since mid-September when PUMP achieved its record high, around $0.0089, and the supply area at $0.0066, last tested in early October.
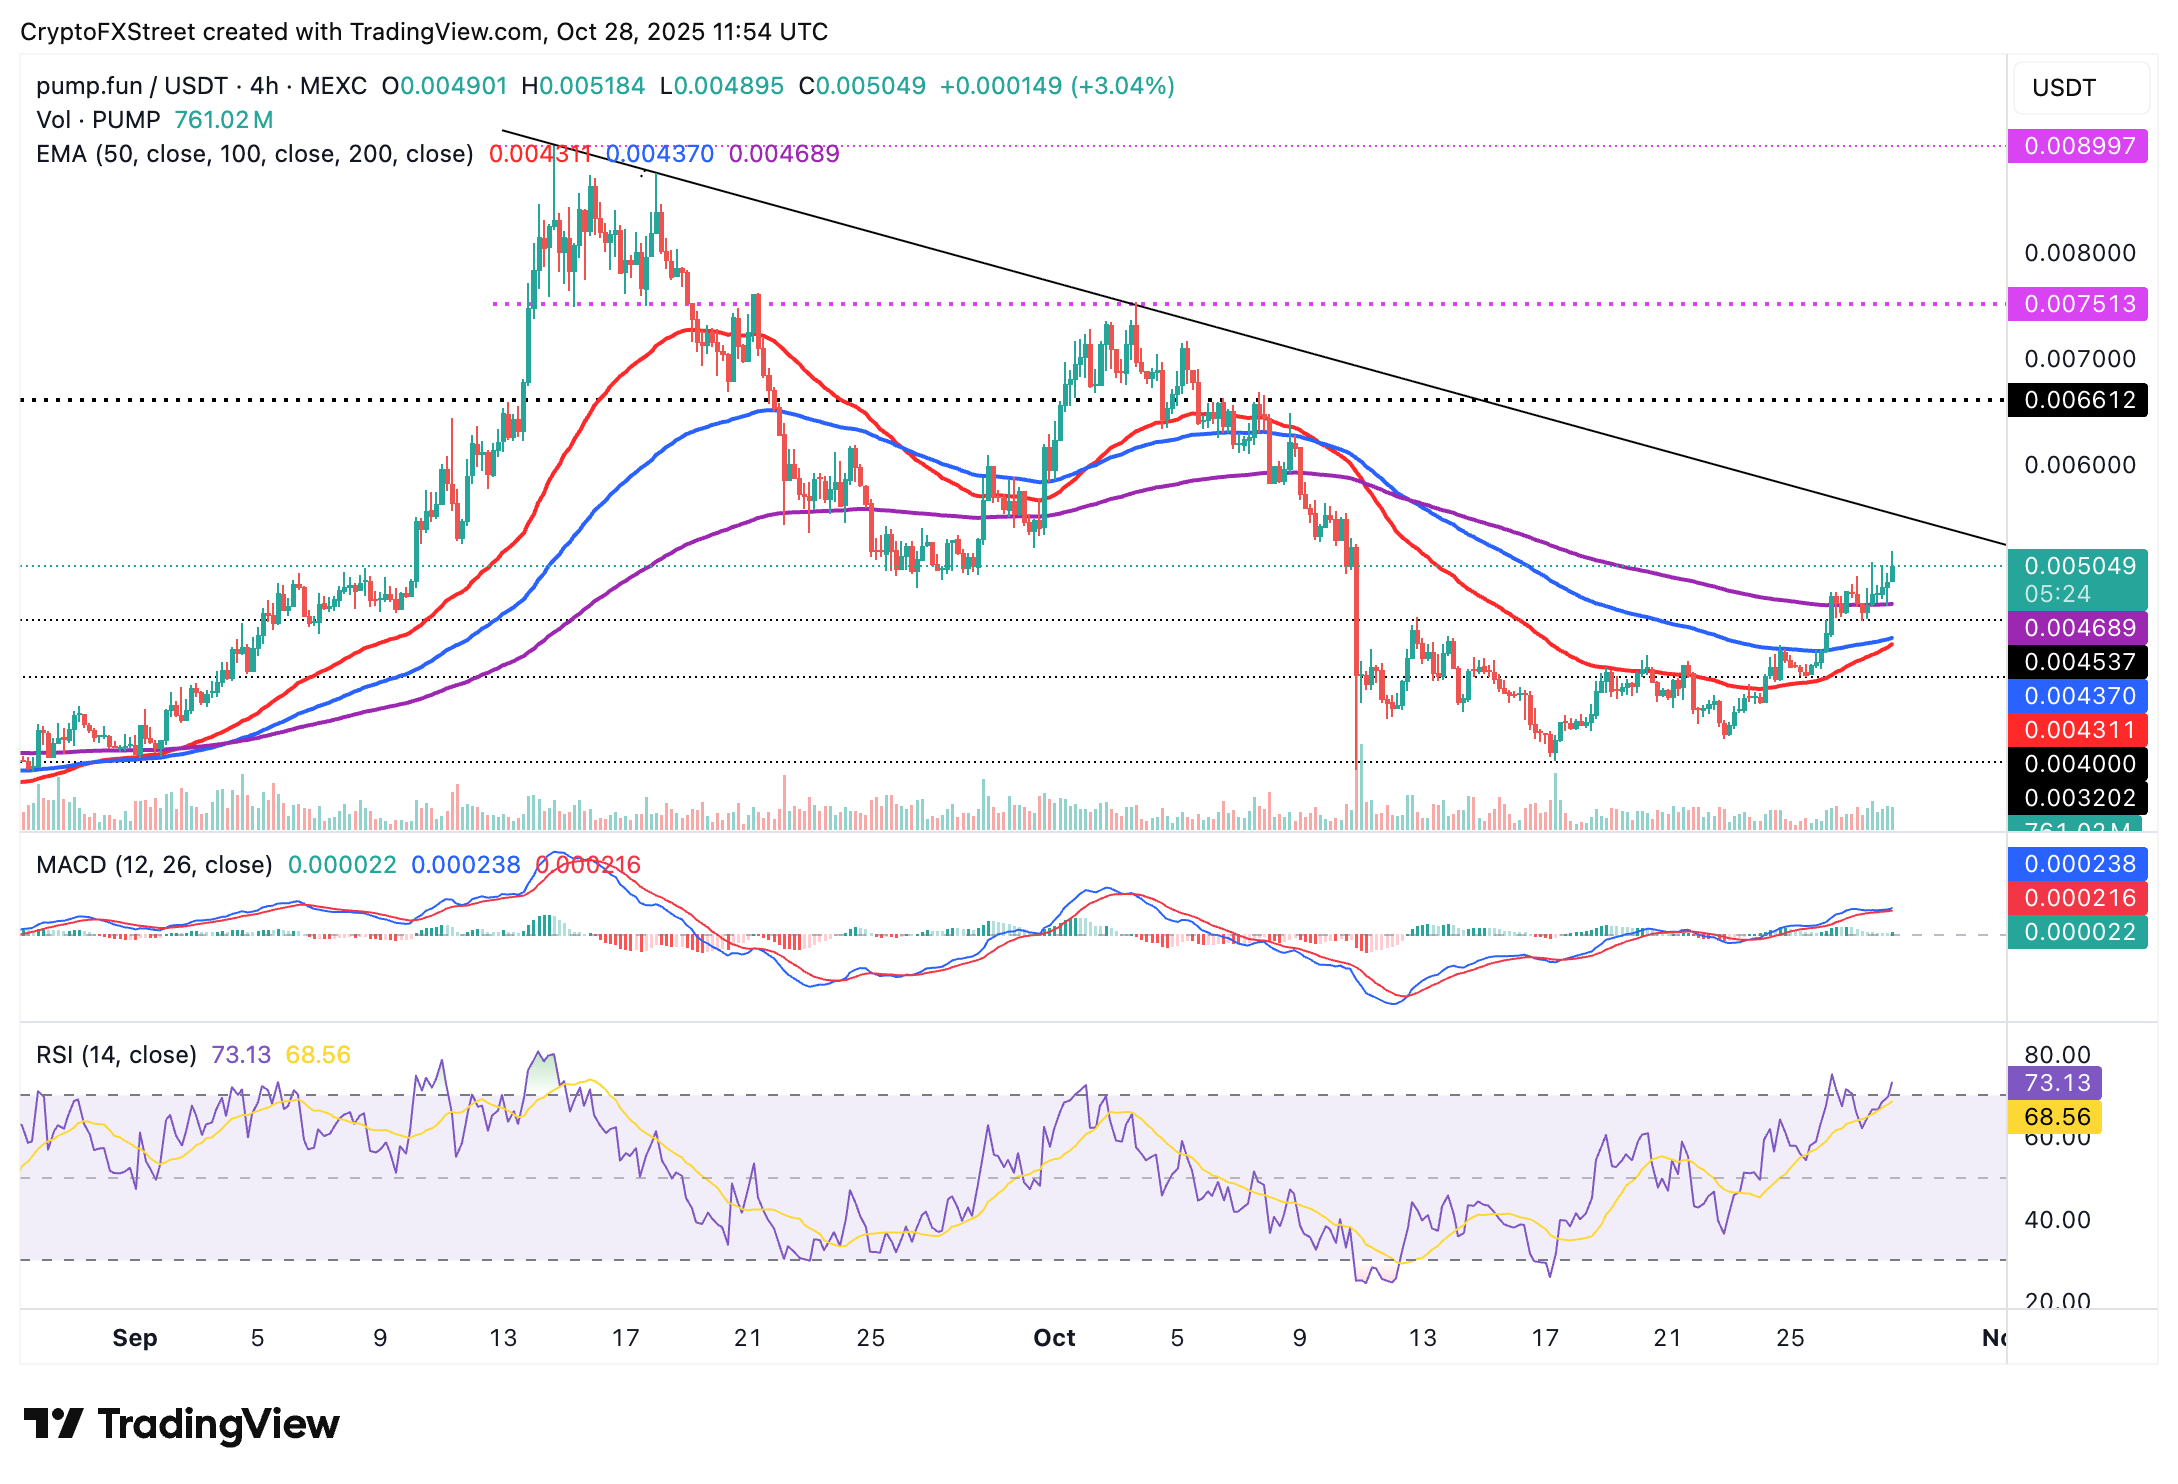
PUMP/USDT daily chart
The Relative Strength Index (RSI), which has risen to 72, underpins the bullish momentum. However, traders should be cautiously optimistic, as overbought conditions often precede sudden pullbacks driven by potential profit-taking and shifts in market dynamics. Hence, investors must not lose sight of the 200-period Exponential Moving Average (EMA) at $0.0046 and the 100-period EMA at $0.0043, both of which may absorb selling pressure.
Cryptocurrency metrics FAQs
The developer or creator of each cryptocurrency decides on the total number of tokens that can be minted or issued. Only a certain number of these assets can be minted by mining, staking or other mechanisms. This is defined by the algorithm of the underlying blockchain technology. On the other hand, circulating supply can also be decreased via actions such as burning tokens, or mistakenly sending assets to addresses of other incompatible blockchains.
Market capitalization is the result of multiplying the circulating supply of a certain asset by the asset’s current market value.
Trading volume refers to the total number of tokens for a specific asset that has been transacted or exchanged between buyers and sellers within set trading hours, for example, 24 hours. It is used to gauge market sentiment, this metric combines all volumes on centralized exchanges and decentralized exchanges. Increasing trading volume often denotes the demand for a certain asset as more people are buying and selling the cryptocurrency.
Funding rates are a concept designed to encourage traders to take positions and ensure perpetual contract prices match spot markets. It defines a mechanism by exchanges to ensure that future prices and index prices periodic payments regularly converge. When the funding rate is positive, the price of the perpetual contract is higher than the mark price. This means traders who are bullish and have opened long positions pay traders who are in short positions. On the other hand, a negative funding rate means perpetual prices are below the mark price, and hence traders with short positions pay traders who have opened long positions.
Author

John Isige
FXStreet
John Isige is a seasoned cryptocurrency journalist and markets analyst committed to delivering high-quality, actionable insights tailored to traders, investors, and crypto enthusiasts. He enjoys deep dives into emerging Web3 tren