Polygon Price Forecast: POL strengthens on bullish on-chain data
- Polygon price trades in green on Tuesday after finding support around a key zone the previous day.
- On-chain data paints a bullish picture with rising Open Interest, stablecoin market capitalization, and growing dominance over non-USD stablecoins.
- The technical outlook suggests a potential rally, with POL targeting levels above $0.33.

Polygon (POL) ex-MATIC trades in green, above $0.28 at the time of writing on Tuesday, after finding support around a key zone earlier this week. Strengthening on-chain metrics further support the rally continuation with rising Open Interest (OI) and stablecoin market capitalization, alongside growing dominance, over non-USD stablecoins. The technical setup suggests POL could rally beyond the $0.33 mark if momentum holds.
POL’s derivatives and on-chain metrics show bullish bias
Futures’ OI in Polygon at exchanges rose from $115.46 million on Friday to $177.29 million on Monday, the highest level since December 10 and has been consistently rising. Rising OI represents new or additional money entering the market and new buying, which could fuel the current POL price rally.
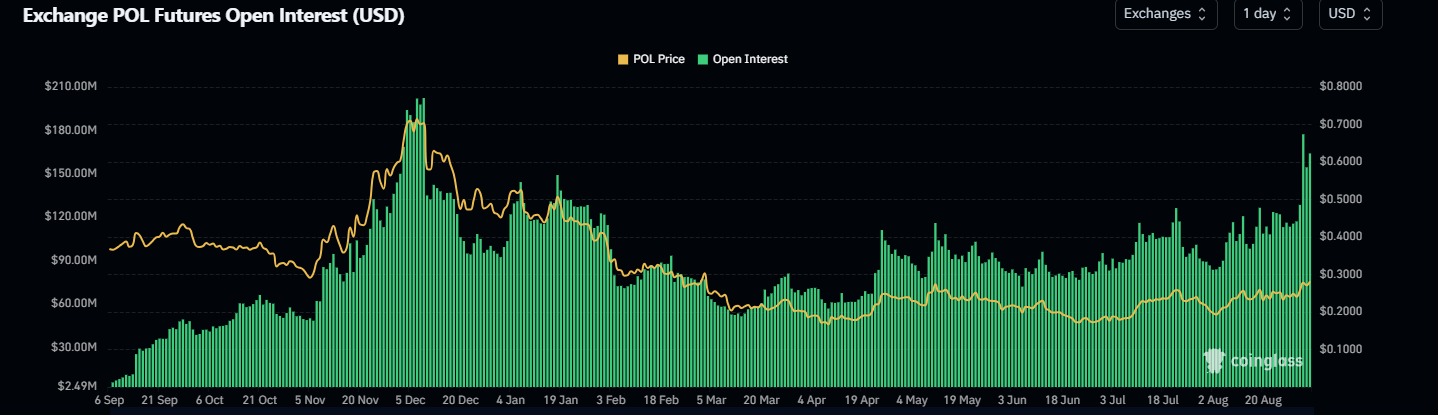
Polygon Open Interest chart. Source: Coinglass
Data from crypto intelligence tracker DefiLlama shows that Polygon’s stablecoin market capitalization has risen sharply since mid-August and currently stands at $2.95 billion on Tuesday, the highest level since mid-July 2021. Such stablecoin activity and value increase on the POL project indicate a bullish outlook, as they boost network usage and can attract more users to the ecosystem.
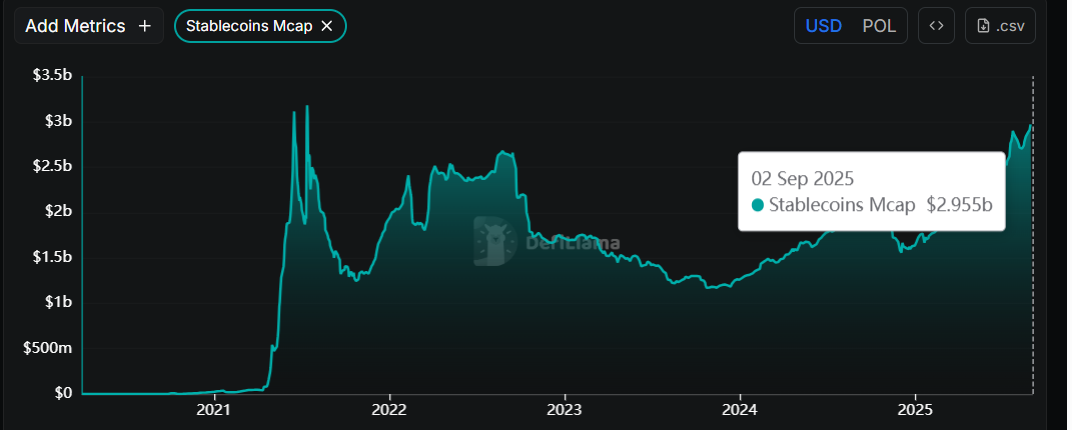
POL stablecoin market capitalization chart. Source: DefiLlama
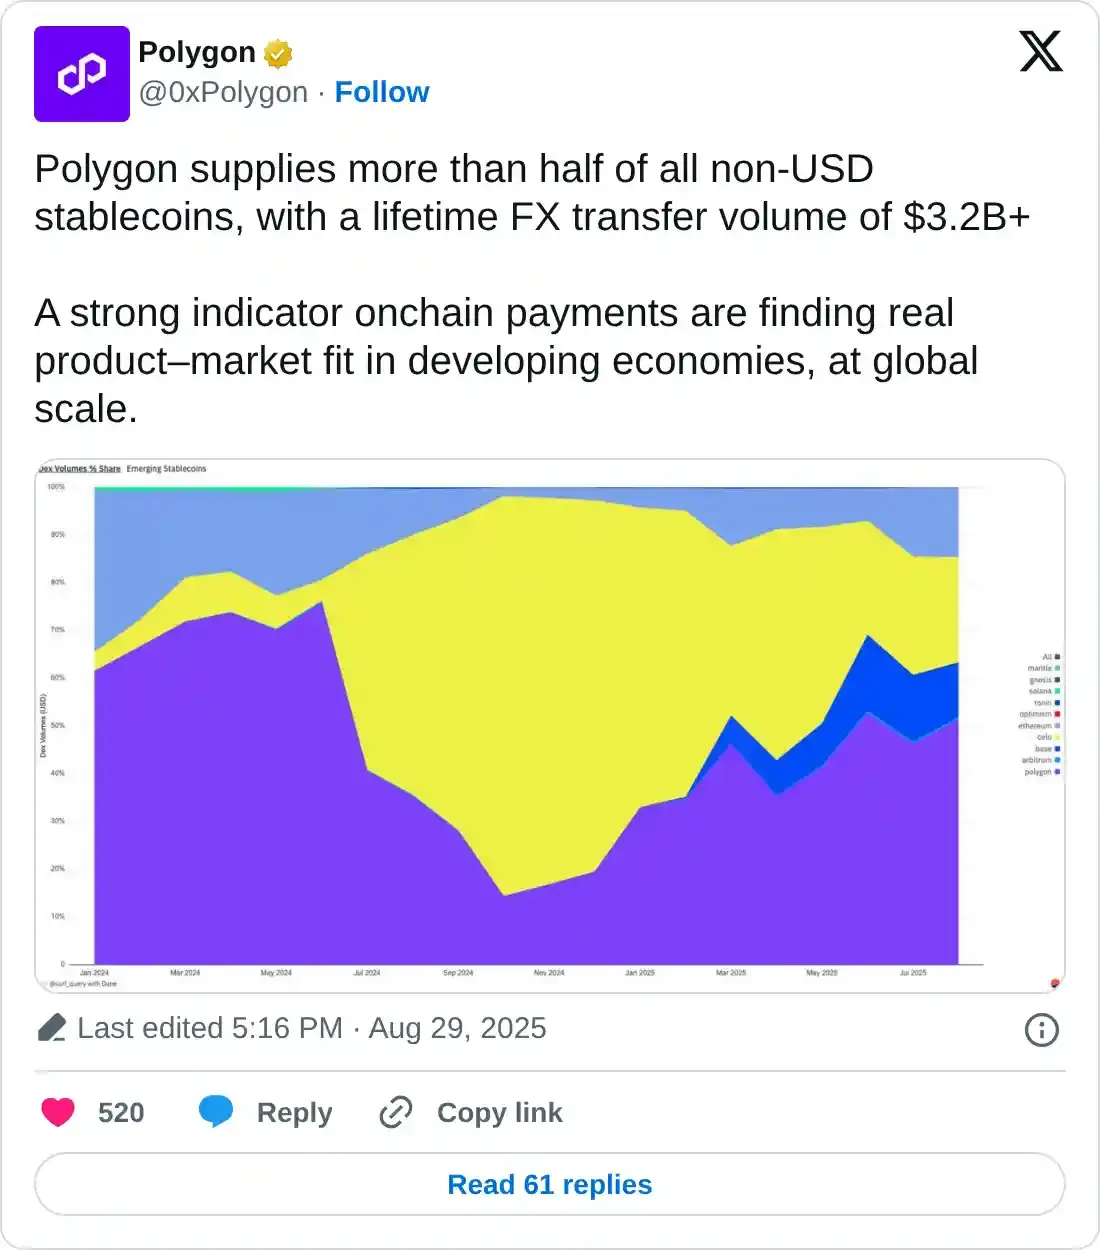
Additionally, Polygon supplies more than half of all non-USD stablecoins, with a lifetime transfer volume of $3.2 billion, further supporting the bullish view.
Polygon Price Forecast: POL momentum indicator hints at a bullish rally
Polygon price rallied over 8% on Sunday and broke above the key resistance zone extending from $0.25–$0.27 levels. On Monday, it declined slightly, retested, and found support in the zone. At the time of writing on Tuesday, it is extending its gains by more than 5%, trading above $0.28.
If Polygon continues its upward momentum and closes above its weekly resistance at $0.29, it could extend the rally toward its next daily resistance at $0.33.
The Relative Strength Index (RSI) on the daily chart reads 64, above its neutral level of 50 and points upward, indicating strong bullish momentum. The Moving Average Convergence Divergence (MACD) indicator showed a bullish crossover on Sunday, generating a buy signal and further supporting the bullish view.
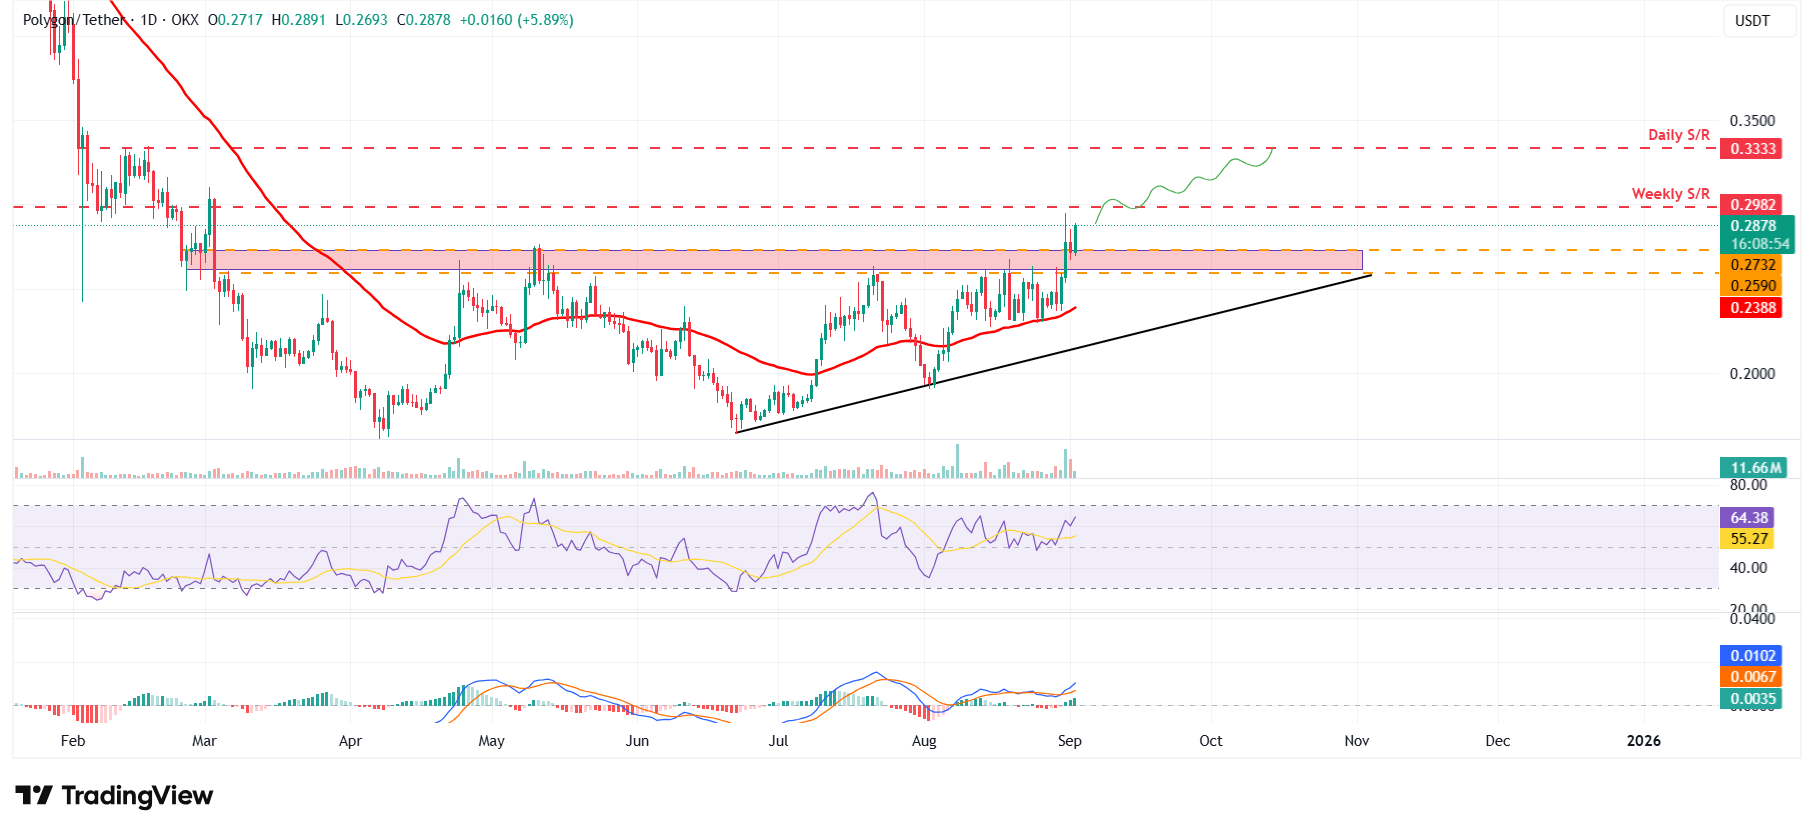
POL/USDT daily chart
However, if POL faces a correction, it could extend the decline toward its lower boundary of the support zone at $0.25.
Author

Manish Chhetri
FXStreet
Manish Chhetri is a crypto specialist with over four years of experience in the cryptocurrency industry.



