Polkadot price to provide last buy opportunity before DOT hits $100
- Polkadot price begins its coiling up, just below its all-time high at $49.78.
- This consolidation reveals a rising wedge pattern, hinting at a minor pullback before DOT enters price discovery mode.
- A breakdown below $25.50 will invalidate the bullish thesis.

Polkadot price saw a consistent upswing over the past month. However, this rally might cost DOT in the short term as it resulted in the formation of a bearish pattern. Therefore, investors should expect a minor pullback, acting as a buying opportunity, before Polkadot price explodes to new highs.
Polkadot price prepares to enter unexplored territory
Polkadot price climbed 74% from September 29 to October 21 but slid into a consolidation soon after. In fact, the aforementioned rally seems to have set up multiple higher highs and higher lows that converged. Connecting trend lines to these swing points reveals a rising wedge pattern in play.
This technical formation forecasts a 32% downswing, determined by adding the distance between the first swing high and swing low to the breakout point. While the Polkadot price is still inside this setup, a decisive daily close below $42.50 will indicate a breakout.
In such a situation, the rising wedge forecasts a move to $28.89.
While the theoretical target is a little steep, the investors can watch the $38.77 and $33.42 support levels. If the selling pressure piles up, then market participants expect Polkadot price to hit its intended target.
Since the Polkadot price is just under its all-time high at $49.78, this drop would be a massive opportunity for long-term buyers to accumulate DOT at a discounted price. Therefore, the minor retracement is likely to be followed by a massive boost in buying pressure that allows DOT to slice through its all-time high and make a run at the 100% trend-based Fibonacci retracement level at $95. In some cases, Polkadot price could extend its run-up to hit the $100 psychological level.
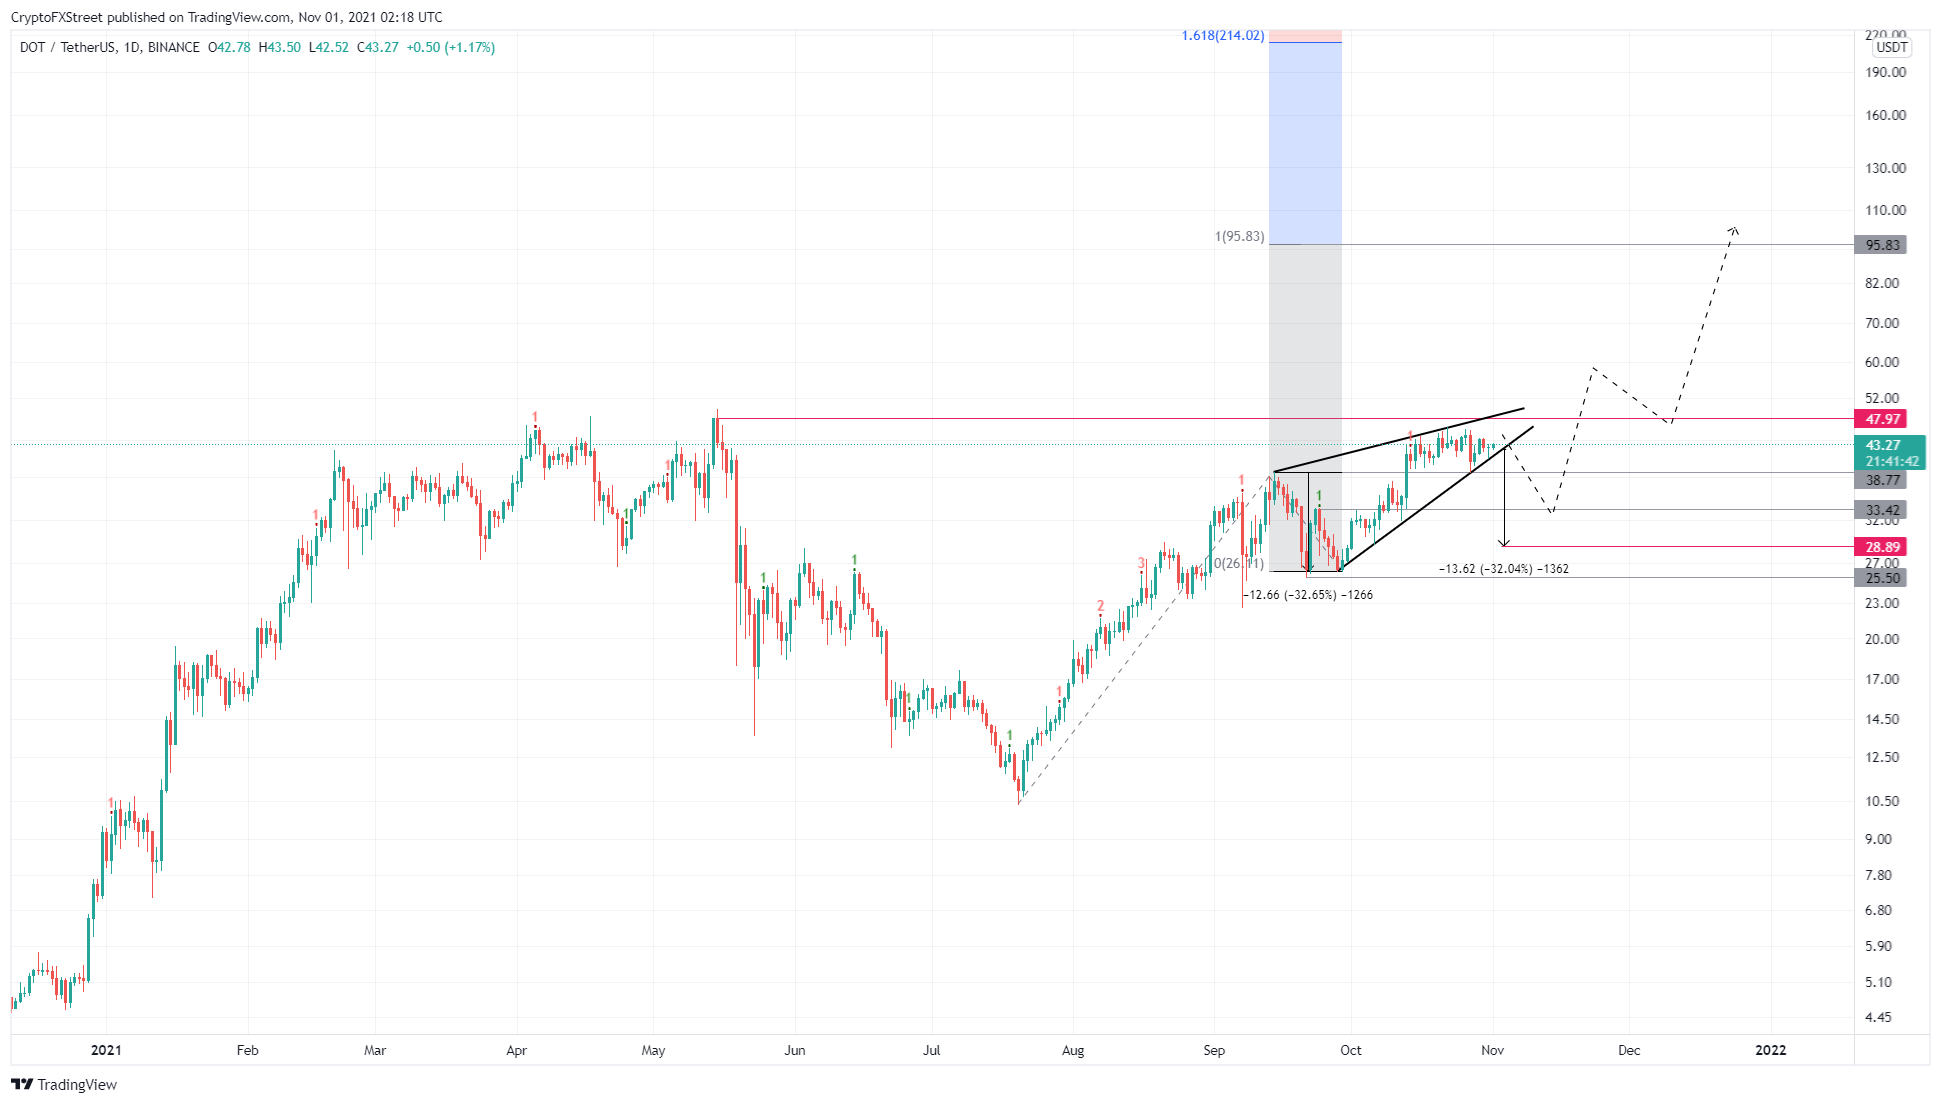
DOT/USDT 1-day chart
While things are looking a little on the edge for the Polkadot price, a breakdown of the $25.50 support level will shatter the double-bottom formation and create a lower low.
Although this move is bearish and looks to invalidate the bullish thesis, a quick recovery to produce a higher high will, however, alleviate this looming bearishness. A failure to do so might knock Polkadot price lower.
Author

Akash Girimath
FXStreet
Akash Girimath is a Mechanical Engineer interested in the chaos of the financial markets. Trying to make sense of this convoluted yet fascinating space, he switched his engineering job to become a crypto reporter and analyst.


