Top 3 Price Prediction Bitcoin, Ethereum, Ripple: Burden of proof still rests on the BTC bulls
- Bitcoin price has failed to capitalize on the bullish hammer candlestick plotted last week.
- Ethereum price holds the 2020 rising trend line, but price traction is fading as the week progresses.
- XRP price strikes heavy resistance at the weekly Anchored VWAP, putting $0.650 support back into play.

Resistance levels under the microscope this week as the cryptocurrency majors stumbled at established barriers. Bitcoin price retracted from crucial $35,500 level, Ethereum price stalled at the 50% Fibonacci retracement level at $2,237 and XRP price strength was paralyzed by the 200-day simple moving average (SMA) at $0.733. The constructive technical developments of last week have not released the momentum to confidently bust through higher resistance levels, putting attempts to disentangle from the recent churn on hold.
Bitcoin price fails to assemble a full band, loses bullish rhythm
Last week’s rebound from the dominant $30,000 price level was the third reminder over the previous six weeks of how vital the level is to Bitcoin’s outlook. The quickness of the rebound and solid weekly close communicated the presence and interest of prominent investors using the risk level to continue accumulating positions. Of course, the rebound involved retail investors, but only large investors can manifest significant outcomes like last week’s bullish hammer pattern.
The bullish close to last week generated a few pivotal moments, including the weekly hammer candlestick, a bullish momentum divergence on the daily Relative Strength Index (RSI), and a complete Elliot five wave down pattern. Adding to the credibility for the week is the Mayer multiple, a ratio of Bitcoin price to its 200-day SMA. It indicates that BTC is cheap relative to its long-term trend.
For sure, the weekly hammer candlestick pattern last week was an ideal conclusion for the volatile week, placing Bitcoin price above the strategically important 50-week SMA at $30,452. The hammer was triggered earlier this week with a trade and daily close above the hammer high of $35,741 on June 29. The bullish price action suggested a building momentum and pointed BTC towards the Anchored VWAP at $37,750 and the 50-day SMA at $38,220.
However, Bitcoin price has reversed the momentum over the last two days and knocked BTC below the hammer high and the noteworthy $35,500 price level, thereby putting bulls on the defensive once again and the flagship cryptocurrency in line for another test of $30,000.
At this point, Bitcoin price needs a daily close above the intersection of the Anchored VWAP with the 50-day SMA to reestablish a bullish trajectory for BTC.
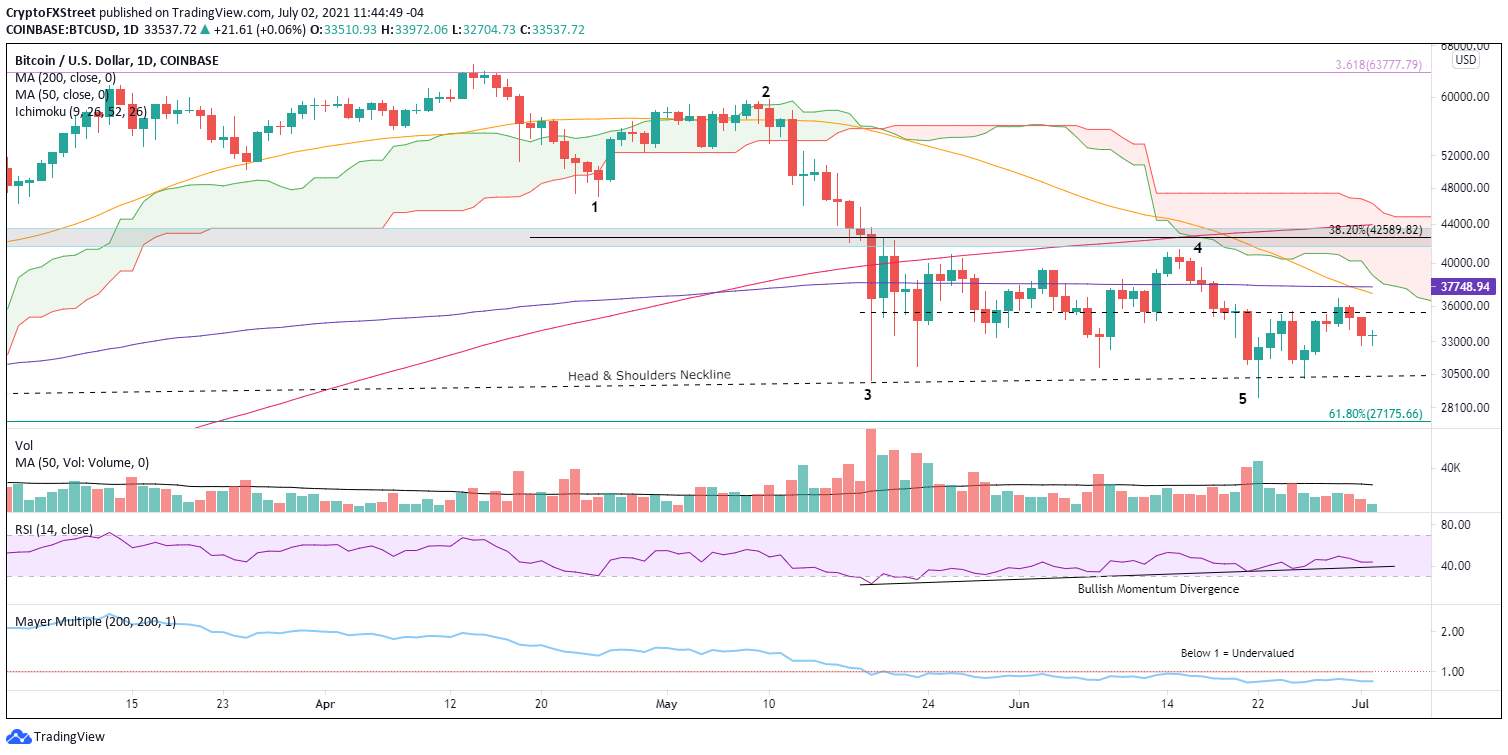
BTC/USD daily chart
A further divergence from the positive outlook is that Bitcoin price did trigger the neckline of a head-and-shoulders pattern on June 22. The pattern remains active until BTC trades above the right shoulder high of $41,332. Moreover, the digital asset did confirm a bearish Death Cross pattern on June 19 when the 50-day SMA crossed below the 200-day SMA.
As the probabilities swing from one direction to another, the burden of proof still rests on the bulls moving forward.
Ethereum price trend outperforms other majors, but resistance levels still enforcing ETH
The positive response of Ethereum price to the outstanding support framed by the 200-day SMA at $1,878, the 2020 rising trend line at $1,793, the 61.8% retracement of the March 2020-May 2021 advance at $1,730 and the May 23 low of $1,728 created a hint of optimism for enthusiastic ETH investors and short term speculators on June 22.
On June 28, Ethereum price closed above the February high of $2,041, enlisting the first positive step towards higher prices. The positive step was followed by another two strong days, including a daily close above the relevant 50% retracement level of the March 2020-May 2021 advance at $2,237 on June 30. At the close, it appeared that ETH had attracted the momentum to pursue a test of the 50-day SMA at $2,567 and eventually, the apex of the symmetrical triangle at $2,730 and the daily Ichimoku Cloud.
Yesterday’s 7% decline relinquished the 50% retracement level and pushed Ethereum price below the critical February high of $2,041 in early trading today. ETH is still up 6% for the week, but the setback complicates the near-term price structure and the resulting forecast direction.
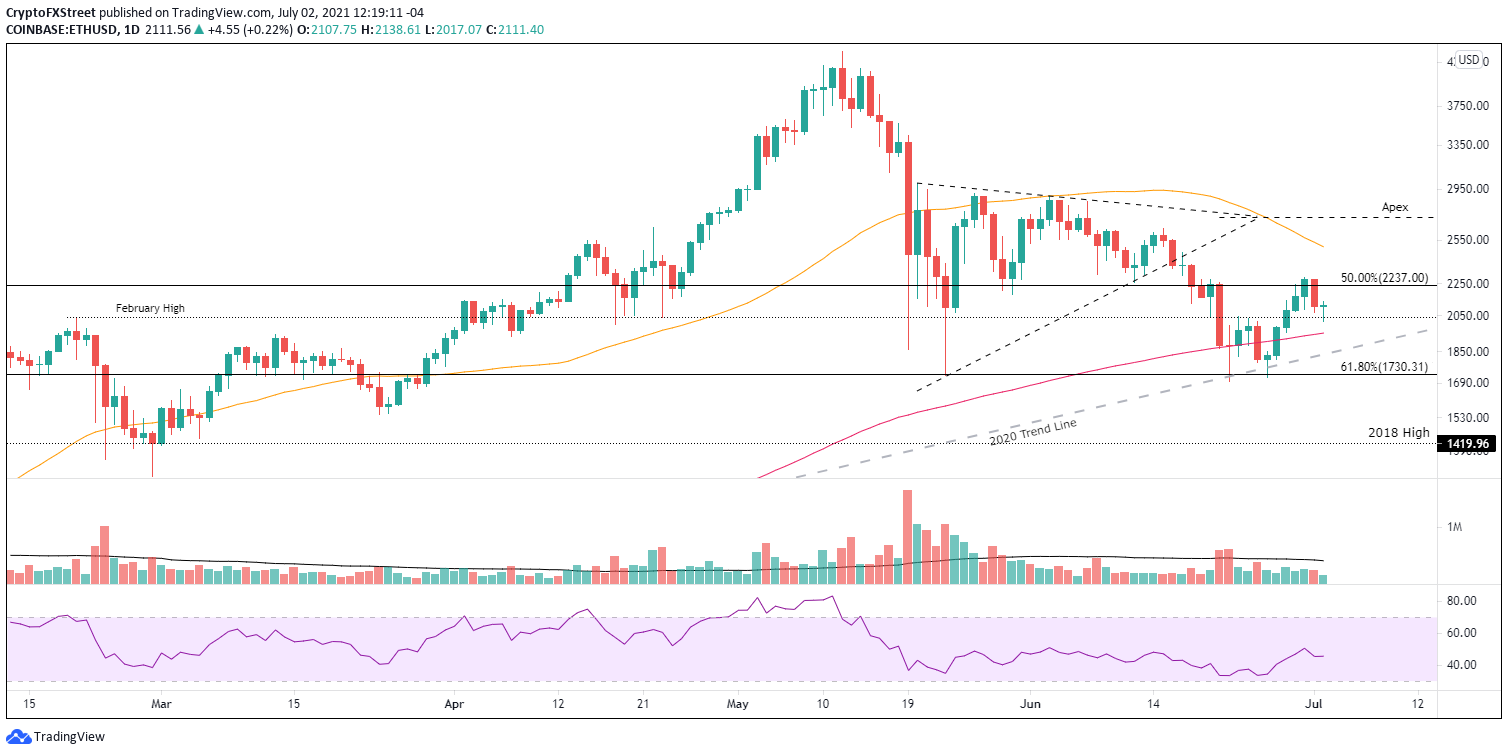
ETH/USD daily chart
If Ethereum price closes below the 2020 rising trend line at $1,831 and the 61.8% retracement level of the March 2020-May 2021 advance at $1,730, ETH may explore the support established by the 2018 high at $1,419, yielding a 33% decline from the current price.
Similar to Bitcoin price, ETH bull’s extraordinary claims still require extraordinary evidence to materialize in a cryptocurrency complex wrapped in indecision.
XRP price caught between a rock and a hard place
To review, at the June 22 low XRP price had declined 70% and a remarkable 50% from the June 1 high, liquidating the May 23 low of $0.652, a level fortified by weekly highs in late 2020 and February 2021. Nonetheless, Ripple realized three important technical milestones that provoked a 45% rebound into June 29: a test of the 78.6% retracement of the December 2020-April 2021 advance at $0.555, an undercut of the 50-week SMA at $0.540 and registered an oversold reading on the daily RSI for the first time since late December 2020.
The 45% rebound was noteworthy, but it lacked the impulsiveness that characterizes meaningful bottoms and the momentum to enable XRP price to conquer the massive resistance around $0.740-$0.760. The result was a bear flag formation triggering yesterday, quickly putting the support level of $0.650 in play. Ripple is trying to hold the level today.
The Ripple bear flag formation’s measured move is approximately 36%, suggesting XRP price will defeat the 78.6% retracement level of $0.555 and the June 22 low of $0.512 before bottoming around the measured move target $0.437.
It is important to note that XRP price has no support of significance below the measure move target, amplifying the pressure on bullish Ripple speculators.
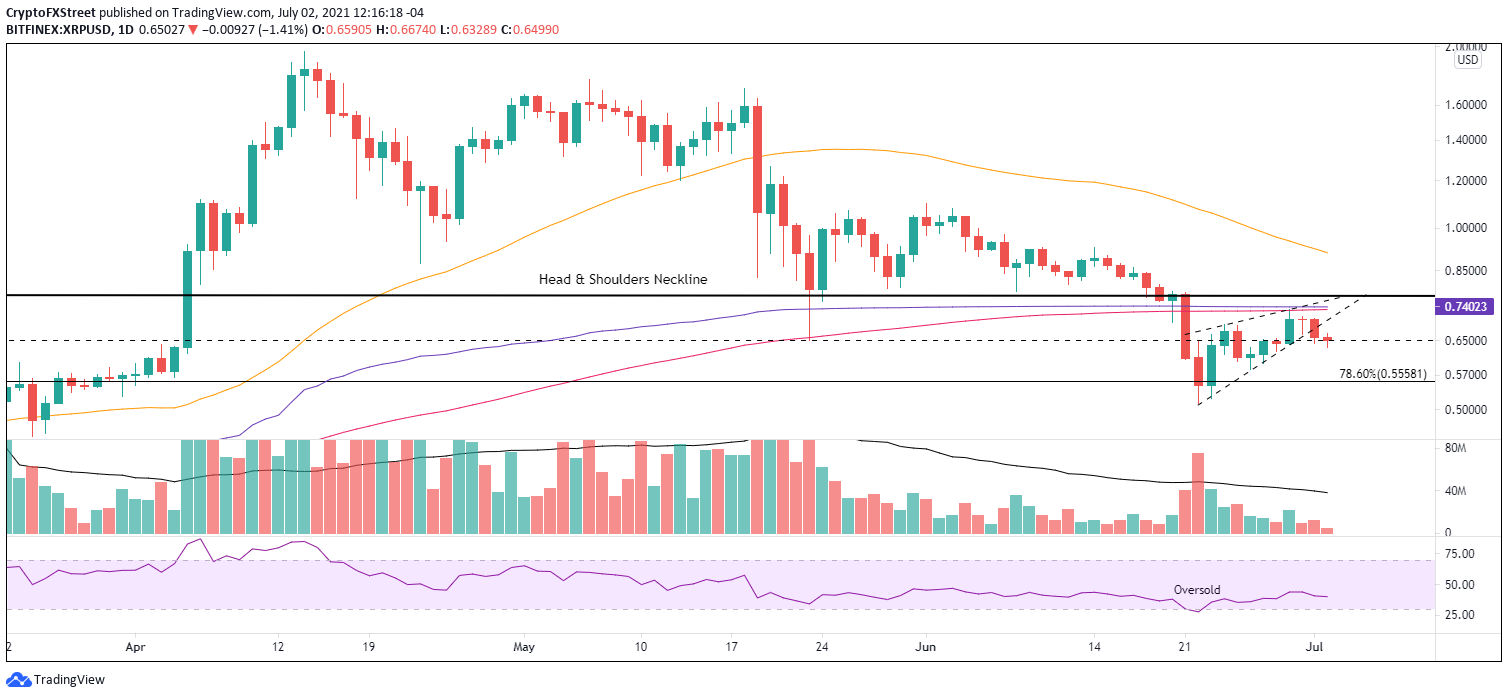
XRP/USD daily chart
The bearish Ripple narrative is persuasive at this point, and only a daily close above $0.760, the neckline of a multi-year inverse head-and-shoulders pattern, would alter the outlook.
One possible scenario is for XRP price to fall into a trading range between $0.555 and $0.760, thereby creating ideal trading conditions for swing traders due to the hulking support and resistance levels and the resulting 30-40% profit opportunities that lie between. However, for long-term investors, Ripple is dead money under $0.760
Here, FXStreet's analysts evaluate where Ripple could be heading next with a brief technical and on-chain analysis on XRP price.
Author

Sheldon McIntyre, CMT
Independent Analyst
Sheldon has 24 years of investment experience holding various positions in companies based in the United States and Chile. His core competencies include BRIC and G-10 equity markets, swing and position trading and technical analysis.


