Pi Network Price Analysis: PI token rises as CEX withdrawals signal bullish demand
- Pi Network’s PI token edges higher following the 4.92% rise from Wednesday.
- A significant outflow from CEXs’ wallet balances signals increased withdrawals over the last 24 hours.
- The technical outlook suggests a bullish bias as RSI divergence pairs up with a potential double bottom pattern.

Pi Network (PI) trades at $0.3653 at press time on Thursday, retracing from the $0.3747 high. The technical and exchange reserves indicate a bullish bias, with an RSI divergence, a double bottom pattern, and a sharp outflow from the Centralized Exchanges (CEXs) wallet balances, pointing to increased demand.
PI demand surges ahead of Hackathon 2025
PiScan data shows the CEXs’ wallet balances recording an outflow of 5.14 million PI tokens in the last 24 hours, dropping the reserve to 409.55 million tokens. This massive withdrawal accounts for a 1.24% decrease in CEX's balances, indicating a surge in demand among investors, is likely driven by the start of the Pi Hackathon 2025, the ecosystem's first hackathon after the launch of Open Network.
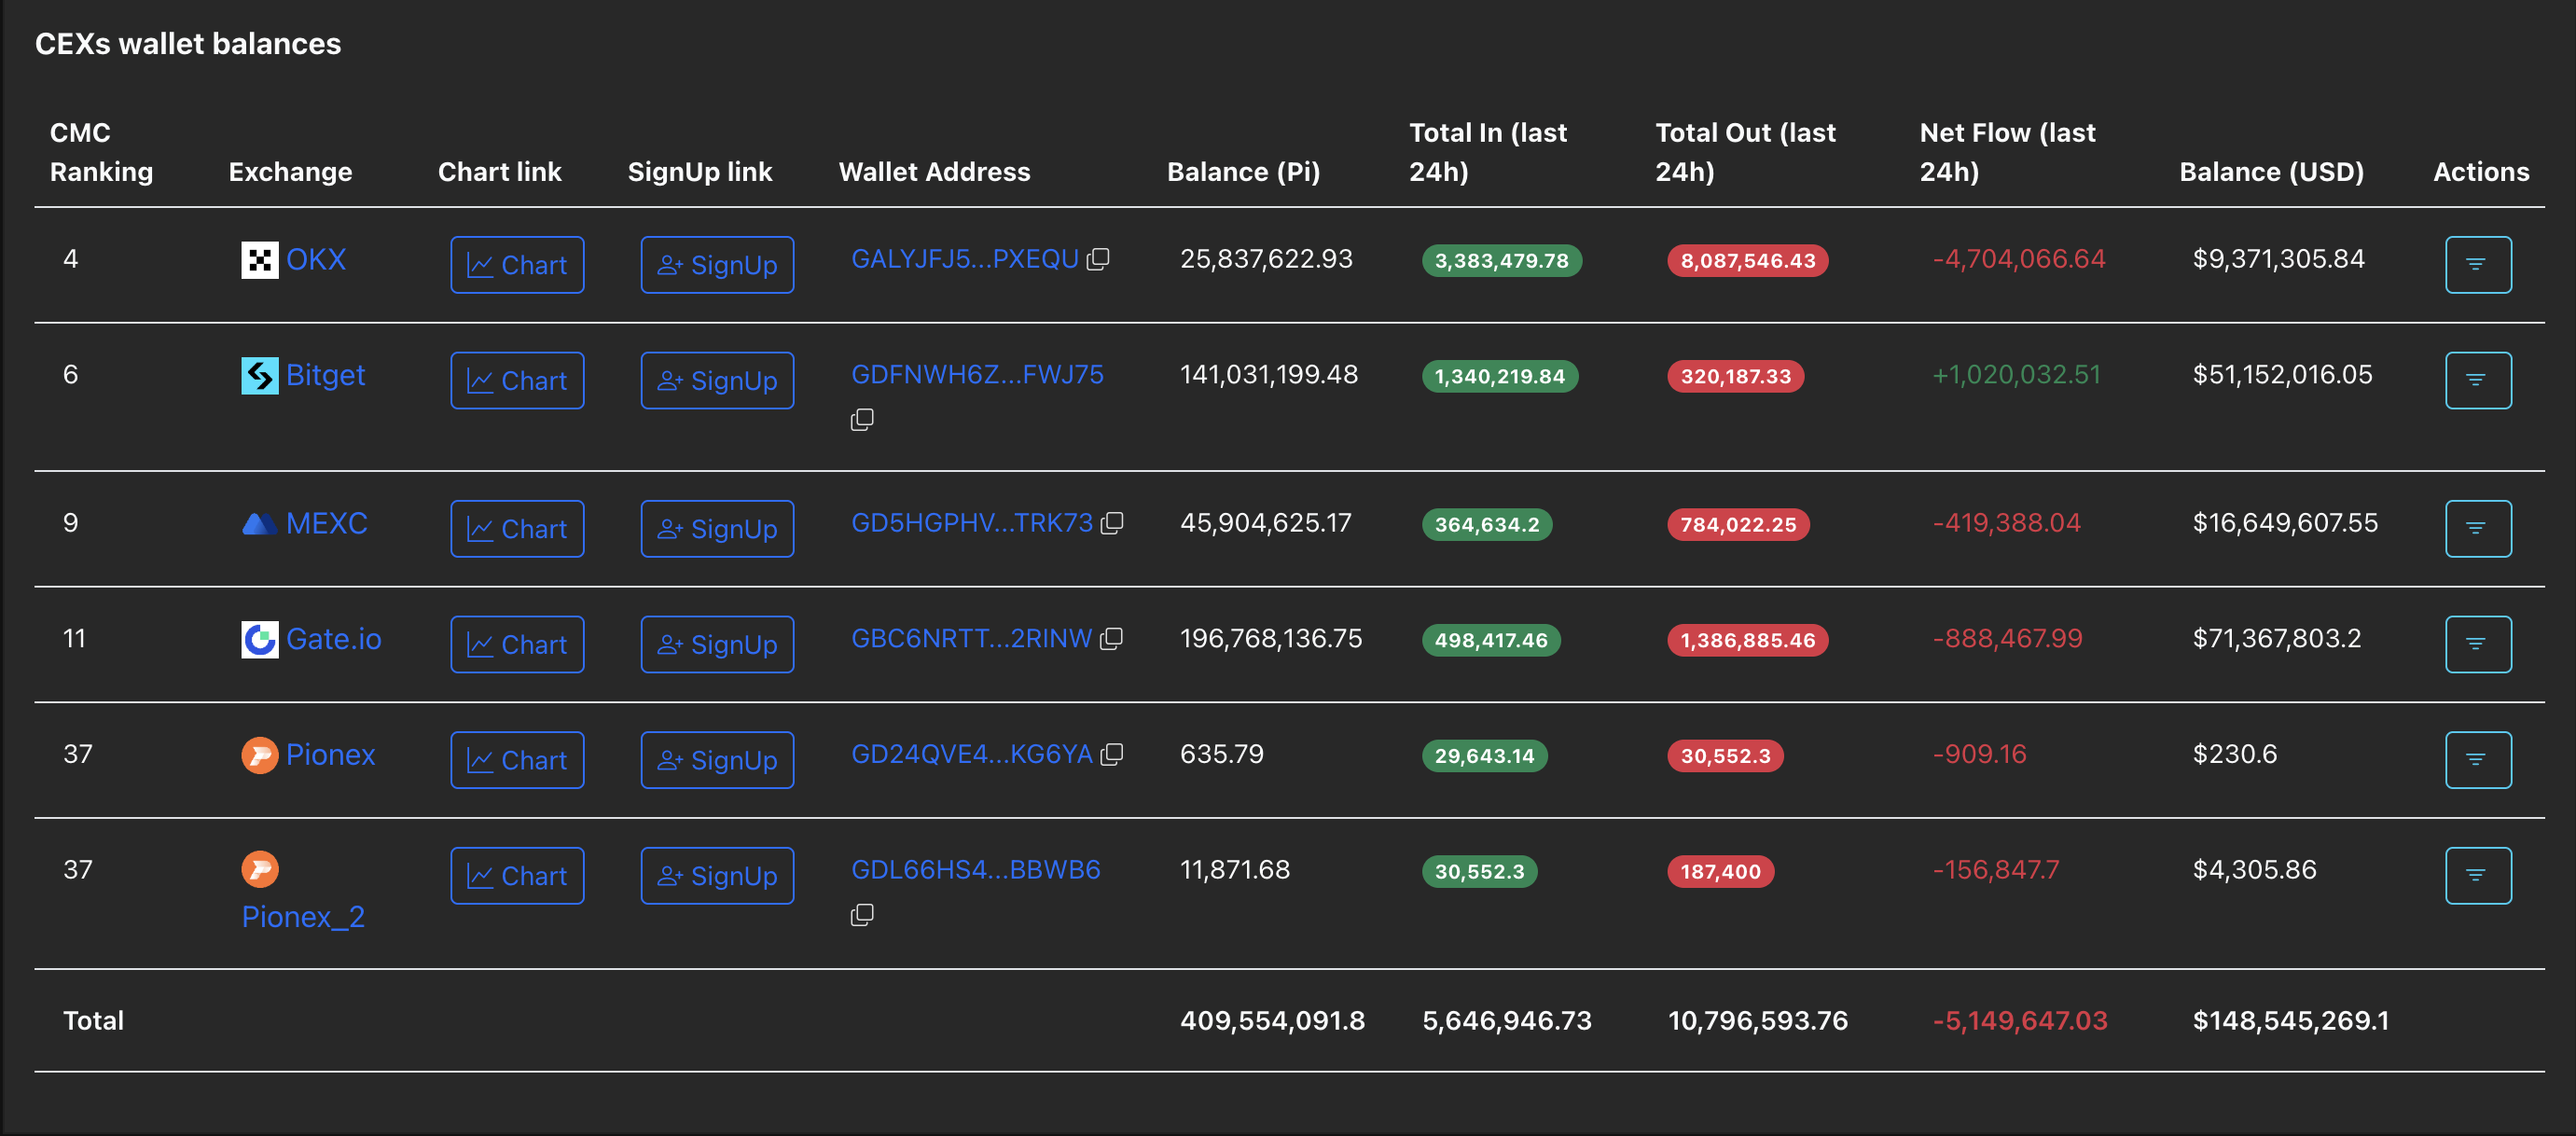
CEXs' wallet balances. Source: Coinglass
Pi Network eyes breaking out of a rising channel
Pi Network’s PI token edges higher by nearly 1.50% at press time on Thursday, extending the 4.92% rise from Wednesday. The reversal from the $0.3442 support level hints at a double bottom pattern reversal, previously tested on August 6, targeting the 50-day Exponential Moving Average (EMA) at $0.4319.
The declining average line aligns with the resistance trendline of a falling channel pattern, as marked on the daily chart (shared below). A decisive close above this level could reinforce a potential bullish trend, targeting the $0.5000 psychological level.
The Relative Strength Index (RSI) reads 42 on the daily chart, inching closer to the halfway line as buying pressure recovers. Additionally, the RSI has significantly recovered compared to the previous dip at $0.3442 level, indicating a bullish divergence.
Still, the Moving Average Convergence Divergence (MACD) and its signal line have merged and moved sideways, signaling a loss in decisive trend momentum.
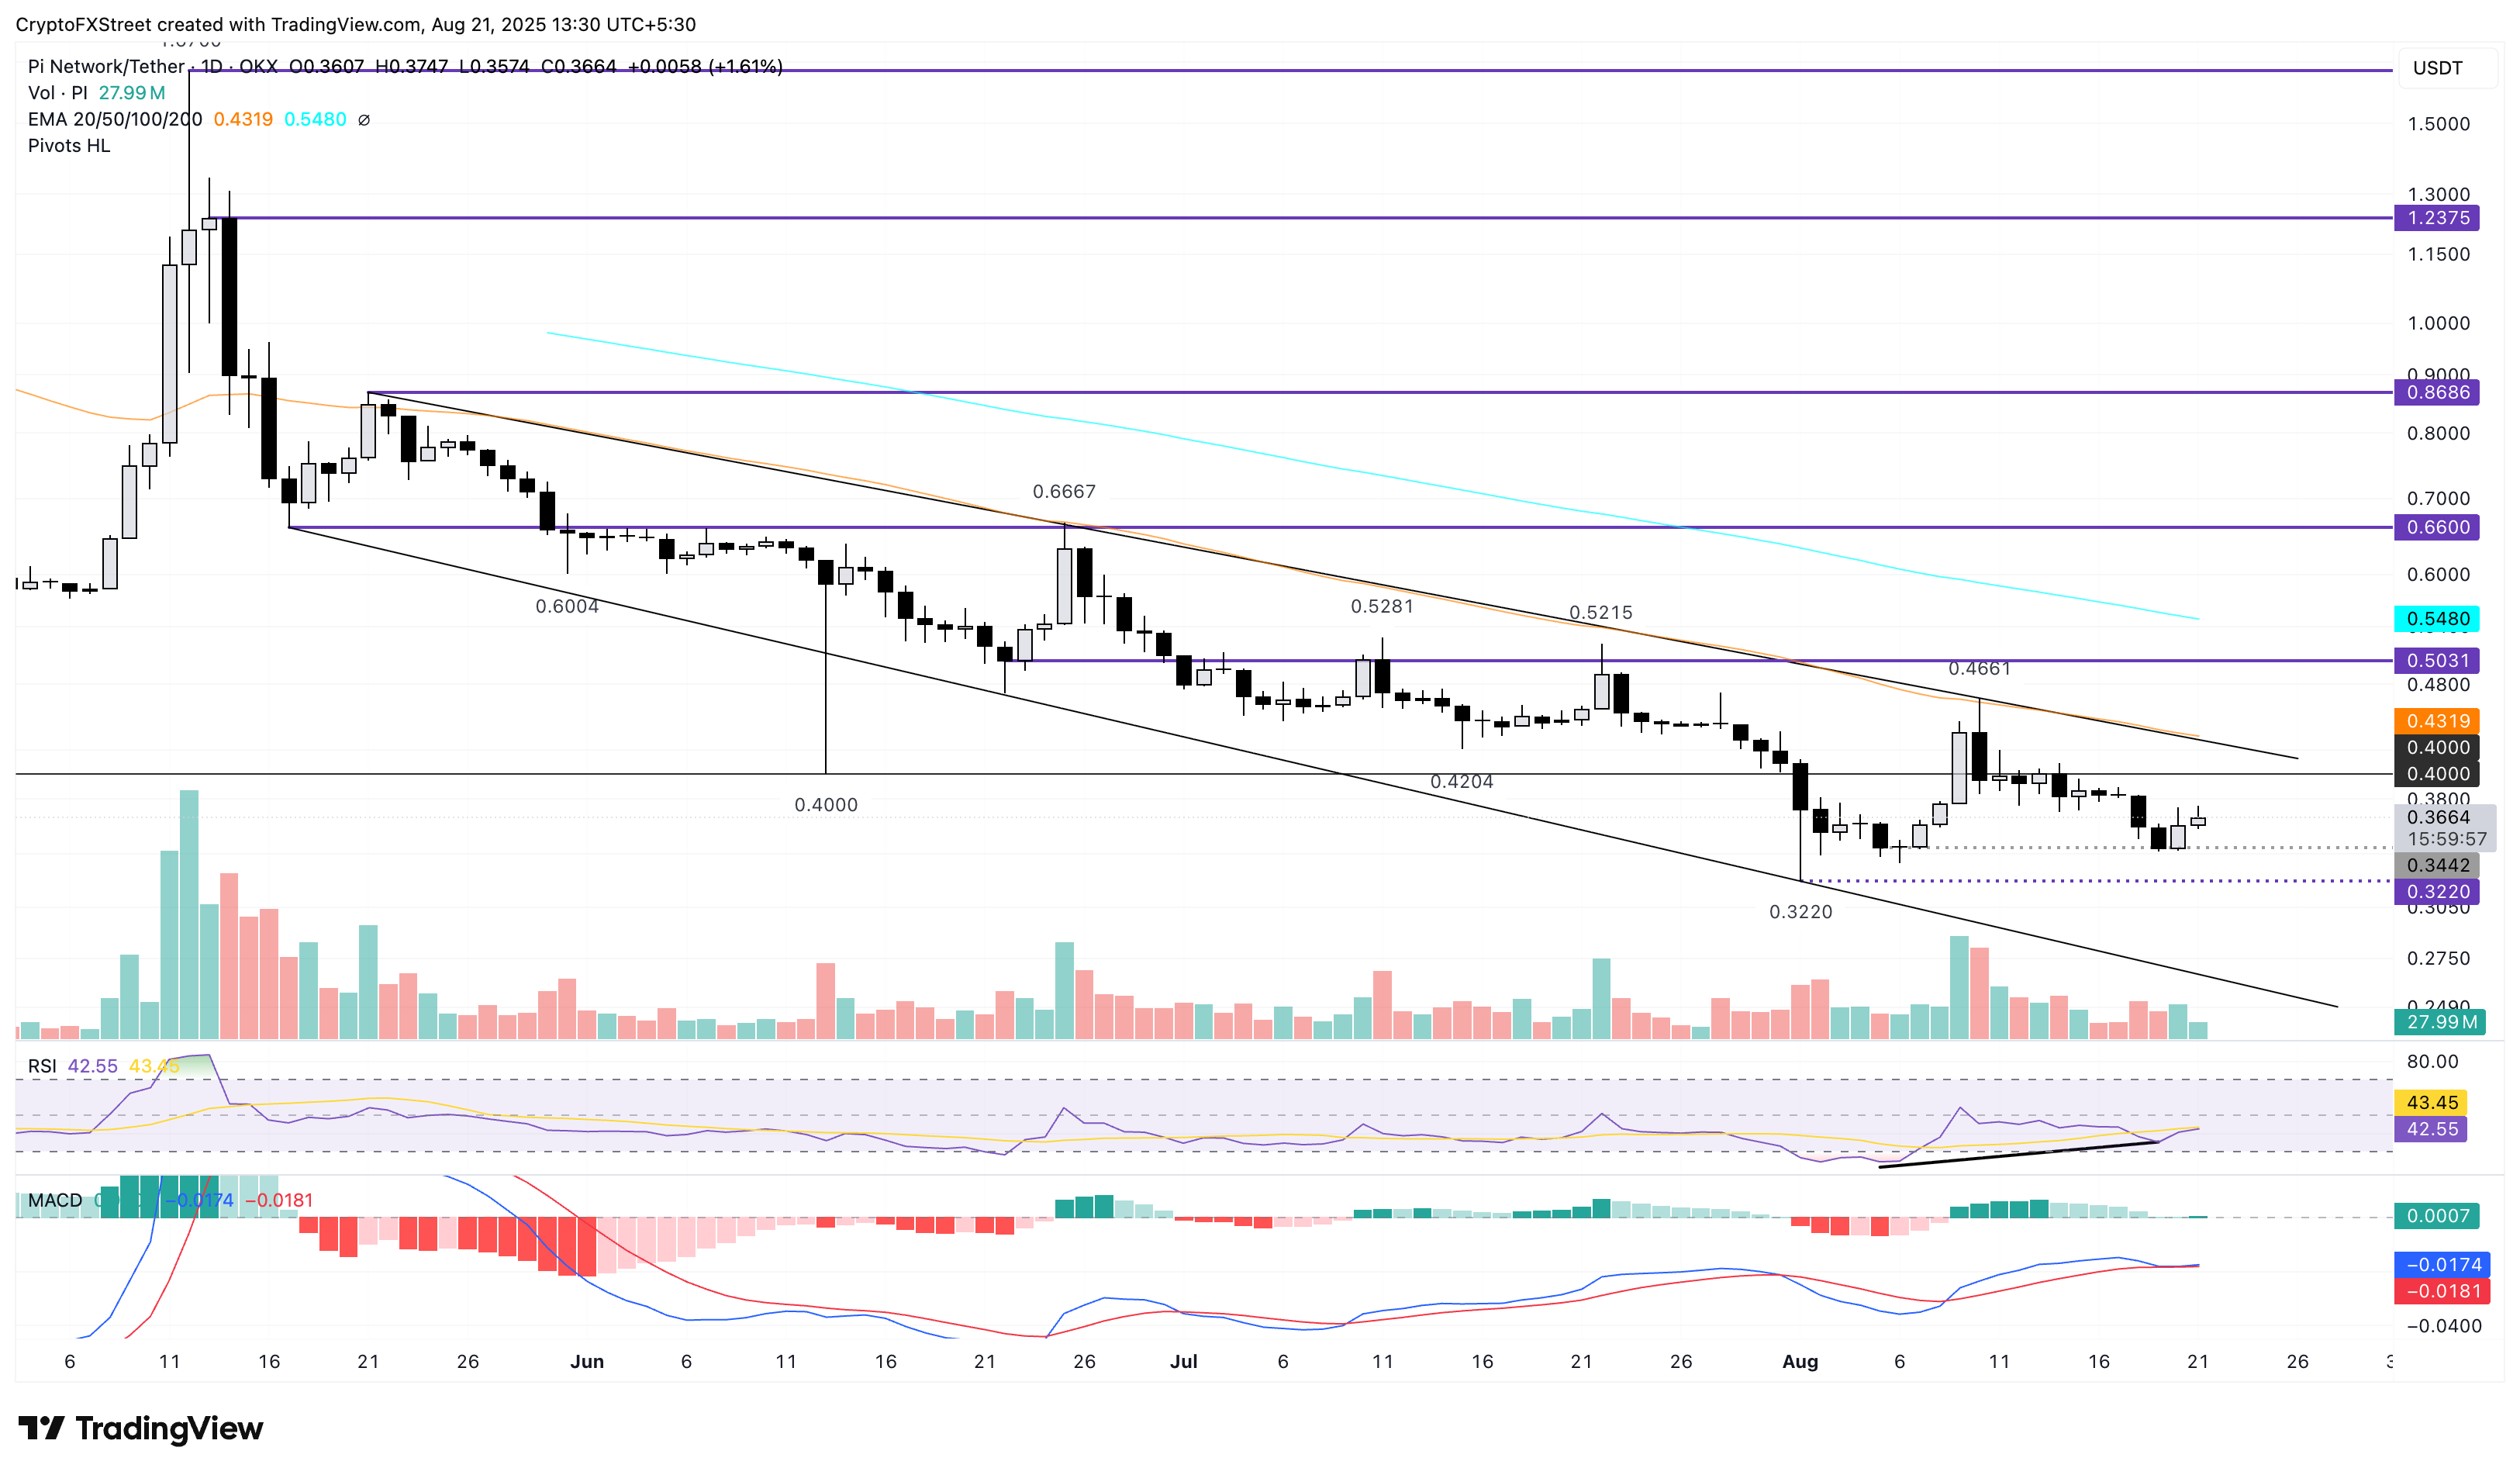
PI/USDT daily price chart.
On the contrary, a reversal below the $0.3442 support level would invalidate the double bottom reversal pattern, increasing the risk of the $0.3220 support level, which aligns with the all-time low.
Open Interest, funding rate FAQs
Higher Open Interest is associated with higher liquidity and new capital inflow to the market. This is considered the equivalent of increase in efficiency and the ongoing trend continues. When Open Interest decreases, it is considered a sign of liquidation in the market, investors are leaving and the overall demand for an asset is on a decline, fueling a bearish sentiment among investors.
Funding fees bridge the difference between spot prices and prices of futures contracts of an asset by increasing liquidation risks faced by traders. A consistently high and positive funding rate implies there is a bullish sentiment among market participants and there is an expectation of a price hike. A consistently negative funding rate for an asset implies a bearish sentiment, indicating that traders expect the cryptocurrency’s price to fall and a bearish trend reversal is likely to occur.
Author

Vishal Dixit
FXStreet
Vishal Dixit holds a B.Sc. in Chemistry from Wilson College but found his true calling in the world of crypto.


