Pi Network Price Forecast: PI eyes further gains as mainnet migration gains traction
- Pi Network faces opposition at the 50-period EMA on the 4-hour chart after a descending triangle pattern breakout.
- Around 2.70 million Pioneers have migrated to the mainnet, out of the 3.36 million users who recently completed KYC verification.
- CEXS outflows of over 1.17 million PI suggest an increase in on-exchange demand.

Pi Network (PI) steadies on Friday near the critical 50-period Exponential Moving Average (EMA) on the 4-hour chart, after surpassing a local resistance trendline. The breakout move aligns with the announcement of 2.70 million Pi Network users, also called Pioneers, migrating to the mainnet. With optimism surrounding Pi Network, outflows from Centralized Exchanges (CEXs) wallets have surpassed 1.17 million PI in the last 24 hours, suggesting a surge in demand.
Pi Network migration boosts demand among users
Pi Network announced successful Know Your Customer (KYC) verification of 3.36 million additional Pioneers, resulting in a near 3% jump in PI token on Thursday. KYC verification allows Pioneers to transfer PI tokens from testnet to mainnet, and aligns with the network’s aim to build an inclusive community of real individuals. Of the 3.36 million KYC-verified users, 2.69 million have migrated to the mainnet.
Apart from these verified users, an additional 3 million users are in the tentative KYC group and might receive a camera‑based face verification request before the final mainnet check.
The surge in Pi Network mainnet users, with an additional 3 million Pioneers in line, could accelerate the network's adoption and utility.
On the other hand, demand for the PI token has increased significantly over the last 24 hours. PiScan data shows that four of the largest transactions on the network were withdrawals of over 400,000 from the OKX exchange. Meanwhile, the total outflow from CEXs' wallet balances amounted to 1.17 million PI tokens. A surge in outflows from exchanges reduces supply pressure, increasing the upside potential.
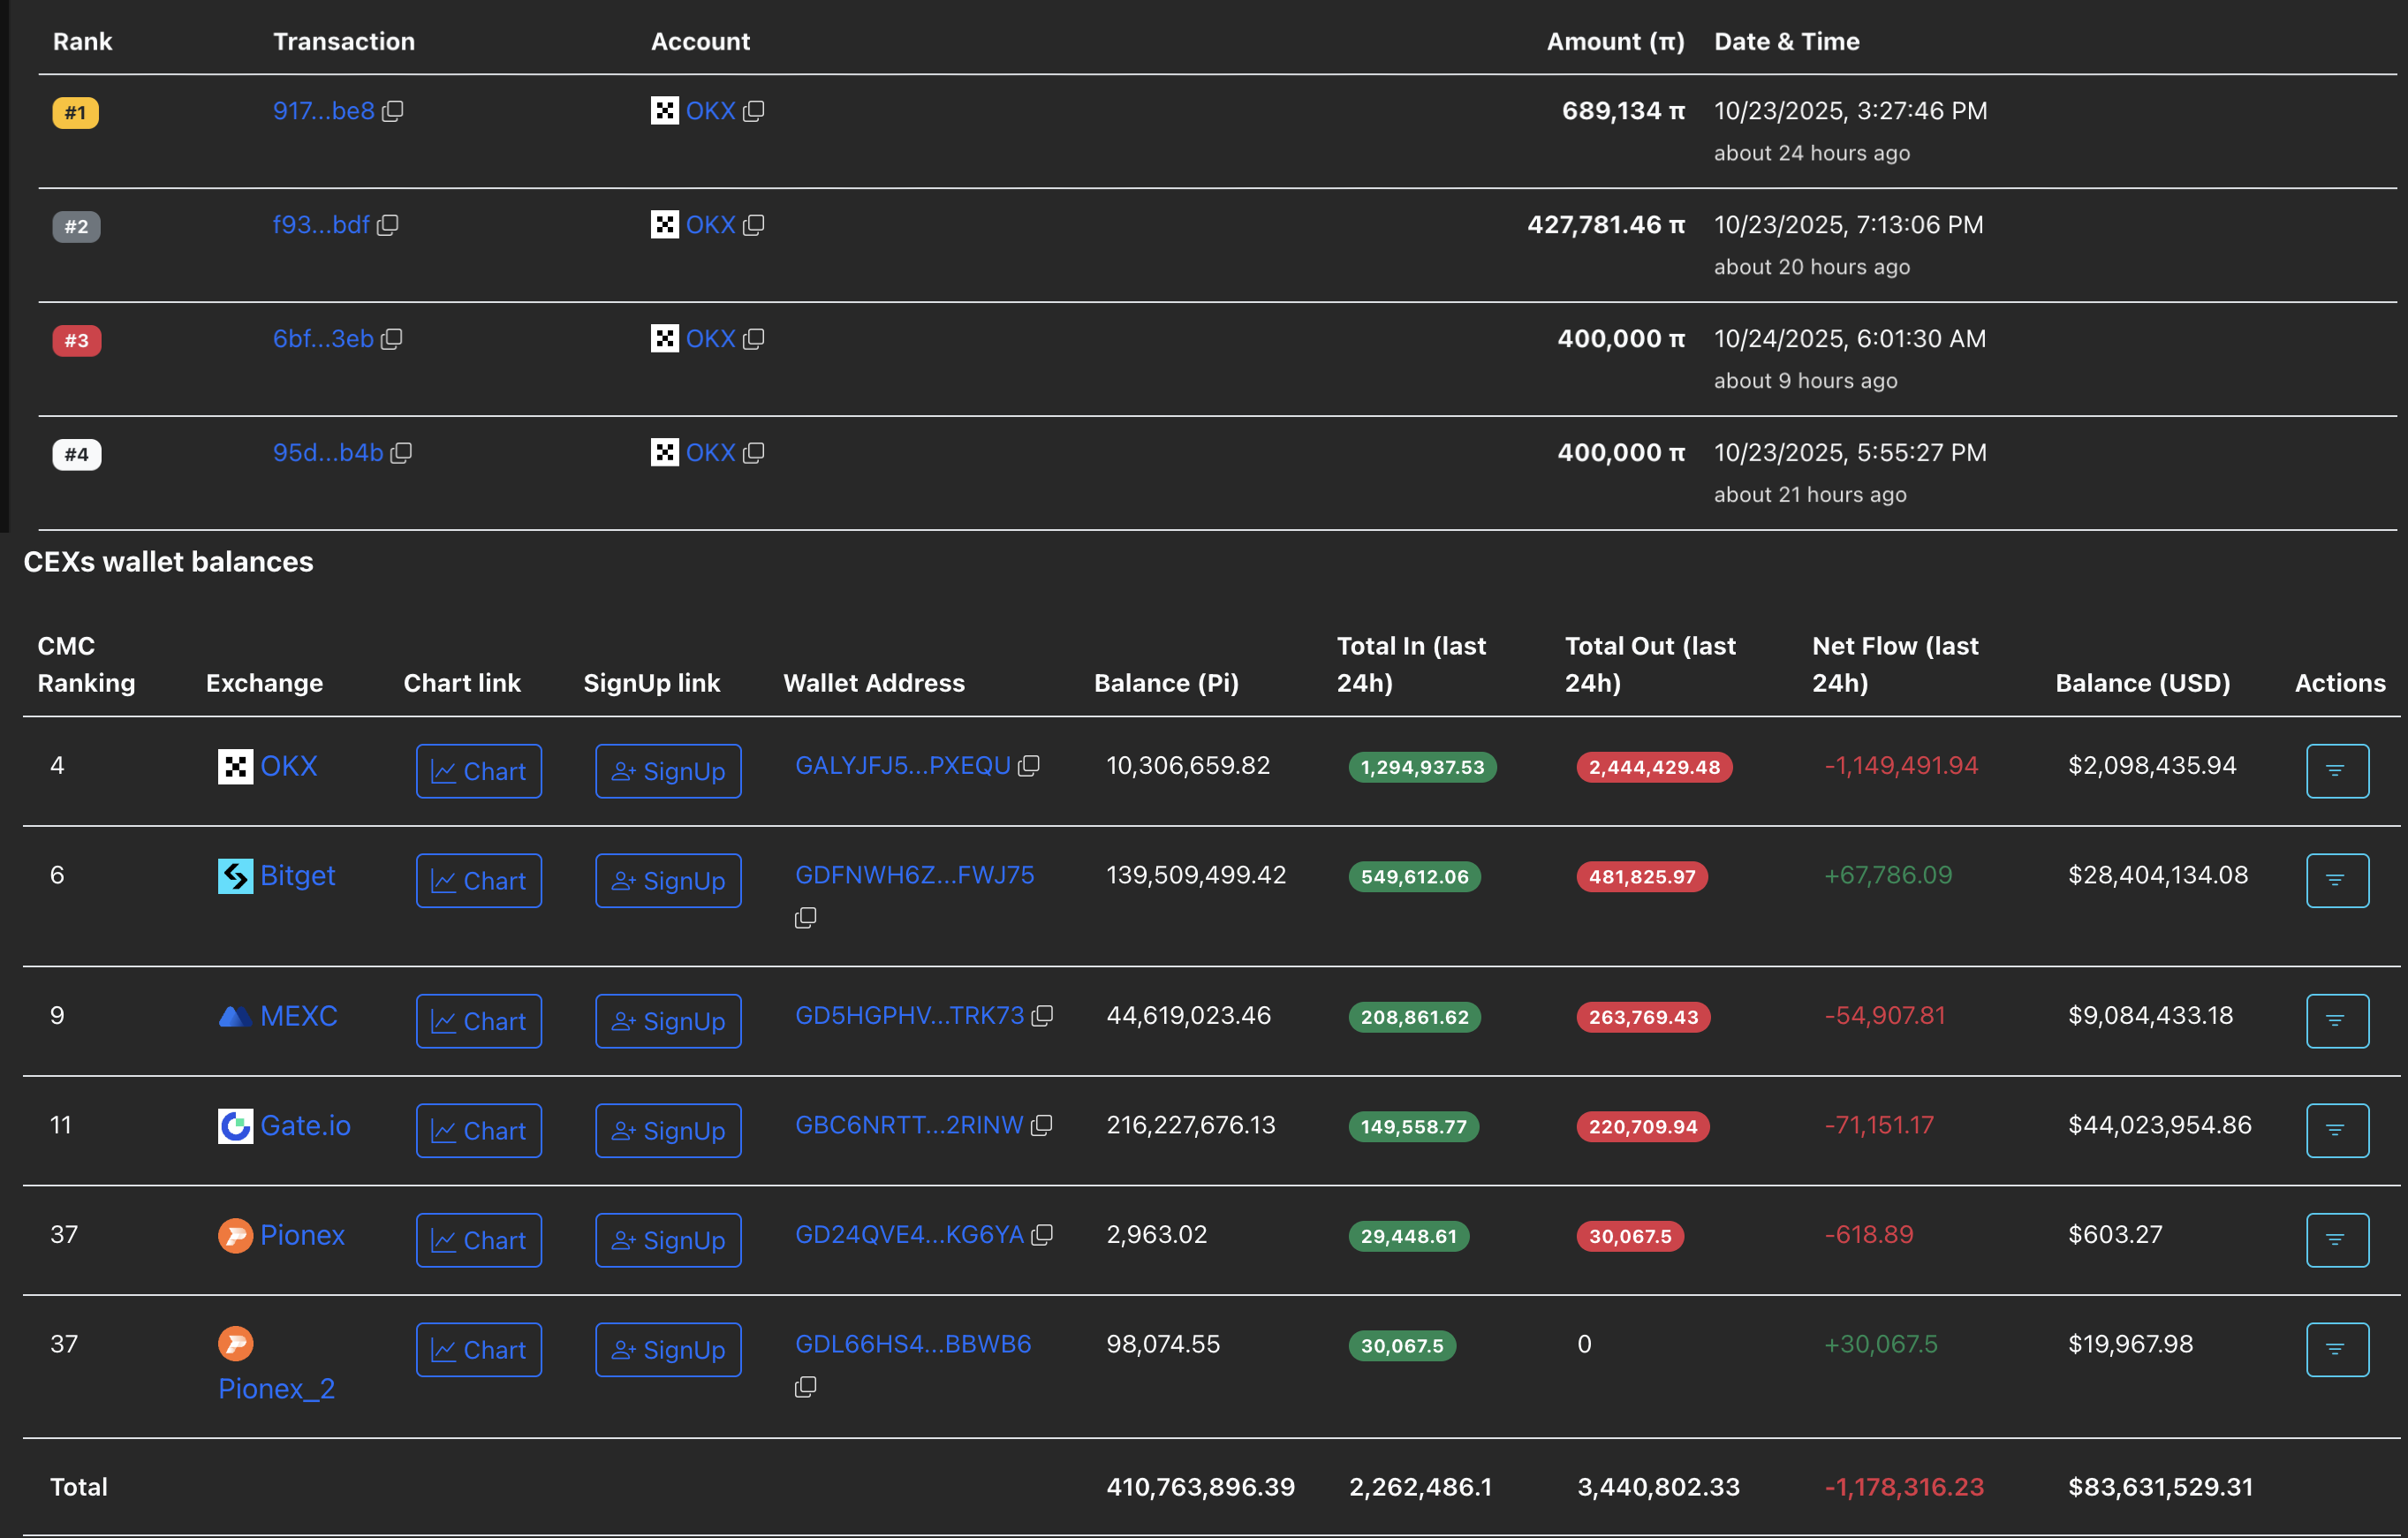
CEXs wallet balances. Source: PiScan
Pi Network’s breakout rally faces multiple resistances
Pi Network exceeds a local resistance trendline, confirming the breakout of a descending triangle pattern on the 4-hour chart. Still, the mobile mining cryptocurrency is facing resistance from the 50-period EMA at $0.2062, struggling to extend its breakout rally.
Nevertheless, a decisive close above this dynamic resistance would experience resistance at the Pivot Point at $0.2086, followed by the R1 Pivot Point at $0.2249.
Technical indicators on the 4-hour chart signal a bullish shift as the Moving Average Convergence Divergence (MACD) rises towards the zero line, after crossing above the signal line. At the same time, the Relative Strength Index (RSI) at 50 is neutral, bouncing off the oversold zone, indicating fading bearish pressure.
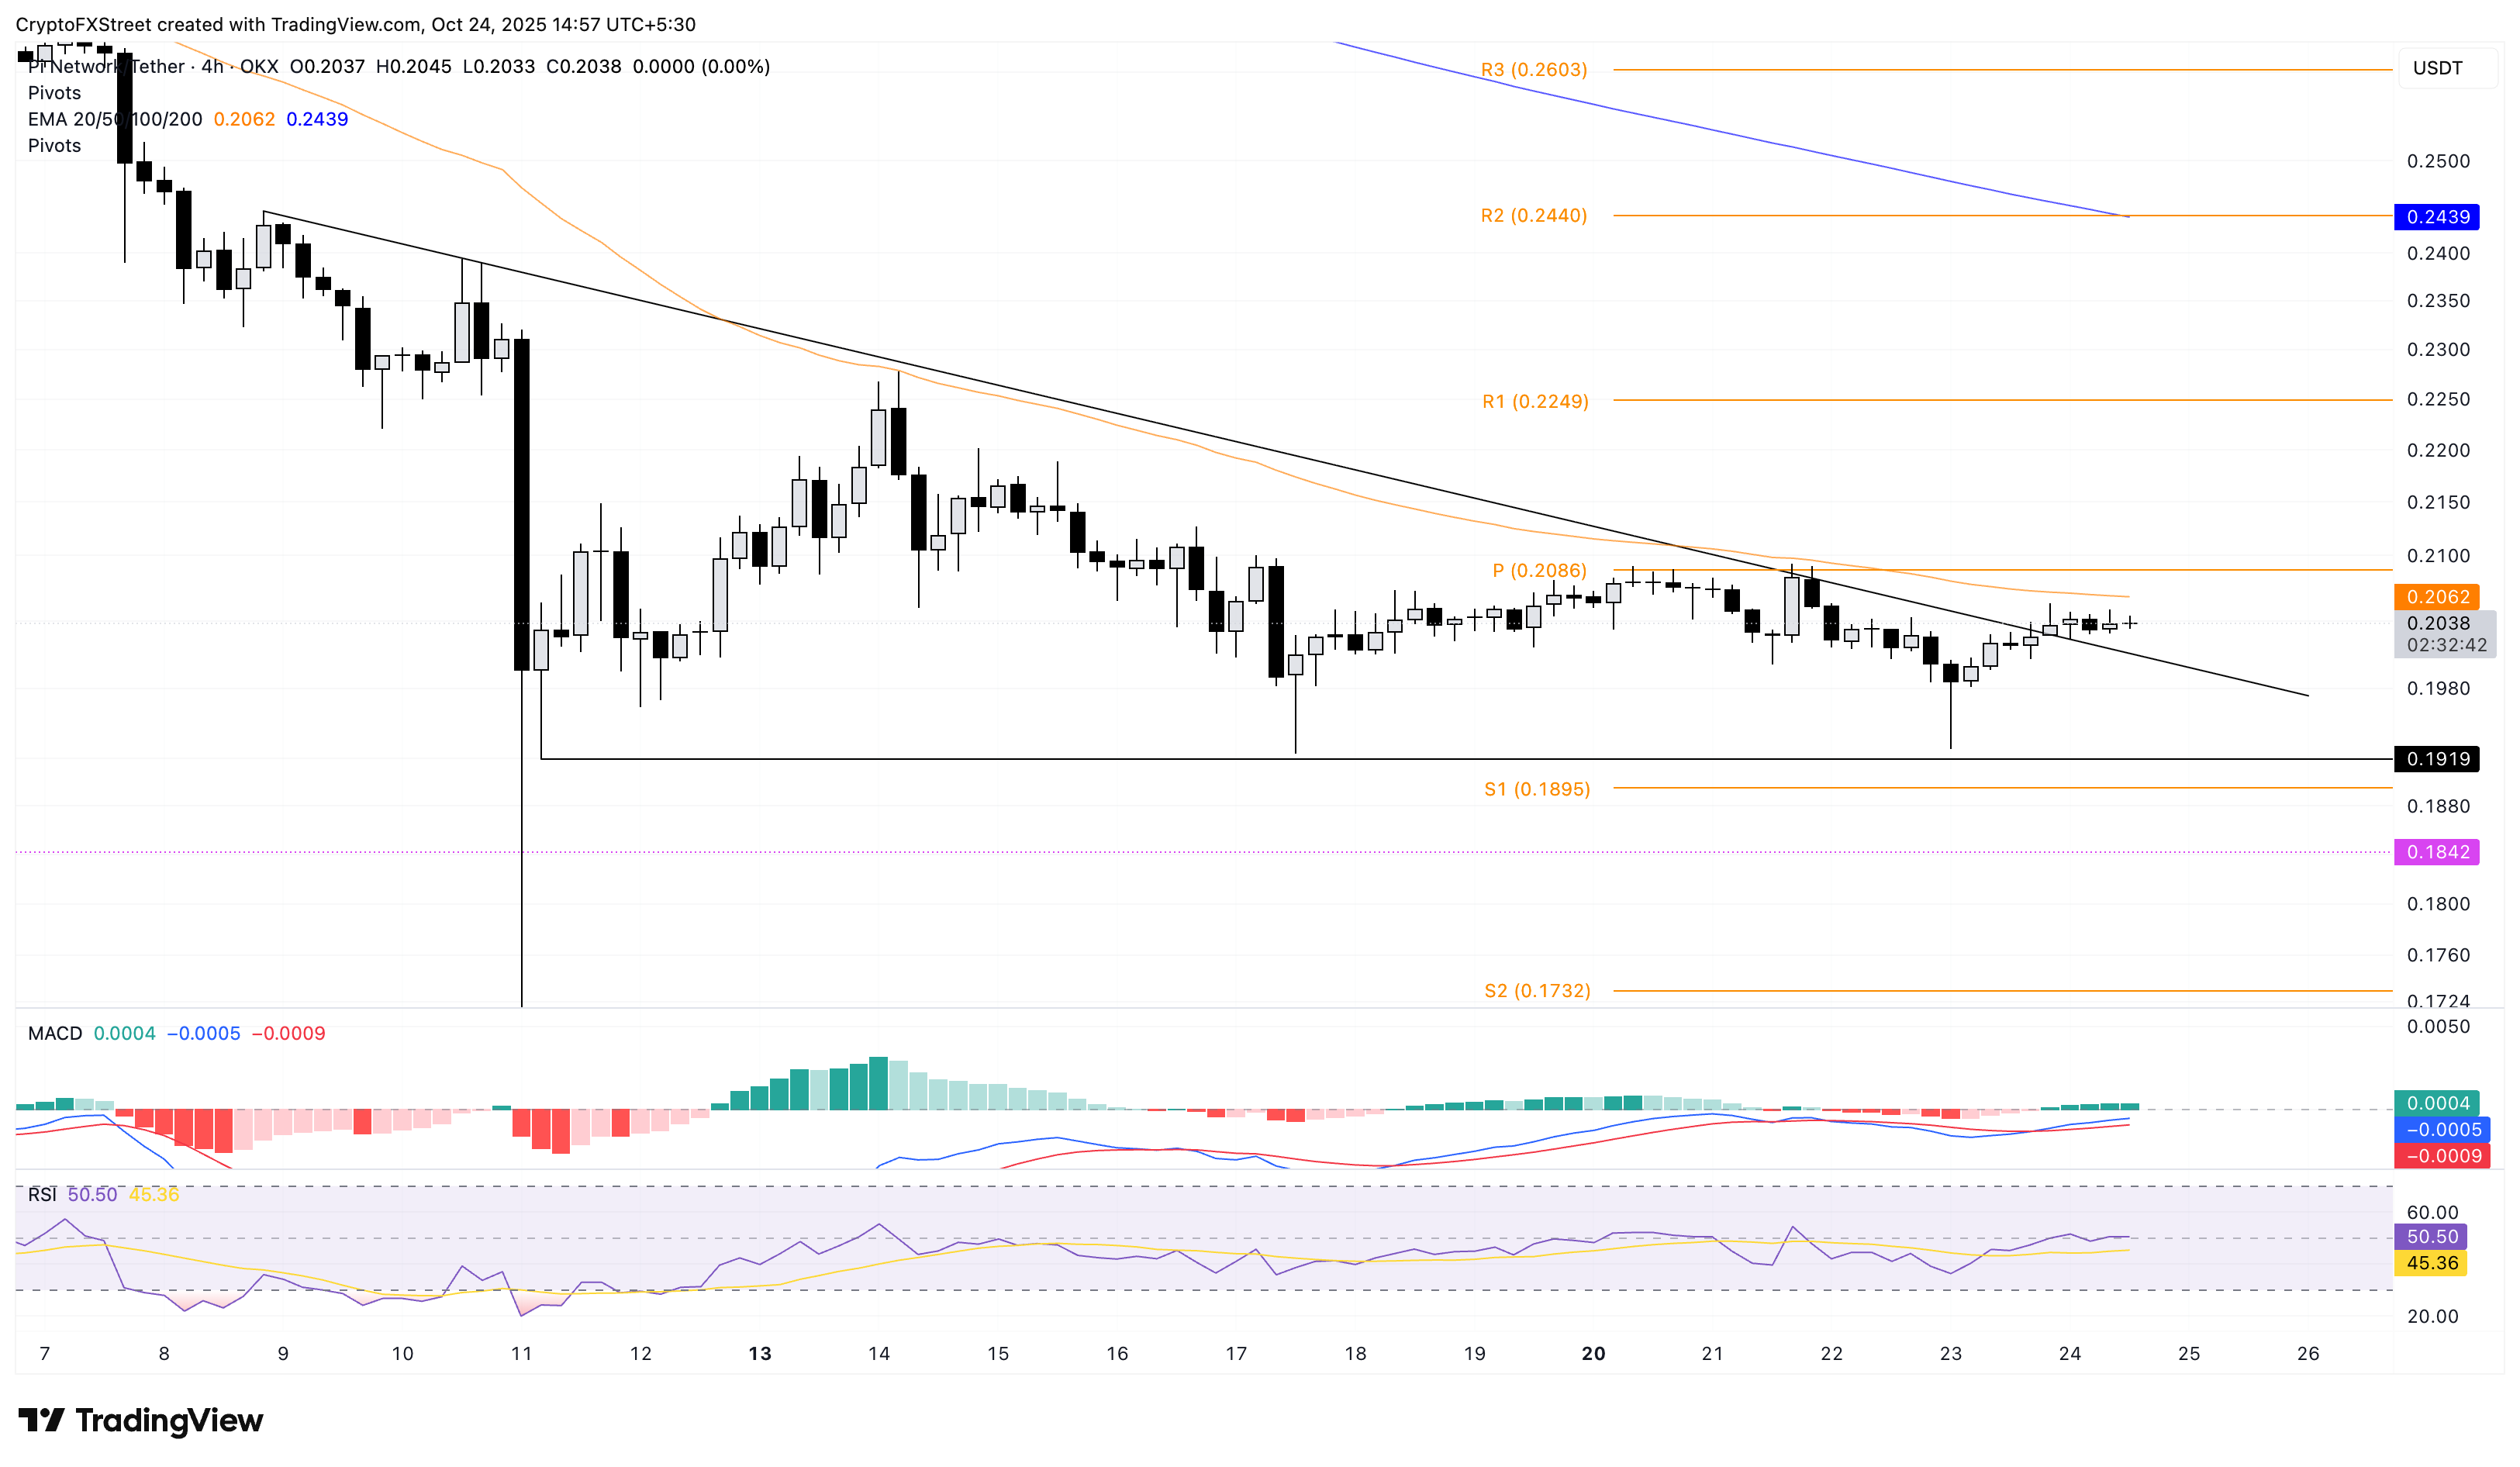
PI/USDT 4-hour price chart.
Looking down, a reversal from the 50-period EMA could retest the $0.1919 support level, marked by a 4-hour candle low on October 11, nullifying the breakout rally.
Cryptocurrency prices FAQs
Token launches influence demand and adoption among market participants. Listings on crypto exchanges deepen the liquidity for an asset and add new participants to an asset’s network. This is typically bullish for a digital asset.
A hack is an event in which an attacker captures a large volume of the asset from a DeFi bridge or hot wallet of an exchange or any other crypto platform via exploits, bugs or other methods. The exploiter then transfers these tokens out of the exchange platforms to ultimately sell or swap the assets for other cryptocurrencies or stablecoins. Such events often involve an en masse panic triggering a sell-off in the affected assets.
Macroeconomic events like the US Federal Reserve’s decision on interest rates influence crypto assets mainly through the direct impact they have on the US Dollar. An increase in interest rate typically negatively influences Bitcoin and altcoin prices, and vice versa. If the US Dollar index declines, risk assets and associated leverage for trading gets cheaper, in turn driving crypto prices higher.
Halvings are typically considered bullish events as they slash the block reward in half for miners, constricting the supply of the asset. At consistent demand if the supply reduces, the asset’s price climbs.
Author

Vishal Dixit
FXStreet
Vishal Dixit holds a B.Sc. in Chemistry from Wilson College but found his true calling in the world of crypto.



