Pi Network Price Forecast: 19.2 million PI token unlock fear could boost bearish momentum
- Pi Network ticks higher after six consecutive bearish days, trades below $0.50.
- The AI-powered Pi App Studio release on Pi2Day fails to boost bullish sentiment.
- Pi Scan data shows 19.2 million tokens to be unlocked in July, potentially increasing a supply dump risk.

Pi Network (PI) recovers by 1% at press time on Wednesday after six consecutive bearish candles. The technical outlook indicates a bearish inclination in the days leading up to July’s biggest token unlock, while sentiments remain muted following the Pi2Day announcements.
Pi Network’s largest token unlock in July
PiScan data shows that 19.2 million PI tokens are set to be unlocked on July 4, marking the largest unlock of the month. Typically, token unlocks boost the available supply in the market, increasing the risk of a potential sell-off in the days after the event.
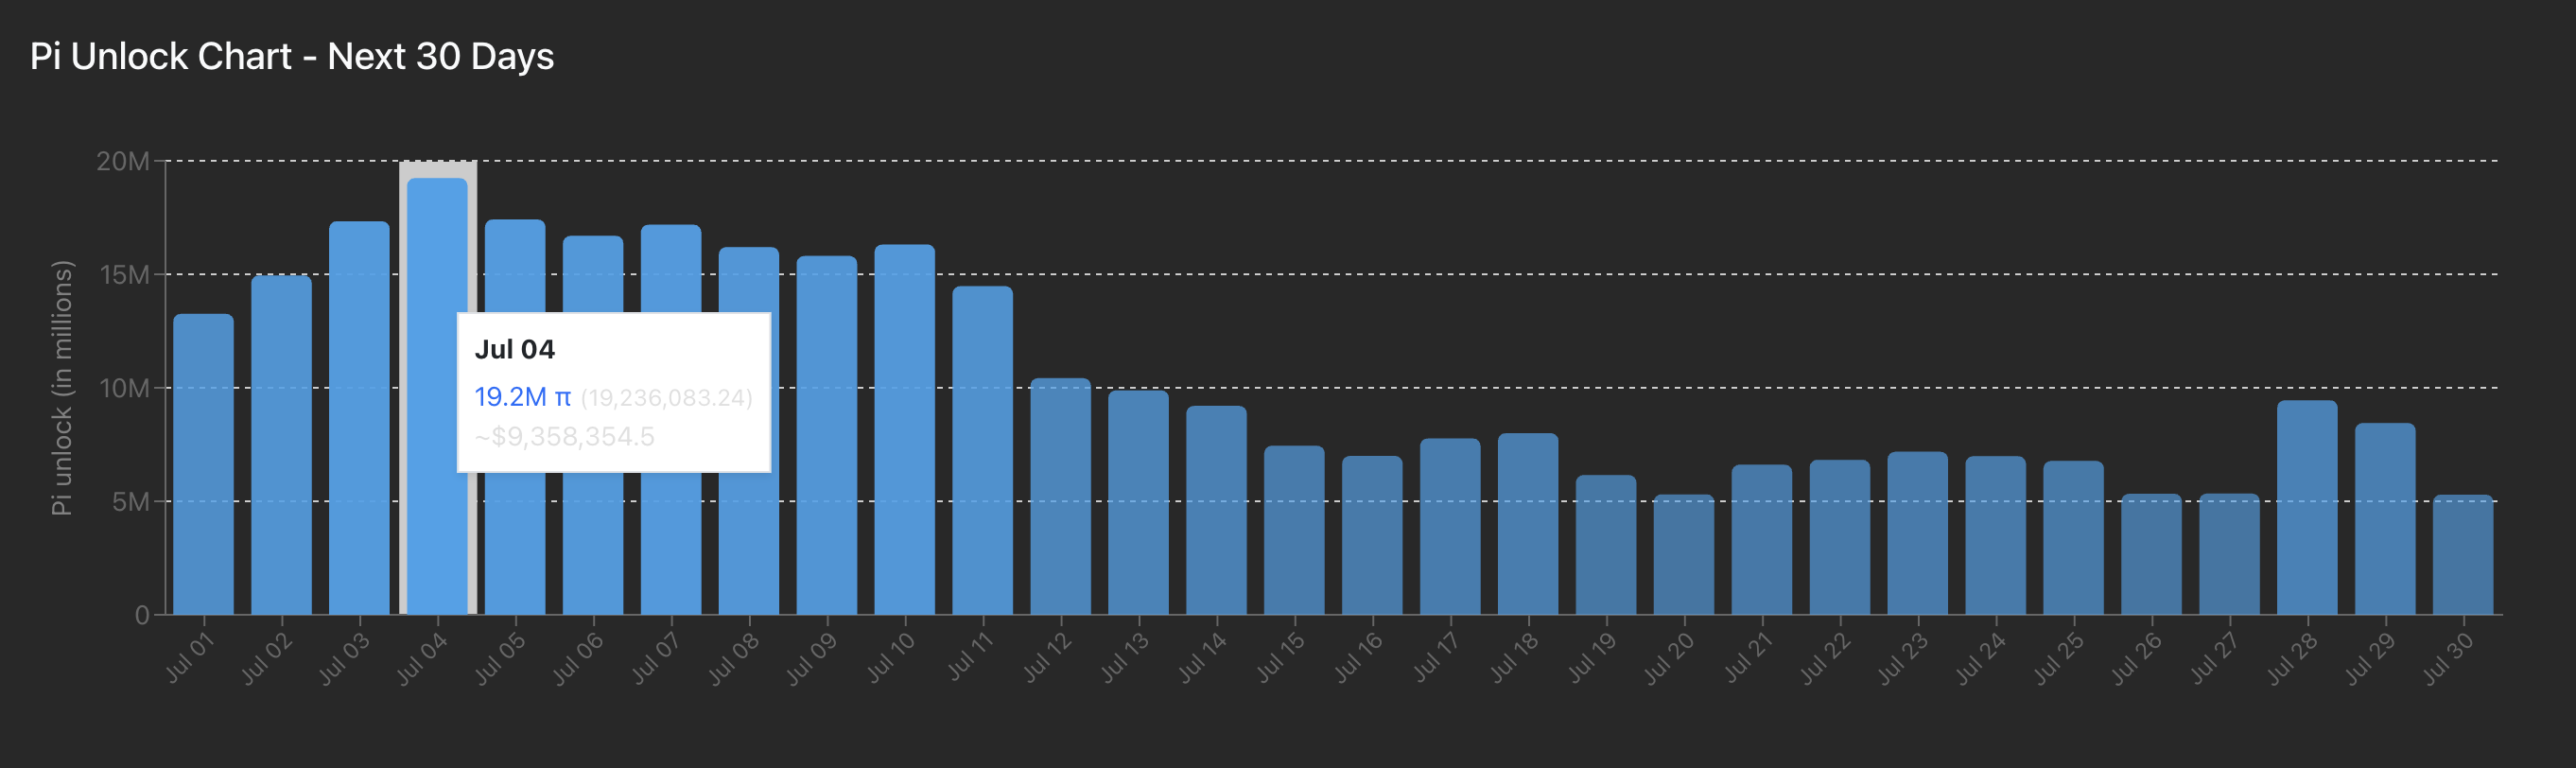
Pi token unlock chart. Source: PiScan
The sucessive token unlocks lined up in July account for a total of 268.4 million PI tokens, the highest monthly unlock until October 2027, as previously reported by FXStreet.
AI-powered no-code Pi App Studio released on Pi2Day
Pi Network released a Pi App Studio, a no-code platform to boost its ecosystem, on the highly anticipated Pi2Day on Saturday. The network also rolled out Ecosystem Directory Staking to increase an app's ranking by staking Pi tokens on the mainnet.
Despite multiple other minor updates, the Pi2Day announcements failed to boost Pi Network’s spot market performance.

Pi network risks further losses to $0.40
Pi Network ticks higher by over 1% at press time on Wednesday, after six consecutive days of losses. Last week, Pi Network surged to a peak of $0.6667 before losing the gains and limiting its weekly growth to 5.94%.
As the declining trend nears the lowest price of June 22 at $0.4711, a potential daily close below it could extend the downfall to $0.4000, a support level that has been tested twice, on April 5 and June 13.
It is worth noting that a daily close below $0.5031 marks the lowest closing price since February, thereby increasing the chances of a breakdown below $0.4711.
The Moving Average Convergence/Divergence (MACD) indicator displays the MACD line crossing below its signal line, triggering a sell signal.
The Relative Strength Index (RSI) at 36, closer to the oversold boundary line, suggesting a heightened selling pressure.
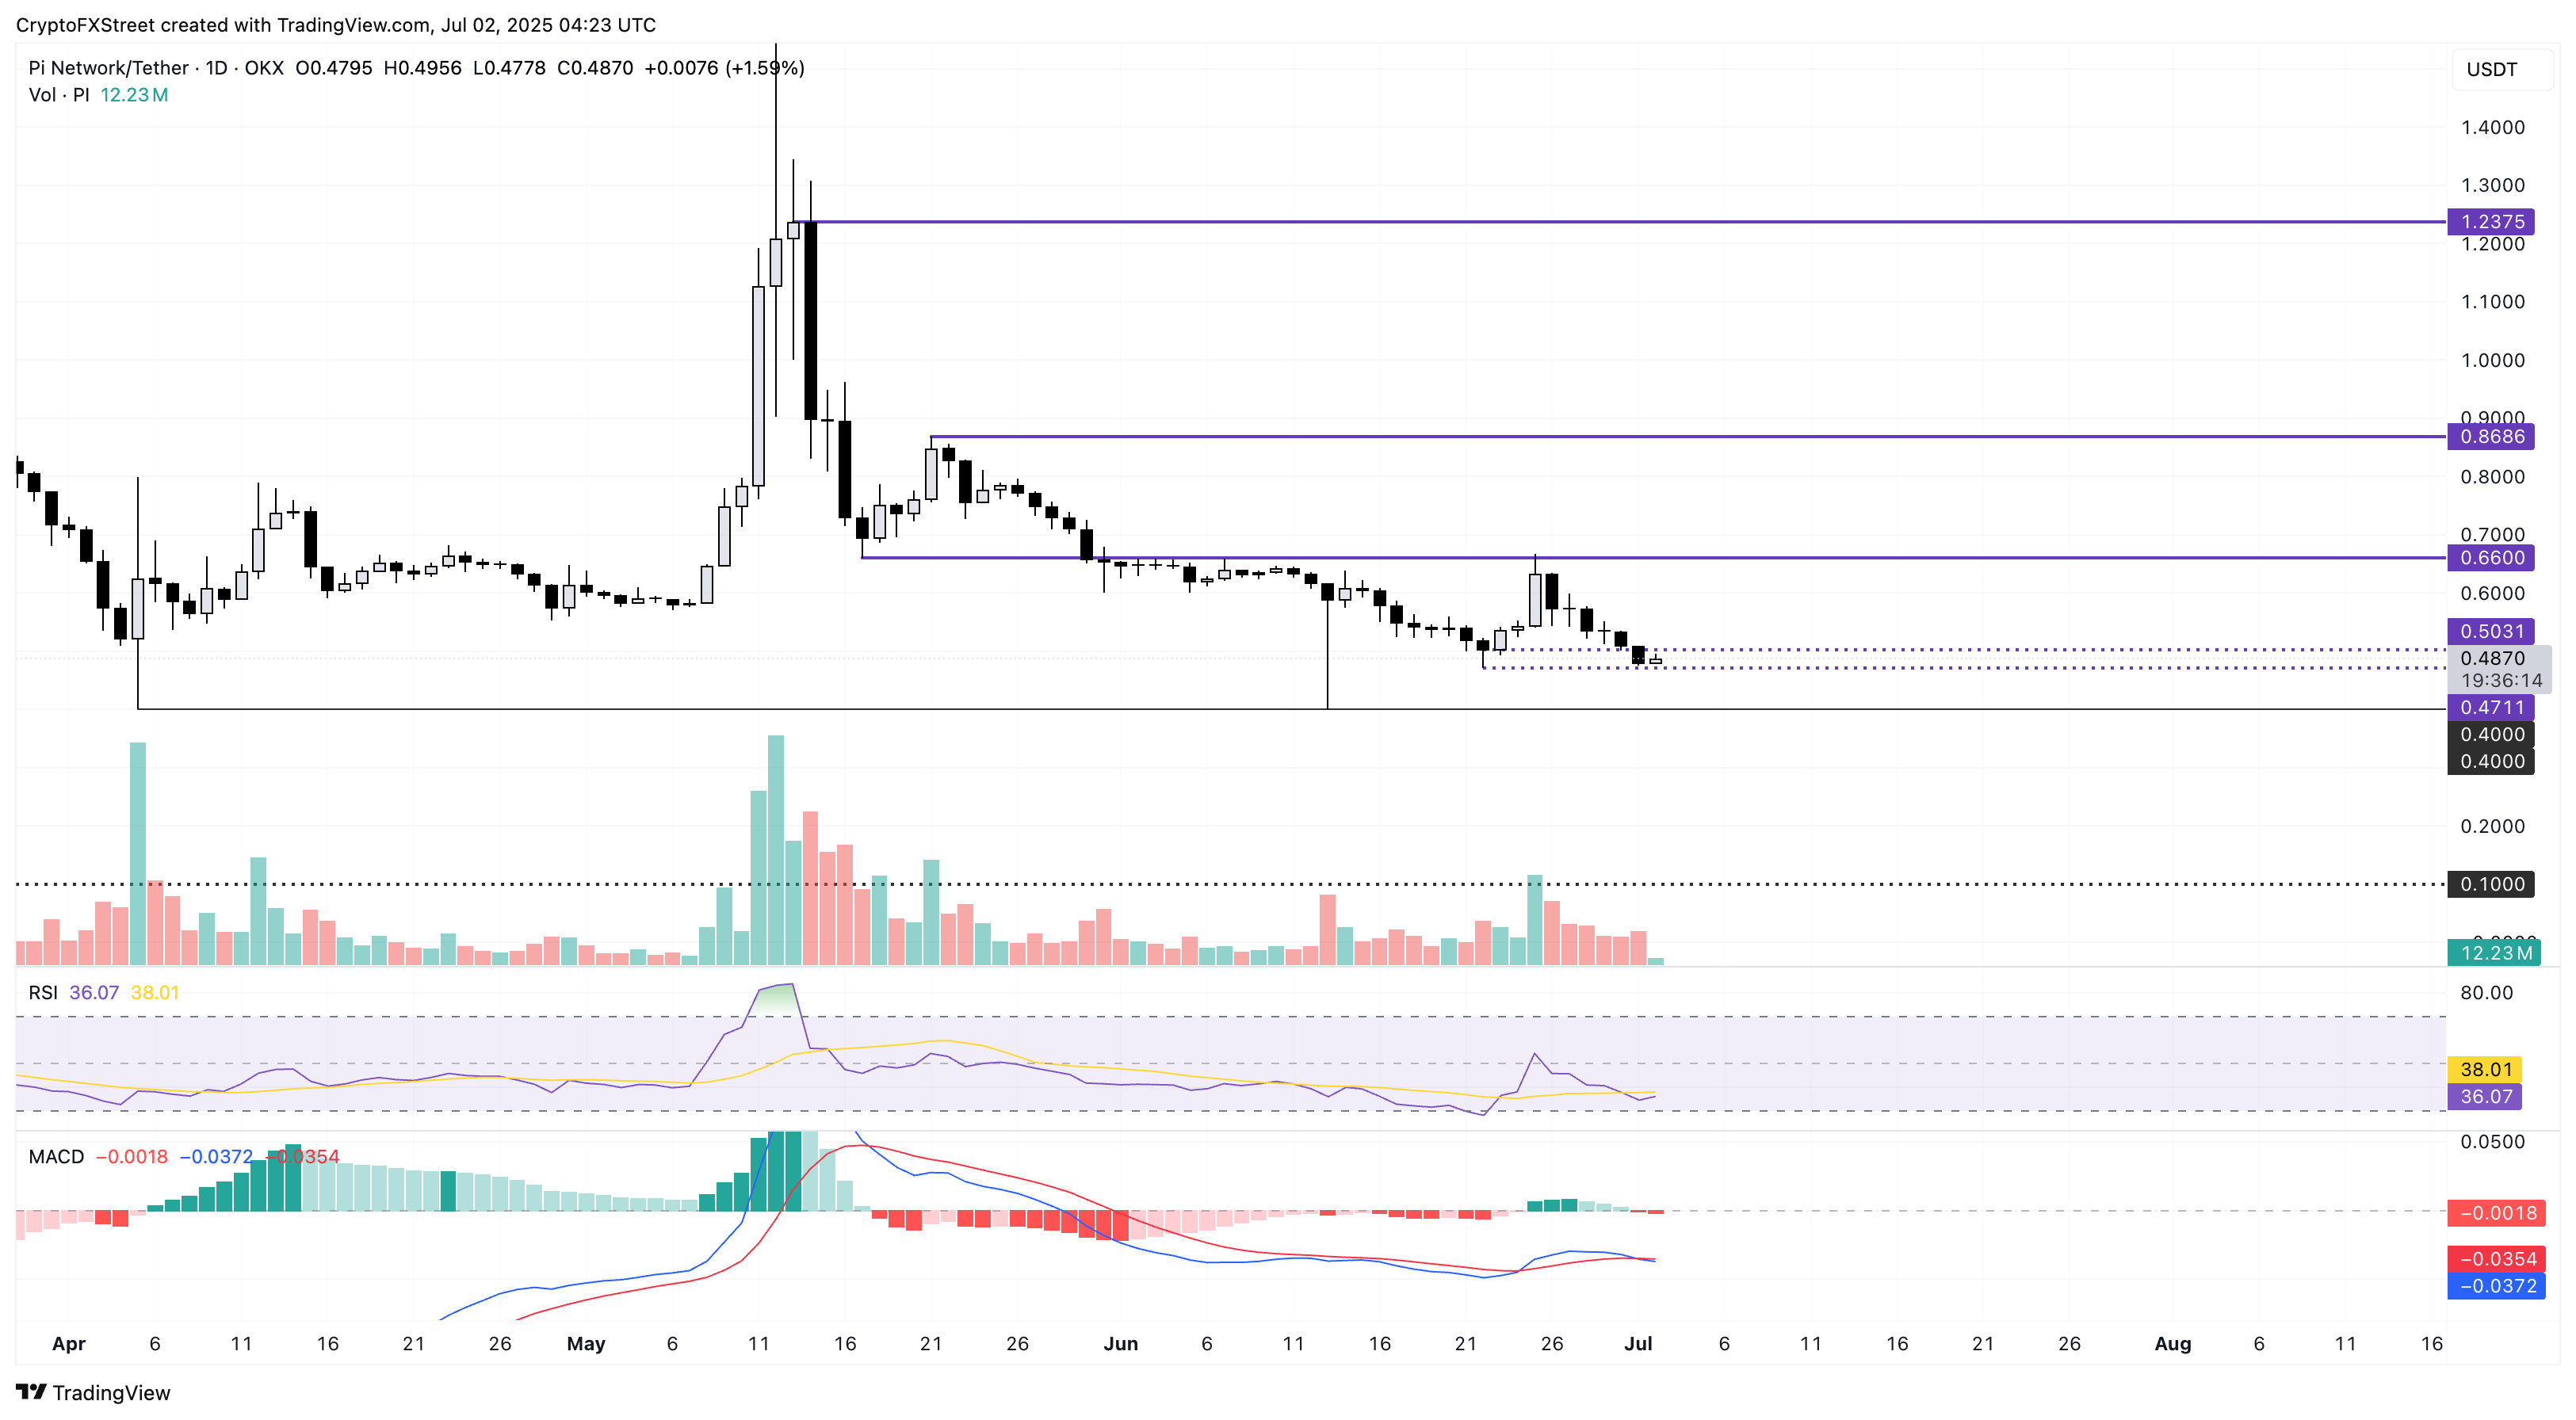
PI/USDT daily price chart
With a lower shadow candle, PI could reverse towards $0.6600 price level marked by the lowest price of May 17 if the broader market recovers.
Open Interest, funding rate FAQs
Higher Open Interest is associated with higher liquidity and new capital inflow to the market. This is considered the equivalent of increase in efficiency and the ongoing trend continues. When Open Interest decreases, it is considered a sign of liquidation in the market, investors are leaving and the overall demand for an asset is on a decline, fueling a bearish sentiment among investors.
Funding fees bridge the difference between spot prices and prices of futures contracts of an asset by increasing liquidation risks faced by traders. A consistently high and positive funding rate implies there is a bullish sentiment among market participants and there is an expectation of a price hike. A consistently negative funding rate for an asset implies a bearish sentiment, indicating that traders expect the cryptocurrency’s price to fall and a bearish trend reversal is likely to occur.
Author

Vishal Dixit
FXStreet
Vishal Dixit holds a B.Sc. in Chemistry from Wilson College but found his true calling in the world of crypto.


