Pi Network Price Forecast: CEXs' reserve outflow fuels recovery chances ahead of Pi2Day’s GenAI claims
- Pi Network loses steam as it extends the 9% fall from Thursday.
- PI CEX reserves record outflows as whale activity sparks ahead of the Pi2Day.
- The technical outlook remains bearish as Pi Network struggles to maintain its weekly gains.

Pi Network (PI) drops by 4% at press time on Friday, extending its reversal from the 50-day Exponential Moving Average (EMA). Amid the pullback, the falling Centralized Exchanges (CEX) reserves record a sharp outflow, signaling smart money absorbing the supply pressure. Still, the claims of Generative AI features on Pi Network are to be potentially announced on Pi2Day on Saturday.
CEX reserves plunge amid whale activity
PiScan’s data shows a massive net outflow of 6.50 million PI tokens from CEXs' wallet balances, reflecting a significant decline in supply pressure. The OKX wallet recorded a net outflow of 3.92 million PI, followed by the MEXC wallet offloading 1.05 million PI tokens, which their users could have purchased.
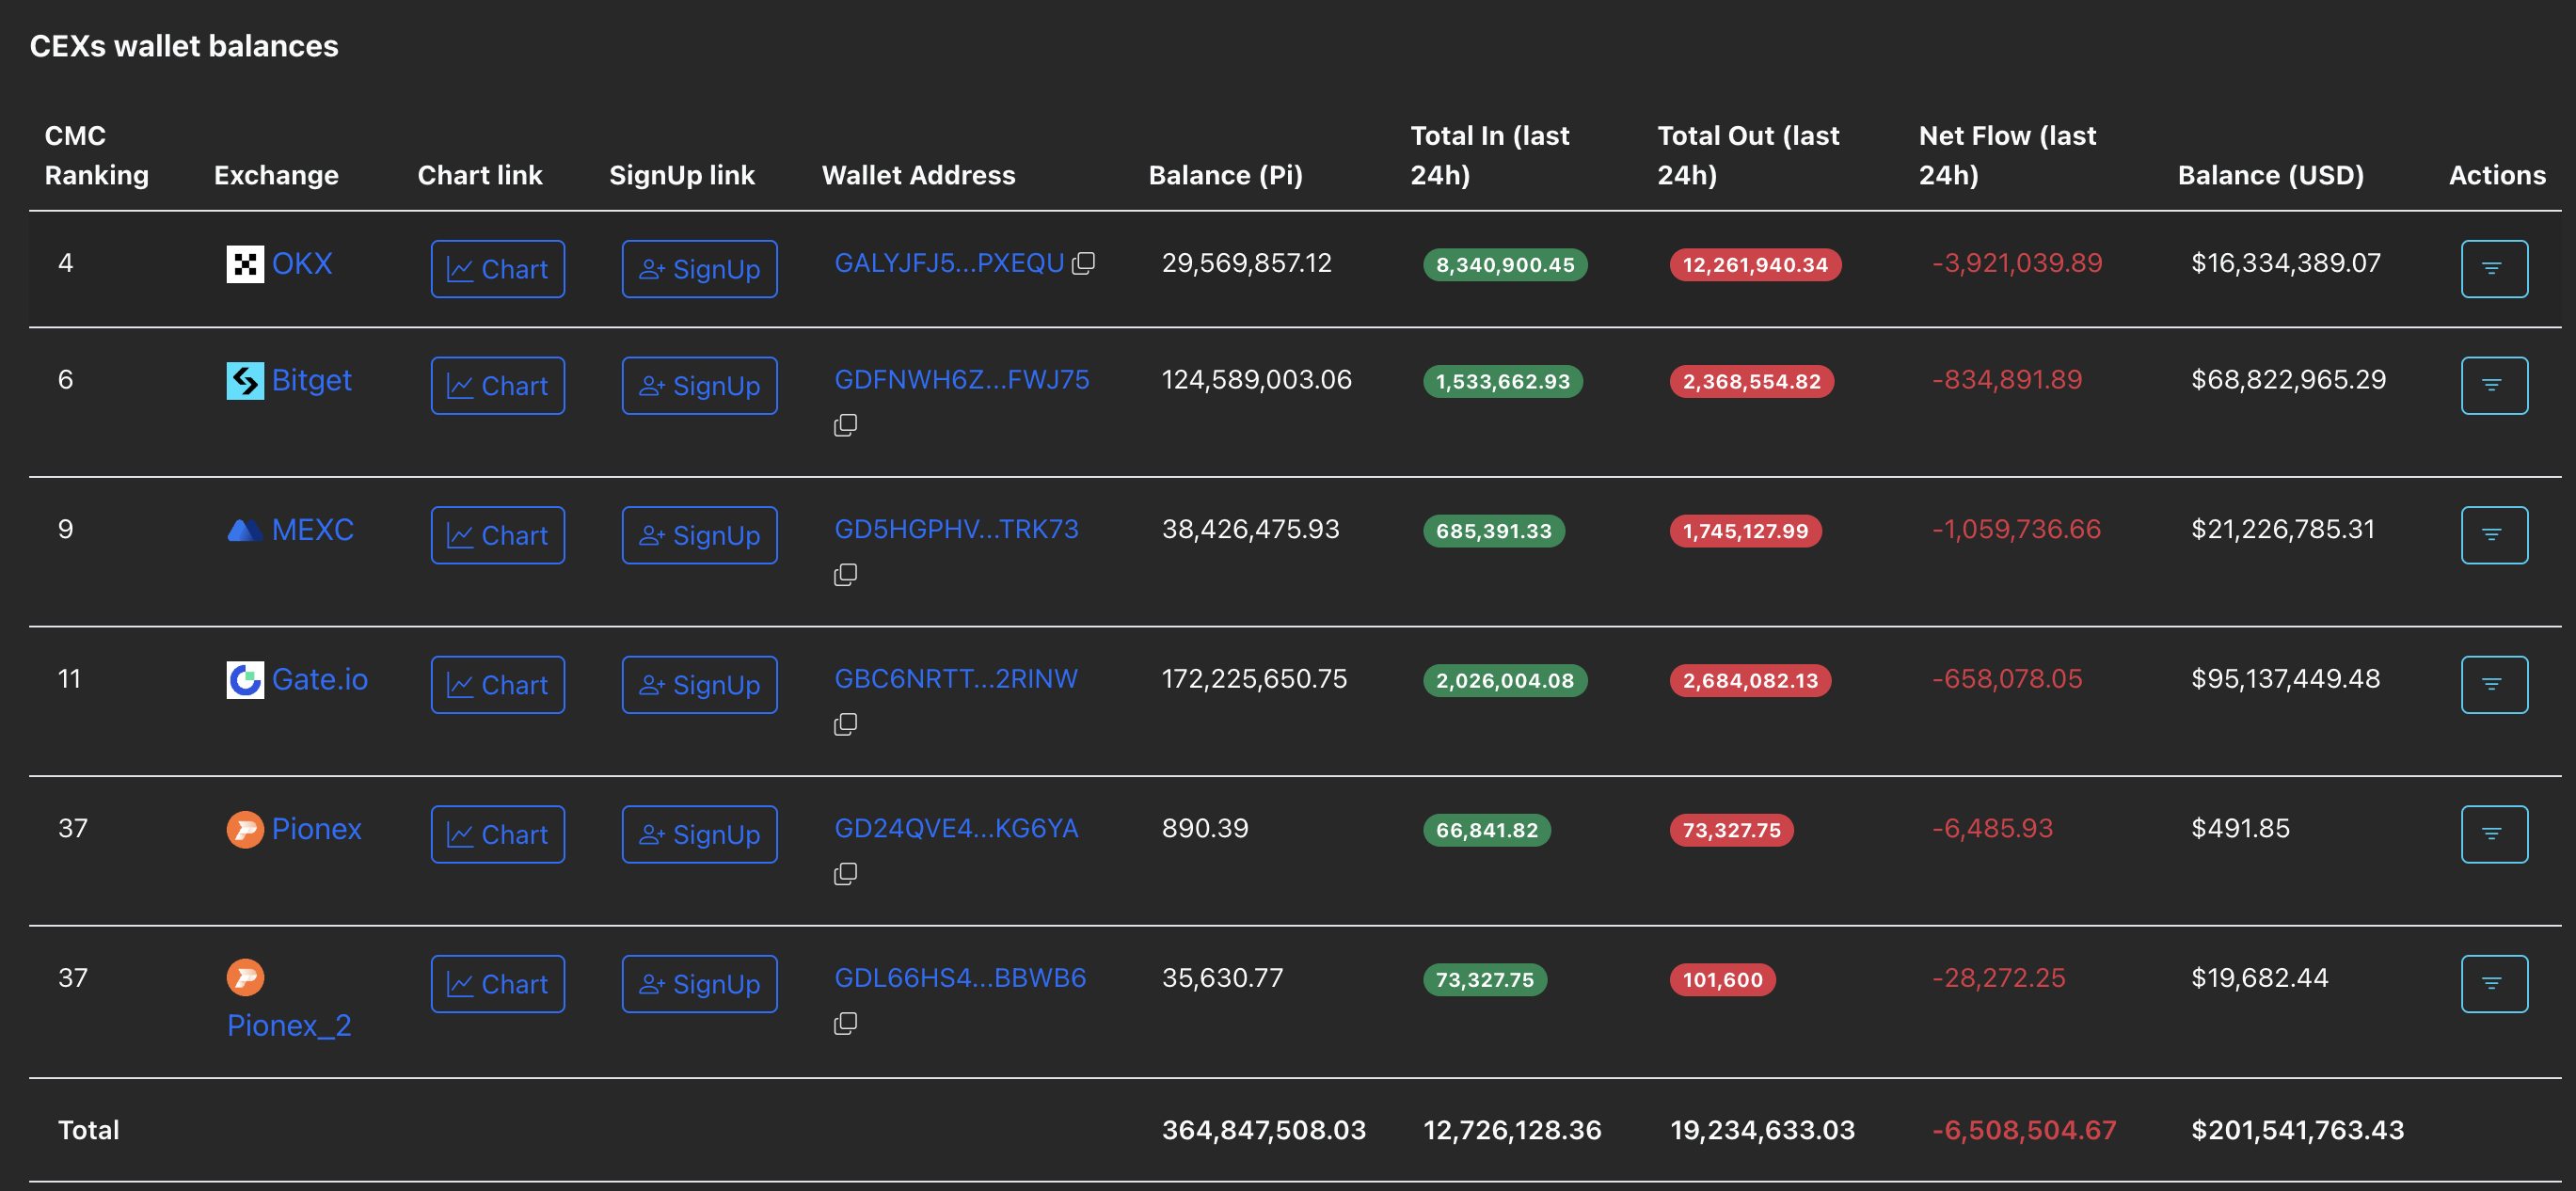
CEXs' wallet balances data. Source: PiScan
The heightened activity of large investors, popularly known as whales, may be fueling the outflows, suggesting increased demand. From the OKX exchange alone, three whales have acquired a total of 11.09 million PI tokens, marking the largest 24-hour transactions except for a Pi Foundation internal transfer worth 50 million PI tokens.
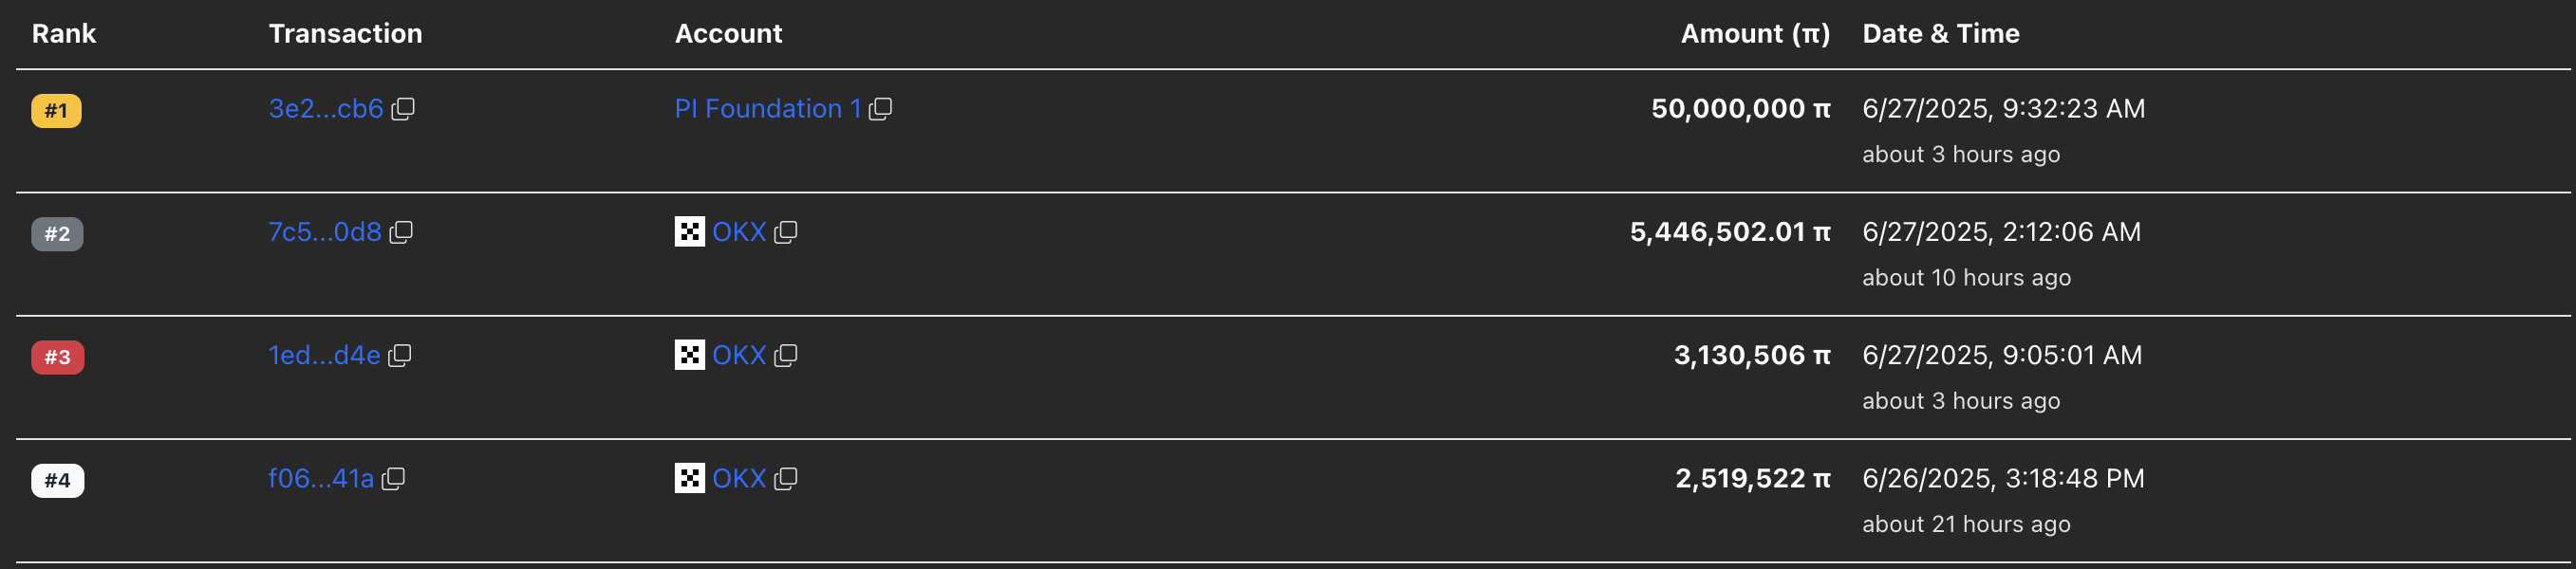
PI large transactions. Source: PiScan
With the Generative AI buzz surrounding the Pi2Day on Saturday, as reported by FXstreet, the whale activity suggests that smart money is on a buying spree.
Pi Network risks testing weekly low
Pi Network ticks lower by 4% at the time of writing on Friday, extending the 9.34% drop from the previous day. Despite a 16% jump on Wednesday, PI failed to surpass the 50-day EMA at $0.66, nearly erasing the gains.
A daily close below $0.50 (psychological number, April 4 low) could test the Sunday low at $0.47, increasing the chances of $0.40 retest, last visited on June 13.
The Moving Average Convergence/Divergence (MACD) indicator displays a decrease in the intensity of the green histogram bar, indicating a decline in bullish momentum.
The Relative Strength Index (RSI) at 42 takes a steep reversal crossing below the mid-level, presenting room for correction before reaching oversold conditions.
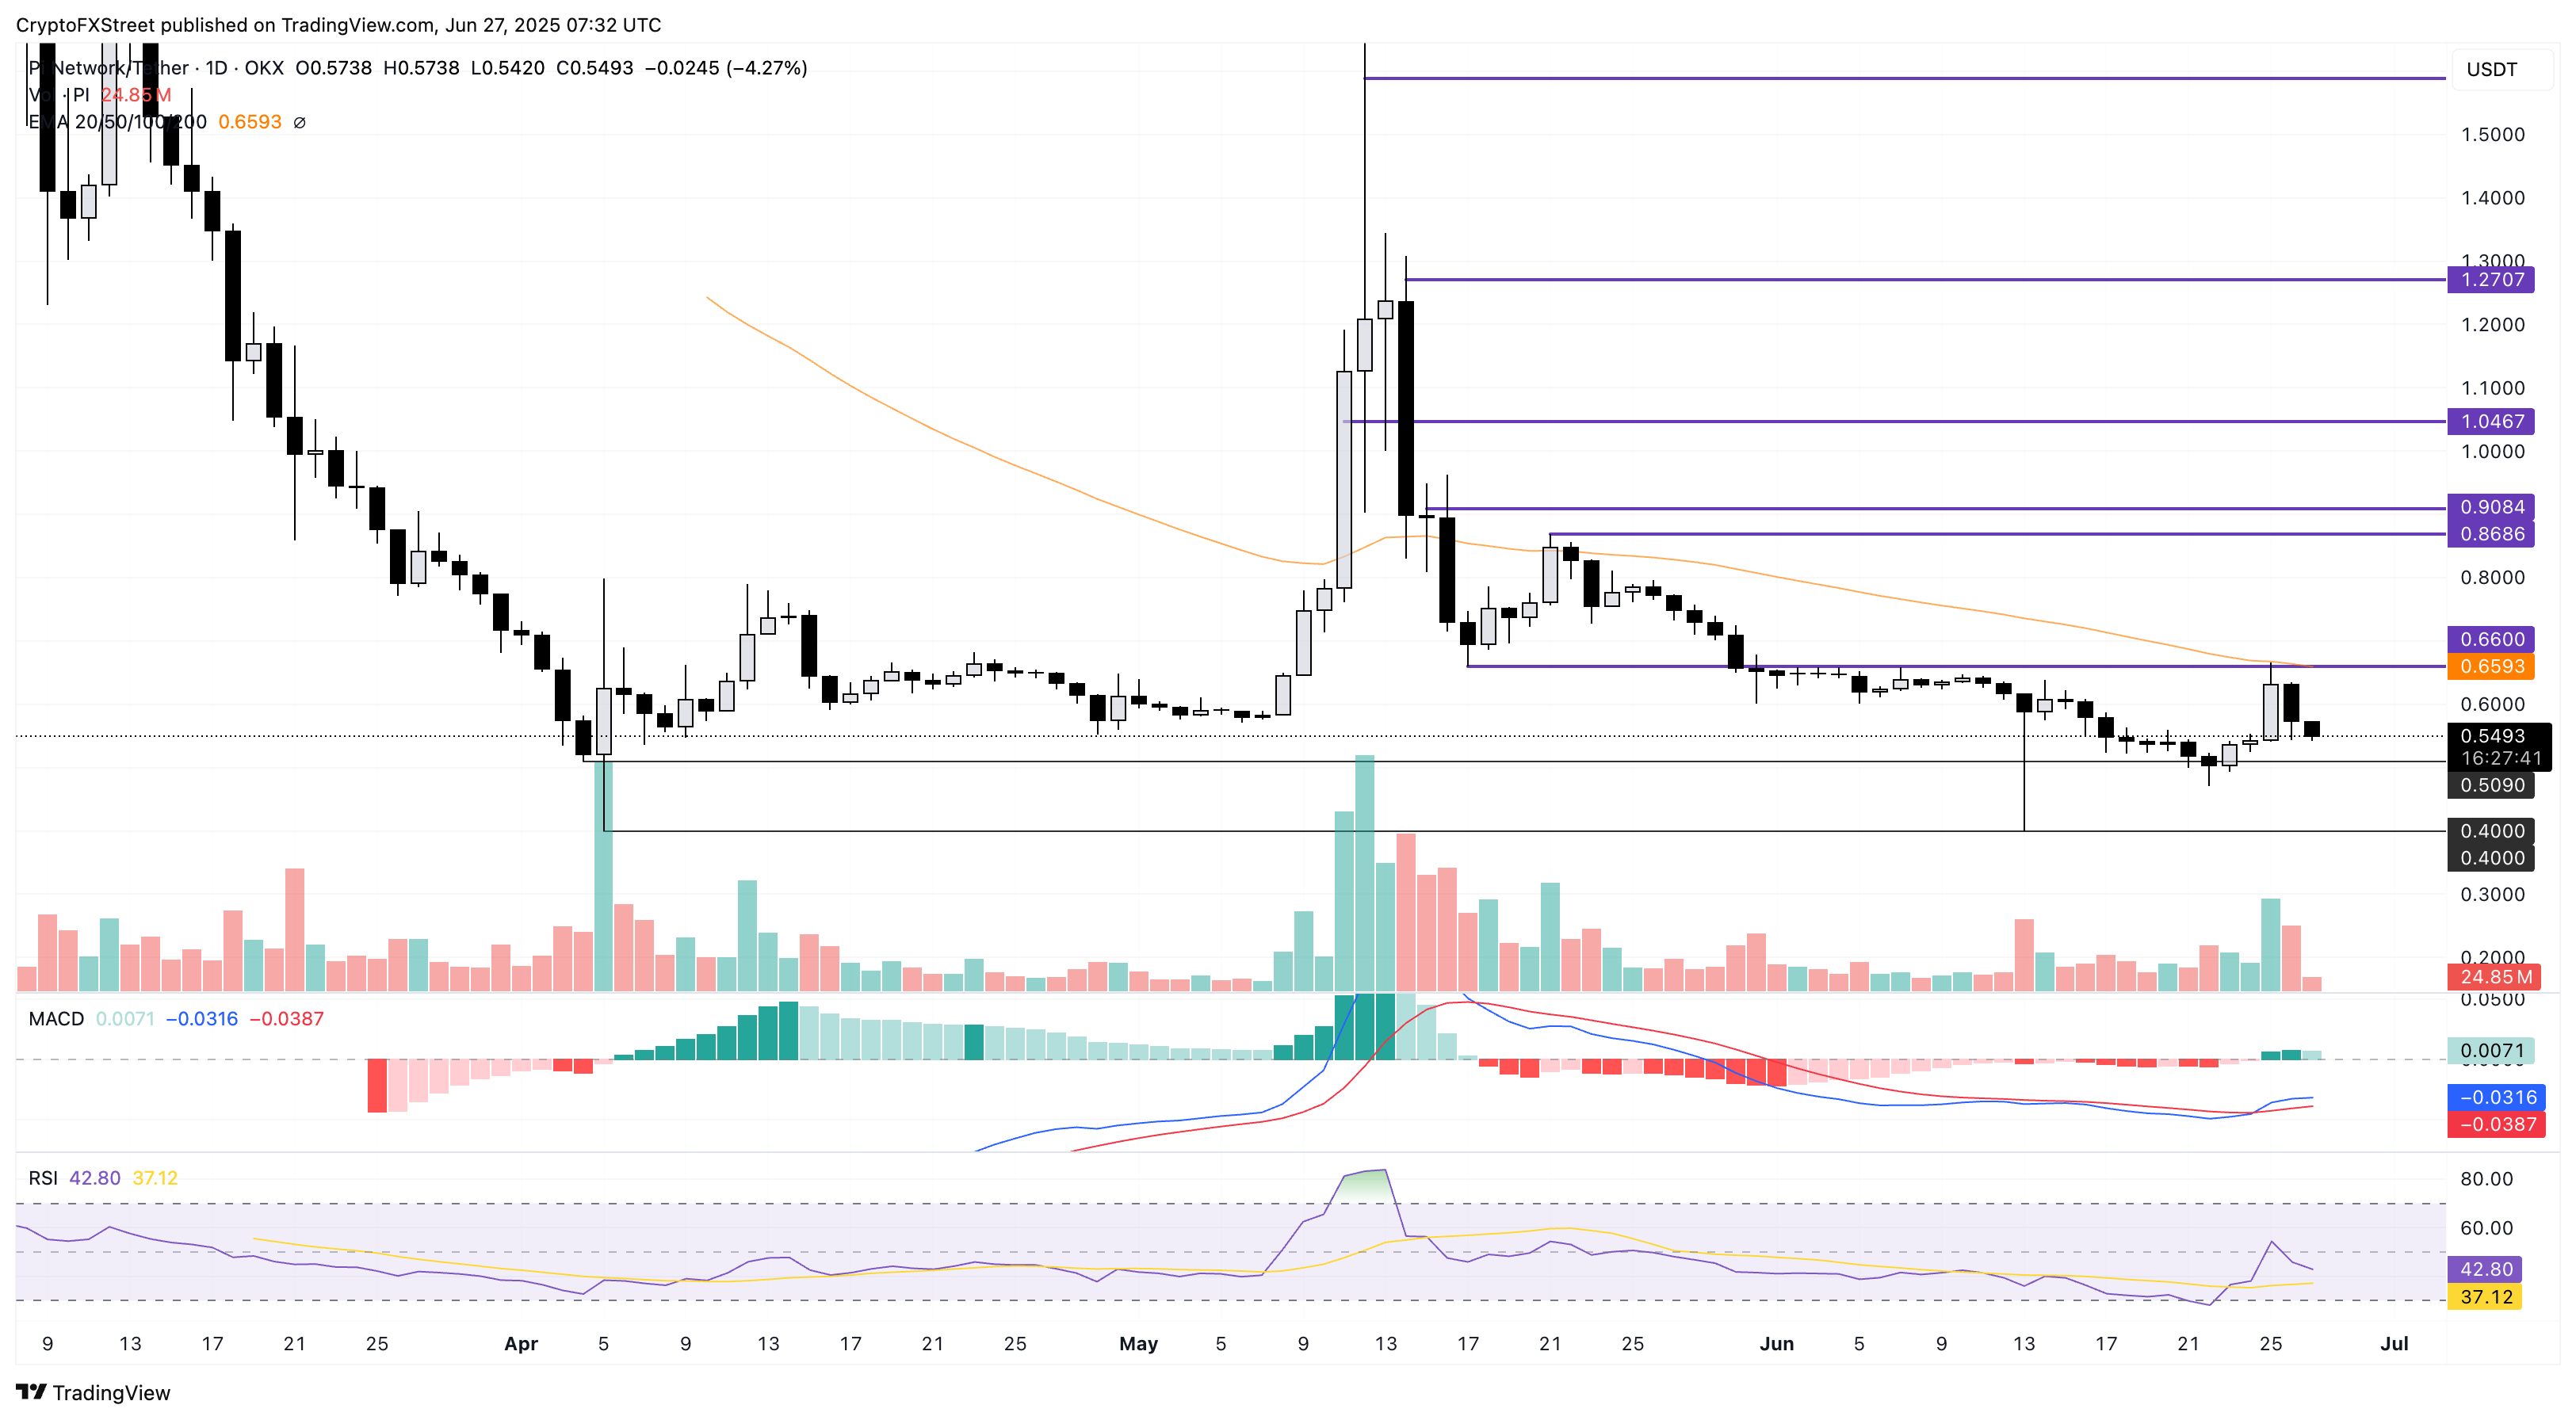
PI/USDT daily price chart.
However, a potential hype-driven rally on Pi2Day could test the $0.66 resistance level, last tested on Wednesday. A clean push above this level could target $0.86, the highest price of May 21.
Author

Vishal Dixit
FXStreet
Vishal Dixit holds a B.Sc. in Chemistry from Wilson College but found his true calling in the world of crypto.



