Pepe sell signal hints at 20% crash before bulls come back
- Pepe price has signaled a potential decline that could suggest a pause to its ascent.
- Technical indicators and on-chain metrics suggest that investors can expect a 20% crash that retests the $0.0000130 mean level.
- The bearish thesis will be invalidated if the meme coin flips the $0.0000172 hurdle into a support floor.

Pepe (PEPE) price has shown resilience in the past two weeks, with the most recent rally nearly doubling the meme coin’s market value. However, due to the nature of the recent impulsive move, investors can expect a short-term correction, which could be an opportunity for patient and long-term buyers.
Also read: PEPE hits new all-time high, meme coin could extend gains
Pepe price falters after reaching all-time high
Pepe price shot up nearly 100% between May 19 and 27. This short-term spike pushed the frog-based meme coin to set up a new all-time high (ATH) of $0.0000172. But during the last leg of its ascent, between May 21 and 27, PEPE signaled exhaustion.
This sell signal is clear when looking at the price, which produced higher highs, but the Relative Strength Index (RSI) set up lower highs. This non-conformity is termed bearish divergence and often leads to a short-term correction or reversal of the uptrend, originating due to the lack of bullish momentum.
Based on the current price action of Pepe, the correction has begun, as PEPE dropped nearly 6% from its ATH. If this bearish outlook takes hold, the frog-based meme coin could slide an additional 20% and retest $0.0000130, the midpoint of the $0.0000172 to $0.00000878 range.
This type of correction or mean reversion is common when an asset rallies too much in too little time. The mean reversion process is a way to rebalance any imbalances formed during this impulsive move.
So, in this scenario, investors should consider booking profits or preparing for an opportunity to buy PEPE on the upcoming dips.
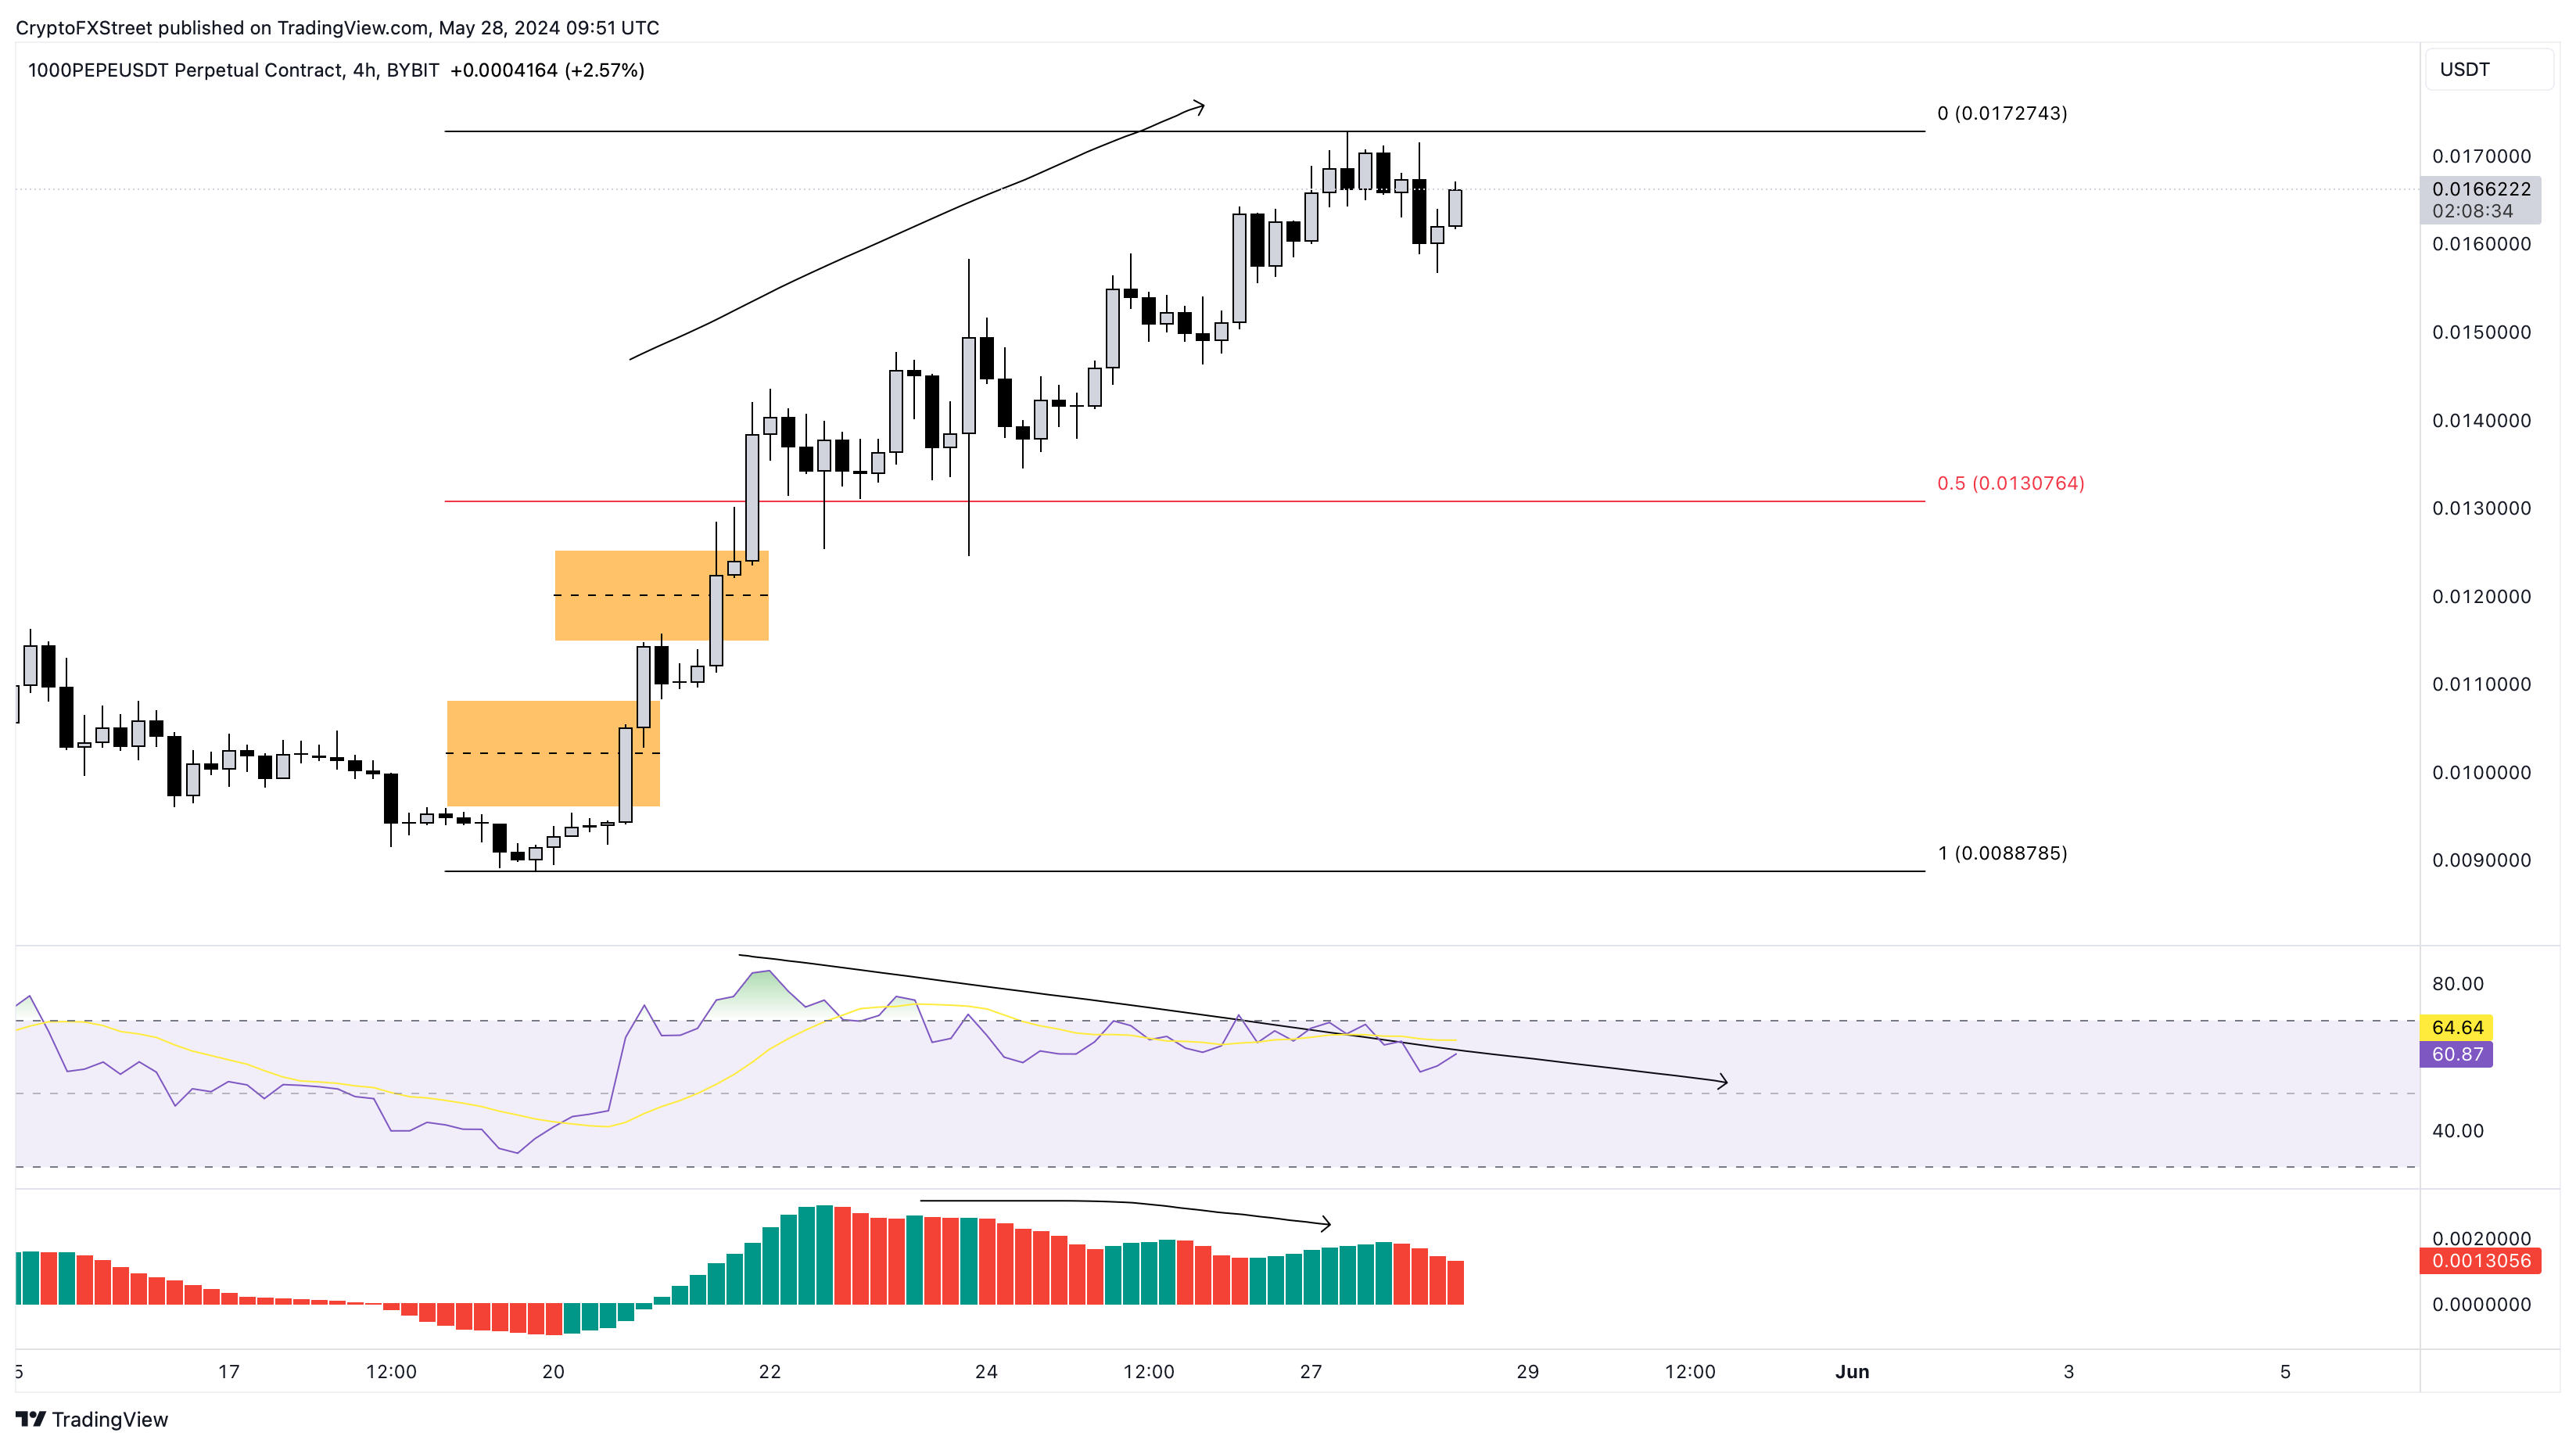
PEPE/USDT 4-hour chart
According to Santiment data, the 30-day Market Value to Realized Value (MVRV) ratio indicator hovers around 42%, indicating a potential sell signal. This indicator shows that the investors who purchased PEPE over the past month are sitting at an average profit of 42%. This unrealized profit could quickly turn into selling pressure if these holders decide to sell.
 [15.20.47, 28 May, 2024]-638524937863830433.png)
PEPE 30-day MVRV
Adding to the bearish thesis, the 24-hour active addresses spikes noted during mid-May and present conditions are declining, showcasing the classic non-conformity with the Pepe price action. This bearish divergence setup is also another confirmation of the potential correction that PEPE will likely undergo soon.
 [15.20.33, 28 May, 2024]-638524938065369221.png)
PEPE 24-hour active addresses
While the overall outlook for Pepe price is pessimistic, signals could flip in the event of a Bitcoin (BTC) rally. In such a case, if PEPE flips the $0.0000172 hurdle into a support floor on the daily time frame, it would invalidate the bearish thesis.
This development could attract many investors to book profits, triggering a subsequent Pepe price crash to $0.0000120, which is the midpoint of the daily imbalance extending from $0.0000125 to $0.0000114.
Premium
You have reached your limit of 3 free articles for this month.
Start your subscription and get access to all our original articles.
Author

Akash Girimath
FXStreet
Akash Girimath is a Mechanical Engineer interested in the chaos of the financial markets. Trying to make sense of this convoluted yet fascinating space, he switched his engineering job to become a crypto reporter and analyst.


