Pepe Price Forecast: What’s next for PEPE as derivatives interest and volume surge?
- Pepe declines after nearly reaching a 35% wedge breakout target at $0.00001355.
- Interest in the meme coin remains steady, with both futures Open Interest and trading volume expanding.
- A potential Golden Cross between the 50-day and the 200-day EMA could reinforce the bullish outlook.

Pepe (PEPE) is attempting to resume the uptrend, trading at around $0.00001241 after falling from a weekly high of $0.00001337. The uptrend, triggered by a breakout from a bullish technical pattern and accentuated by rising investor risk appetite, faltered on Tuesday as investors digested the impact of higher inflation in the United States (US).
Pepe offers bullish signals backed by a steady derivatives market
Interest in Pepe remains high despite the trend reversal experienced on Tuesday, which saw the meme coin test support at $0.00001169. According to CoinGlass, the futures Open Interest (OI) has increased by 33.5% to $685 million, from $455 million, as of July 2.
Since Open Interest refers to the value of all futures and options contracts that have not been settled or closed, an increase in this metric indicates rising investor confidence and risk-on sentiment.
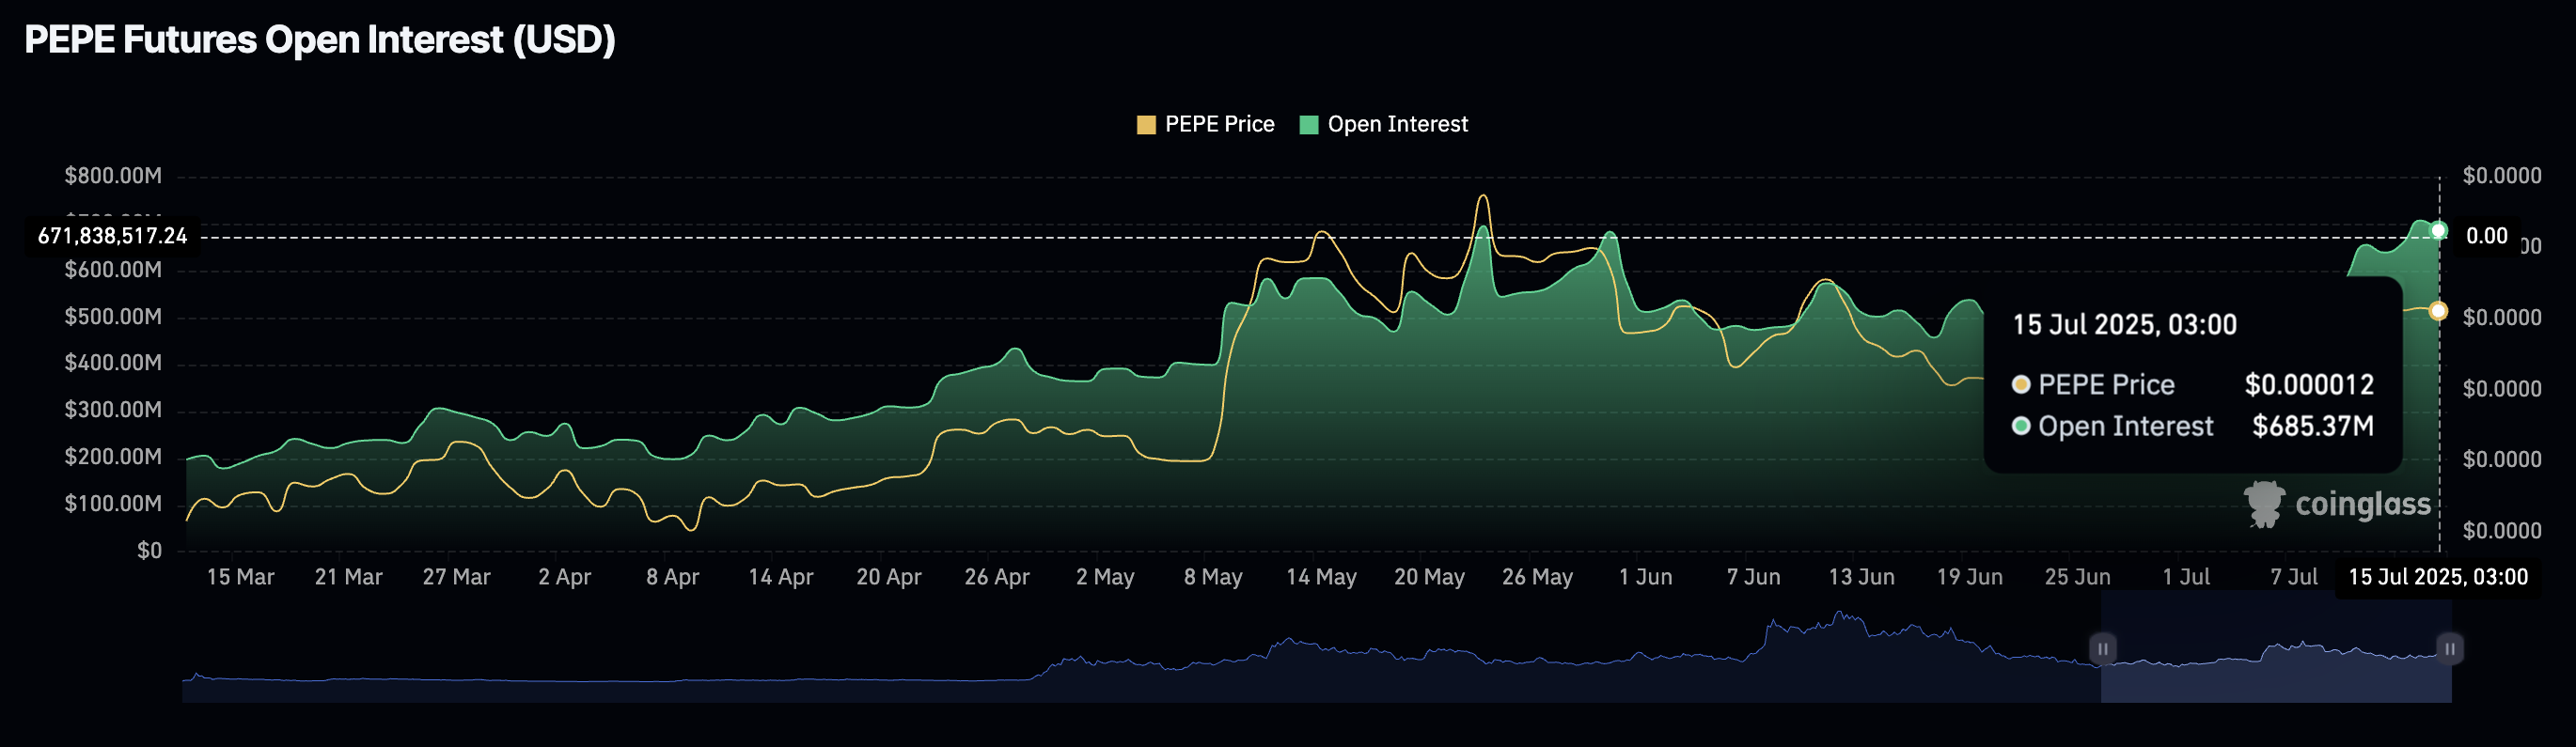
Pepe Futures Open Interest data | Source: CoinGlass
A subsequent increase in the futures contracts volume, which currently averages $3.73 billion, up from $1.39 billion on July 2, indicates that more traders are betting on a potential short-term increase in the Pepe price.
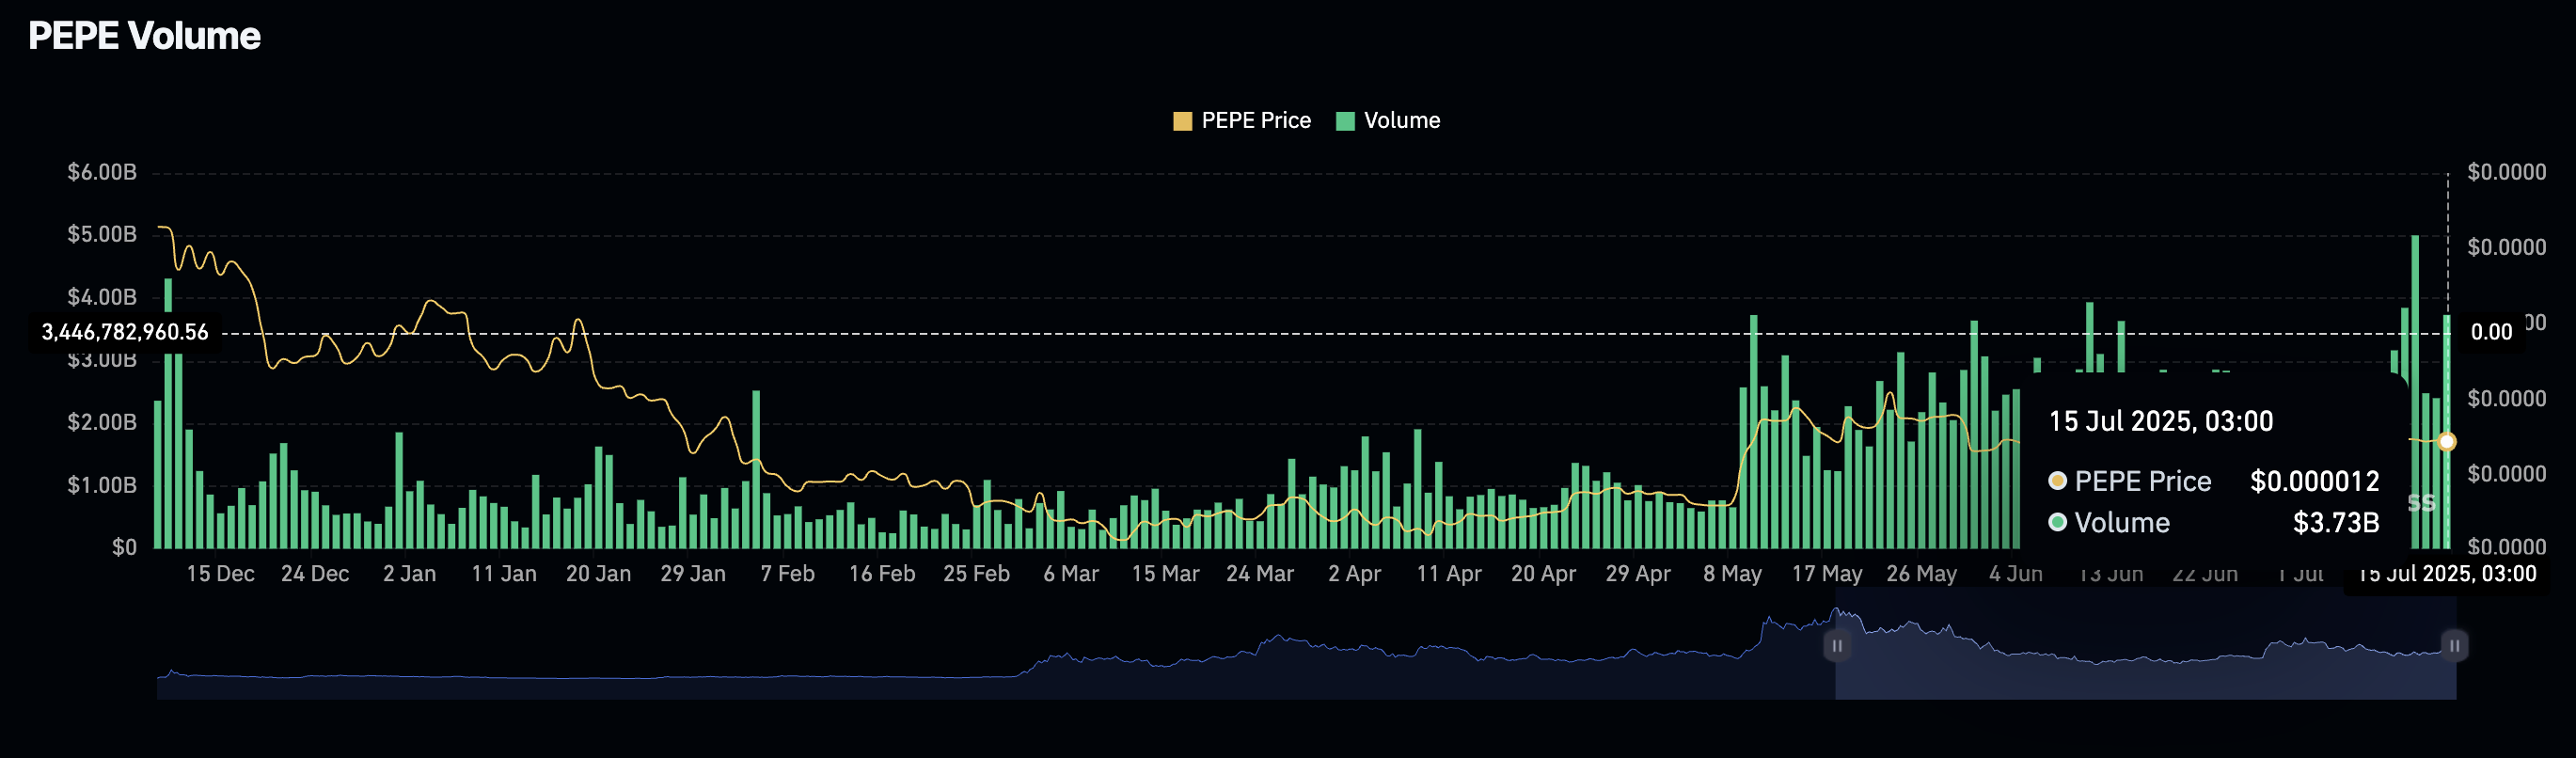
Pepe futures trading volume | Source: CoinGlass
If investor interest in Pepe stabilizes in the upcoming days, the uptrend could gain momentum, targeting highs above $0.00002000. Key factors that could influence price action include potential profit-taking as the price rises, inflation-related risks, and uncertainty surrounding the implementation of tariffs in the US on August 1.
Technical outlook: Pepe maintains bullish signals
Pepe price currently sits significantly above key moving averages, including the 100-day Exponential Moving Average (EMA) at $0.00001078 and the 200-day EMA, which forms a confluence support with the 50-day EMA at around $0.00001095. This technical position indicates a firm bullish structure, which could help uphold investor confidence in PEPE.
A potential Golden Cross between the 50-day EMA and the 200-day EMA could reinforce the bullish outlook. This pattern has historically triggered price increases in Pepe; for instance, when it was confirmed in September, the meme coin surged 248% from $0.00000823 to $0.00002838.
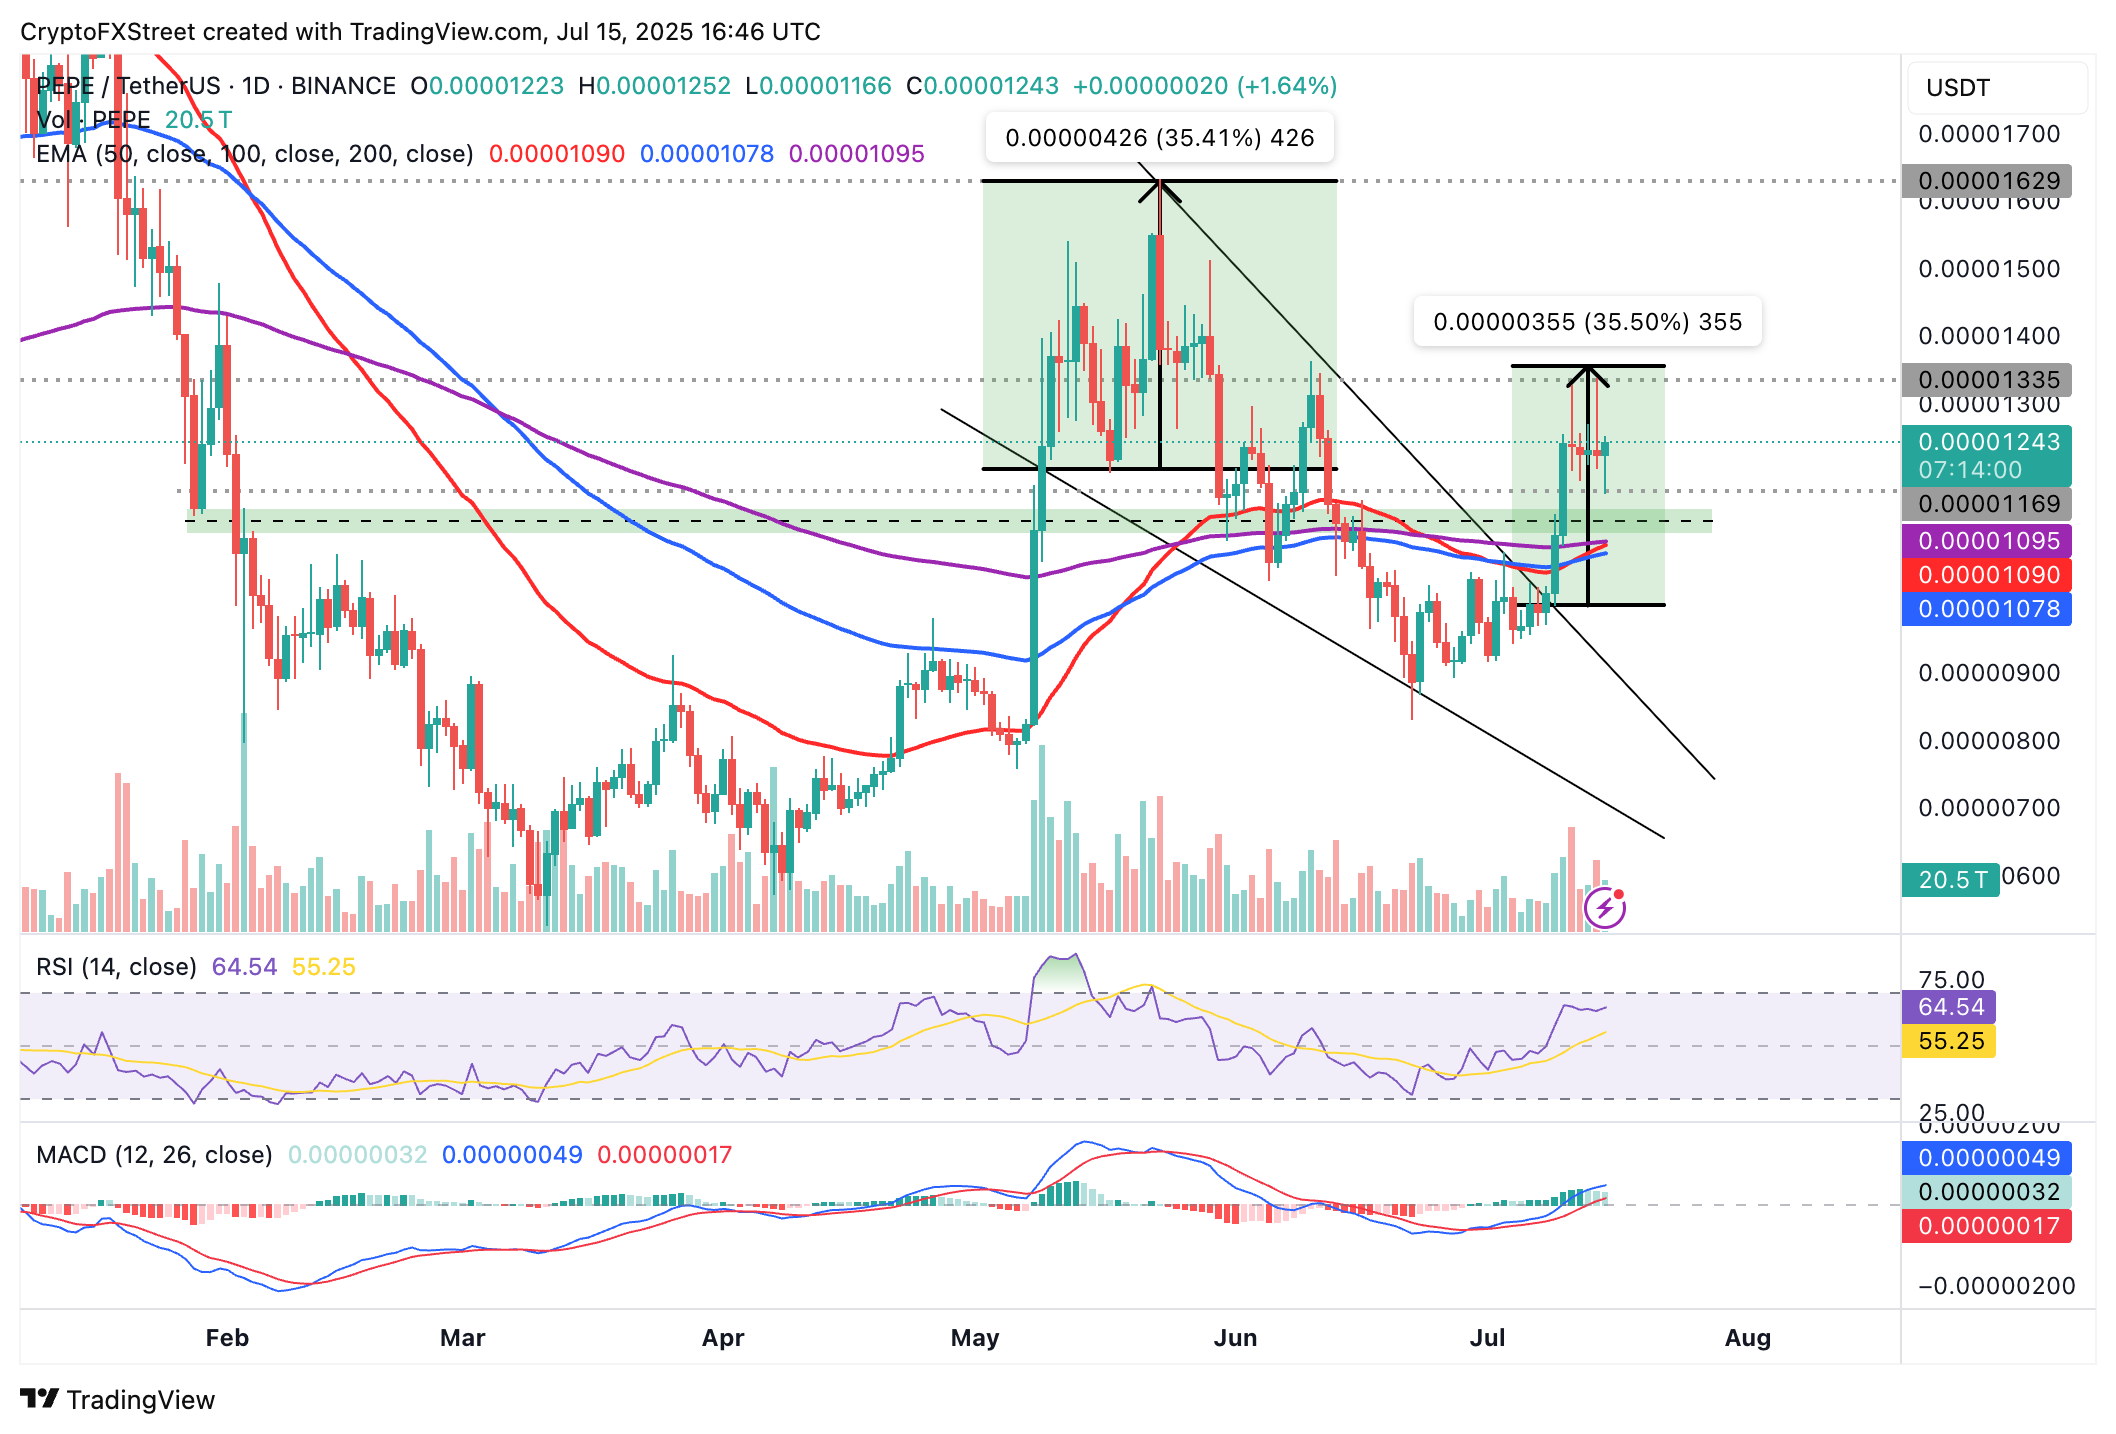
PEPE/USDT daily chart
A buy signal from the Moving Average Convergence Divergence (MACD) indicator maintained since July 1 implies that bulls could still tighten their grip on the token, encouraging risk-on sentiment.
The Relative Strength Index (RSI) indicates a resumption of the uptrend, with readings above 64 signaling bullish momentum. Notably, the breakout from the falling wedge pattern, with a target of 35% to $0.00001355, could resume in upcoming sessions, as bulls eye key milestones such as the resistance at $0.00001629, which was tested in May, and the round-figure hurdle at $0.00002000.
Open Interest, funding rate FAQs
Higher Open Interest is associated with higher liquidity and new capital inflow to the market. This is considered the equivalent of increase in efficiency and the ongoing trend continues. When Open Interest decreases, it is considered a sign of liquidation in the market, investors are leaving and the overall demand for an asset is on a decline, fueling a bearish sentiment among investors.
Funding fees bridge the difference between spot prices and prices of futures contracts of an asset by increasing liquidation risks faced by traders. A consistently high and positive funding rate implies there is a bullish sentiment among market participants and there is an expectation of a price hike. A consistently negative funding rate for an asset implies a bearish sentiment, indicating that traders expect the cryptocurrency’s price to fall and a bearish trend reversal is likely to occur.
Author

John Isige
FXStreet
John Isige is a seasoned cryptocurrency journalist and markets analyst committed to delivering high-quality, actionable insights tailored to traders, investors, and crypto enthusiasts. He enjoys deep dives into emerging Web3 tren


