Pepe Price Forecast: PEPE sustains mild recovery on firm retail support
- Pepe holds steady on Friday after a 3.50% rebound the previous day.
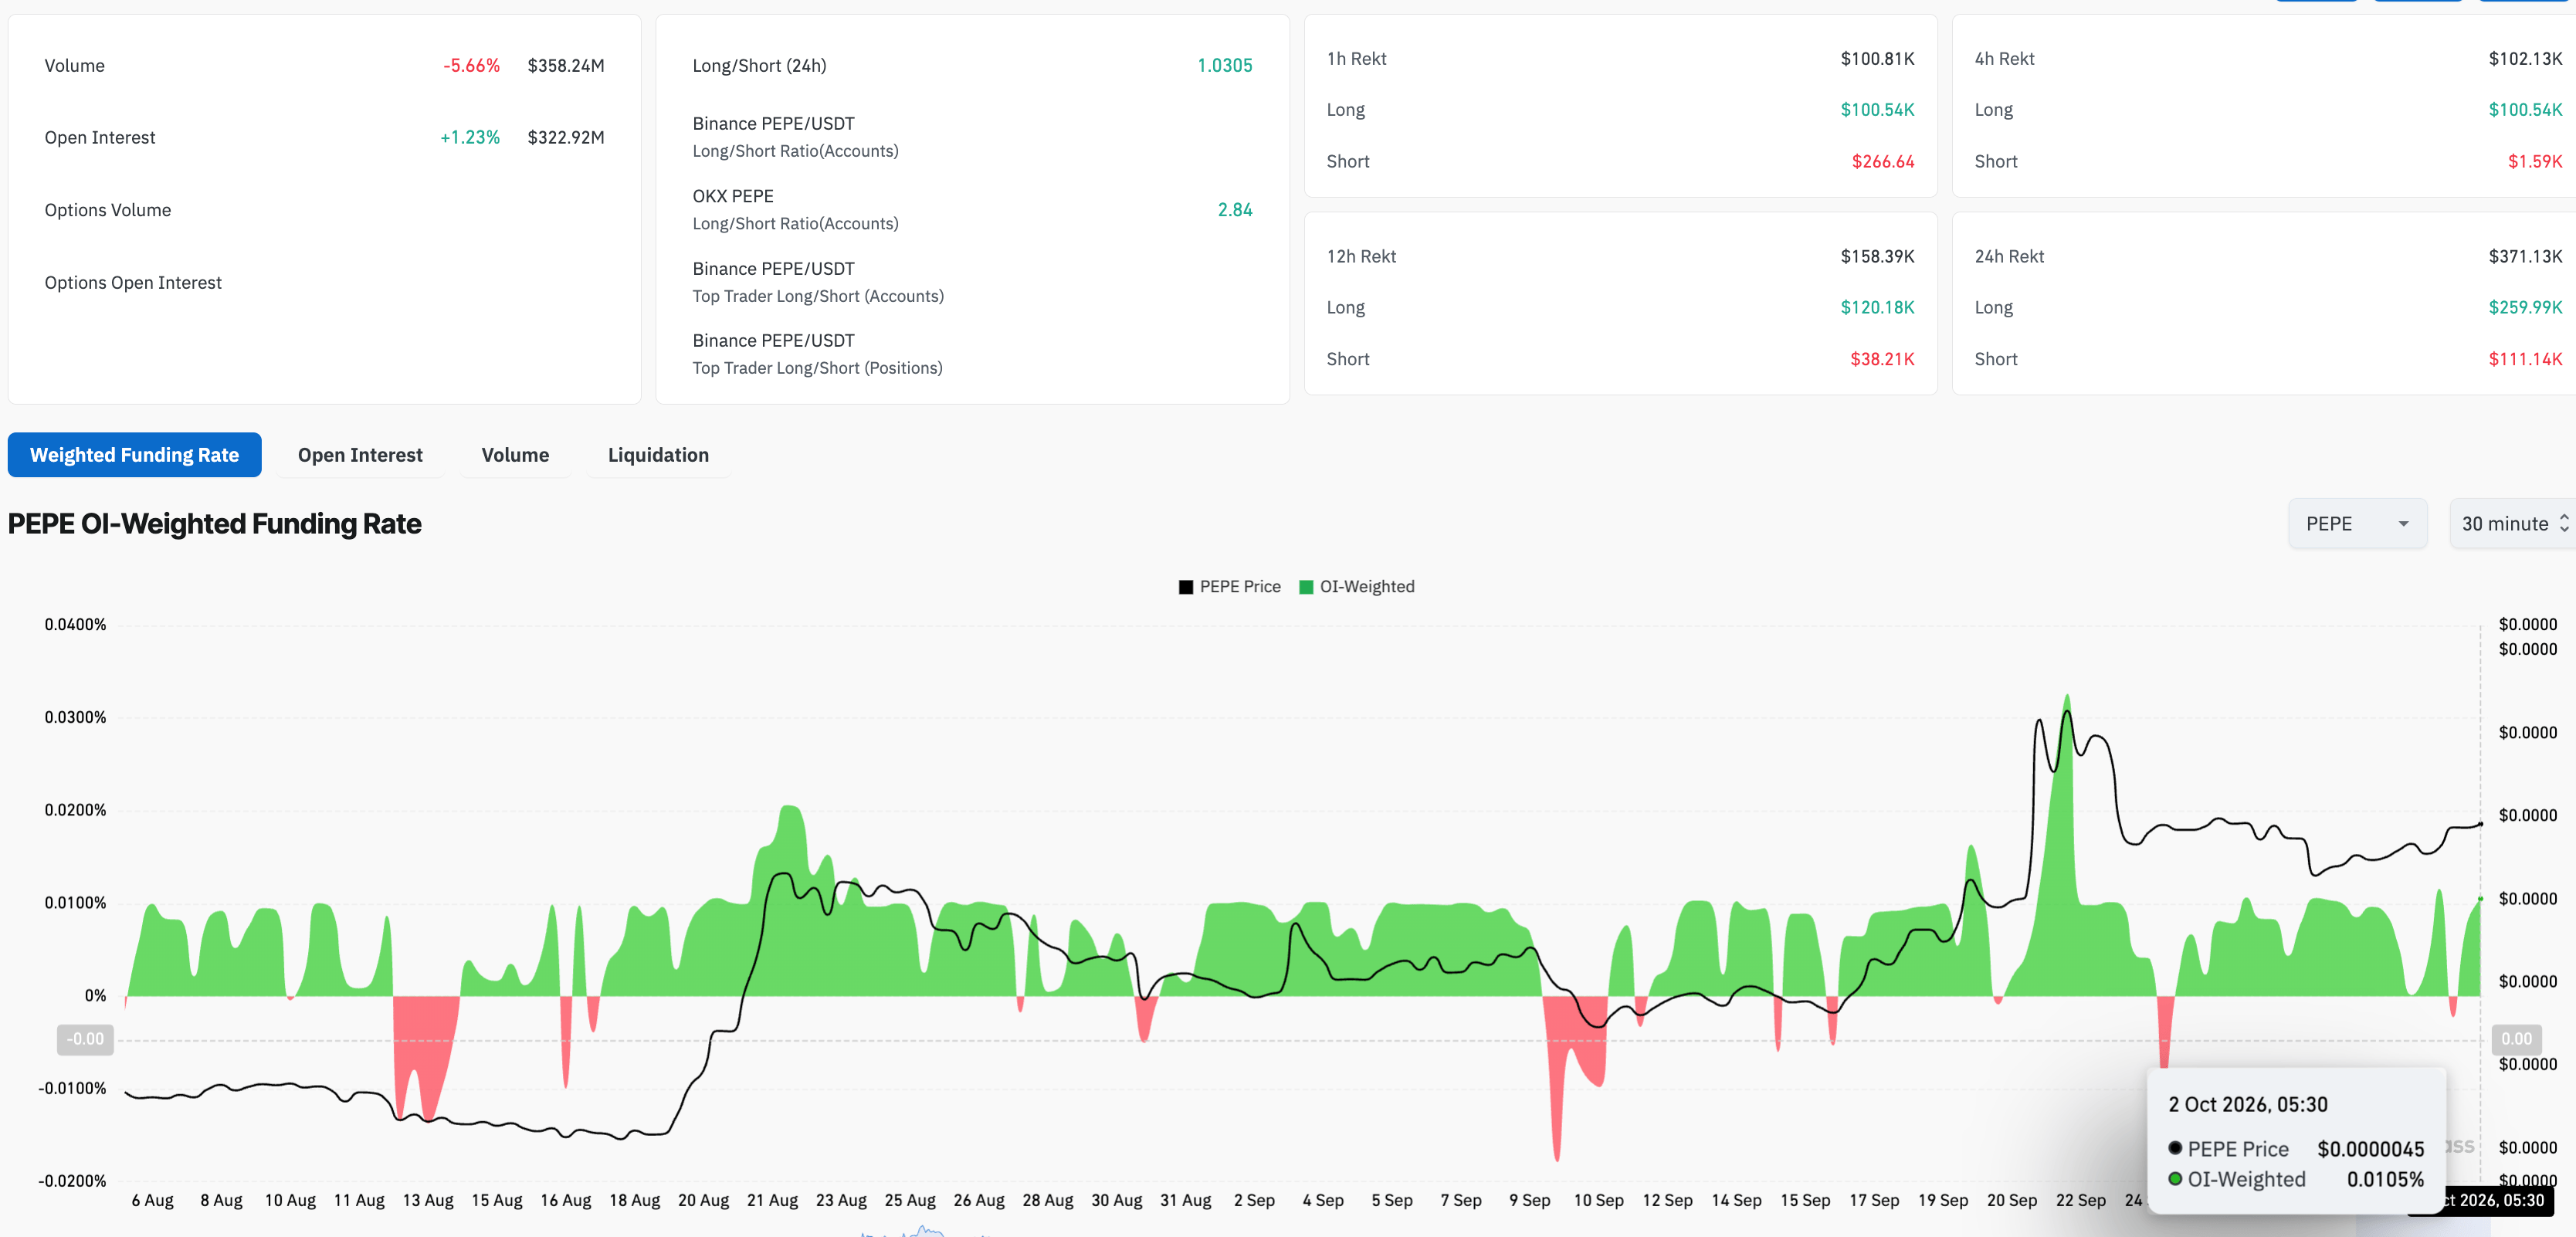
- Derivatives data shows firm positional buildup and a positive funding rate, suggesting firm retail demand.
- The technical outlook for PEPE is mildly bullish, with momentum recovering amid a Golden Cross.

Pepe (PEPE) price holds steady around $0.00000440 at press time on Friday, sustaining the 3.50% gains from the previous day's rebound. The meme coin maintains firm retail demand, with its futures Open Interest stabilizing above $320 million and funding rates remaining positive. PEPE must reclaim the $0.00000500 psychological barrier to sustain an upward trend.
Retail hope stays alive
The frog-themed meme coin, the third-largest based on market capitalization, retains firm retail support. CoinGlass data shows that PEPE futures Open Interest (OI) edged marginally higher over the last 24 hours to $322.92 million, indicating a steady buildup of open positions. Meanwhile, the funding rate remains positive at 0.0109%, suggesting strong demand among traders to buy long positions at a premium.
Technical outlook: PEPE's mild recovery could set the next bull run in motion
Pepe trades around $0.00000445 at press time on Friday, maintaining a constructive near-term bullish bias. The meme coin trades in the green for the fourth consecutive day, extending its rebound from Tuesday's low at $0.00000406.
PEPE hovers well above the 50-, 100-, and 200-day Exponential Moving Averages (EMAs) at around $0.00000379, $0.00000354, and $0.00000373, respectively, supporting the upside bias. In addition, the Golden Cross pattern between the 50- and 200-day EMAs backs the bullish trend reversal.
The near-term rebound so far this week suggests a post-retest rebound from the broken long-term resistance trendline. This could translate into a steady recovery if Pepe reclaims the $0.00000500 barrier, which capped gains last week. A confirmed breakout could target the 161.8% and 200% Fibonacci extension levels at $0.00000567 and $0.00000650, measured from $0.00000456 to $0.00000320.
At the same time, the Relative Strength Index (RSI) around 56 suggests supportive momentum rather than outright exhaustion.
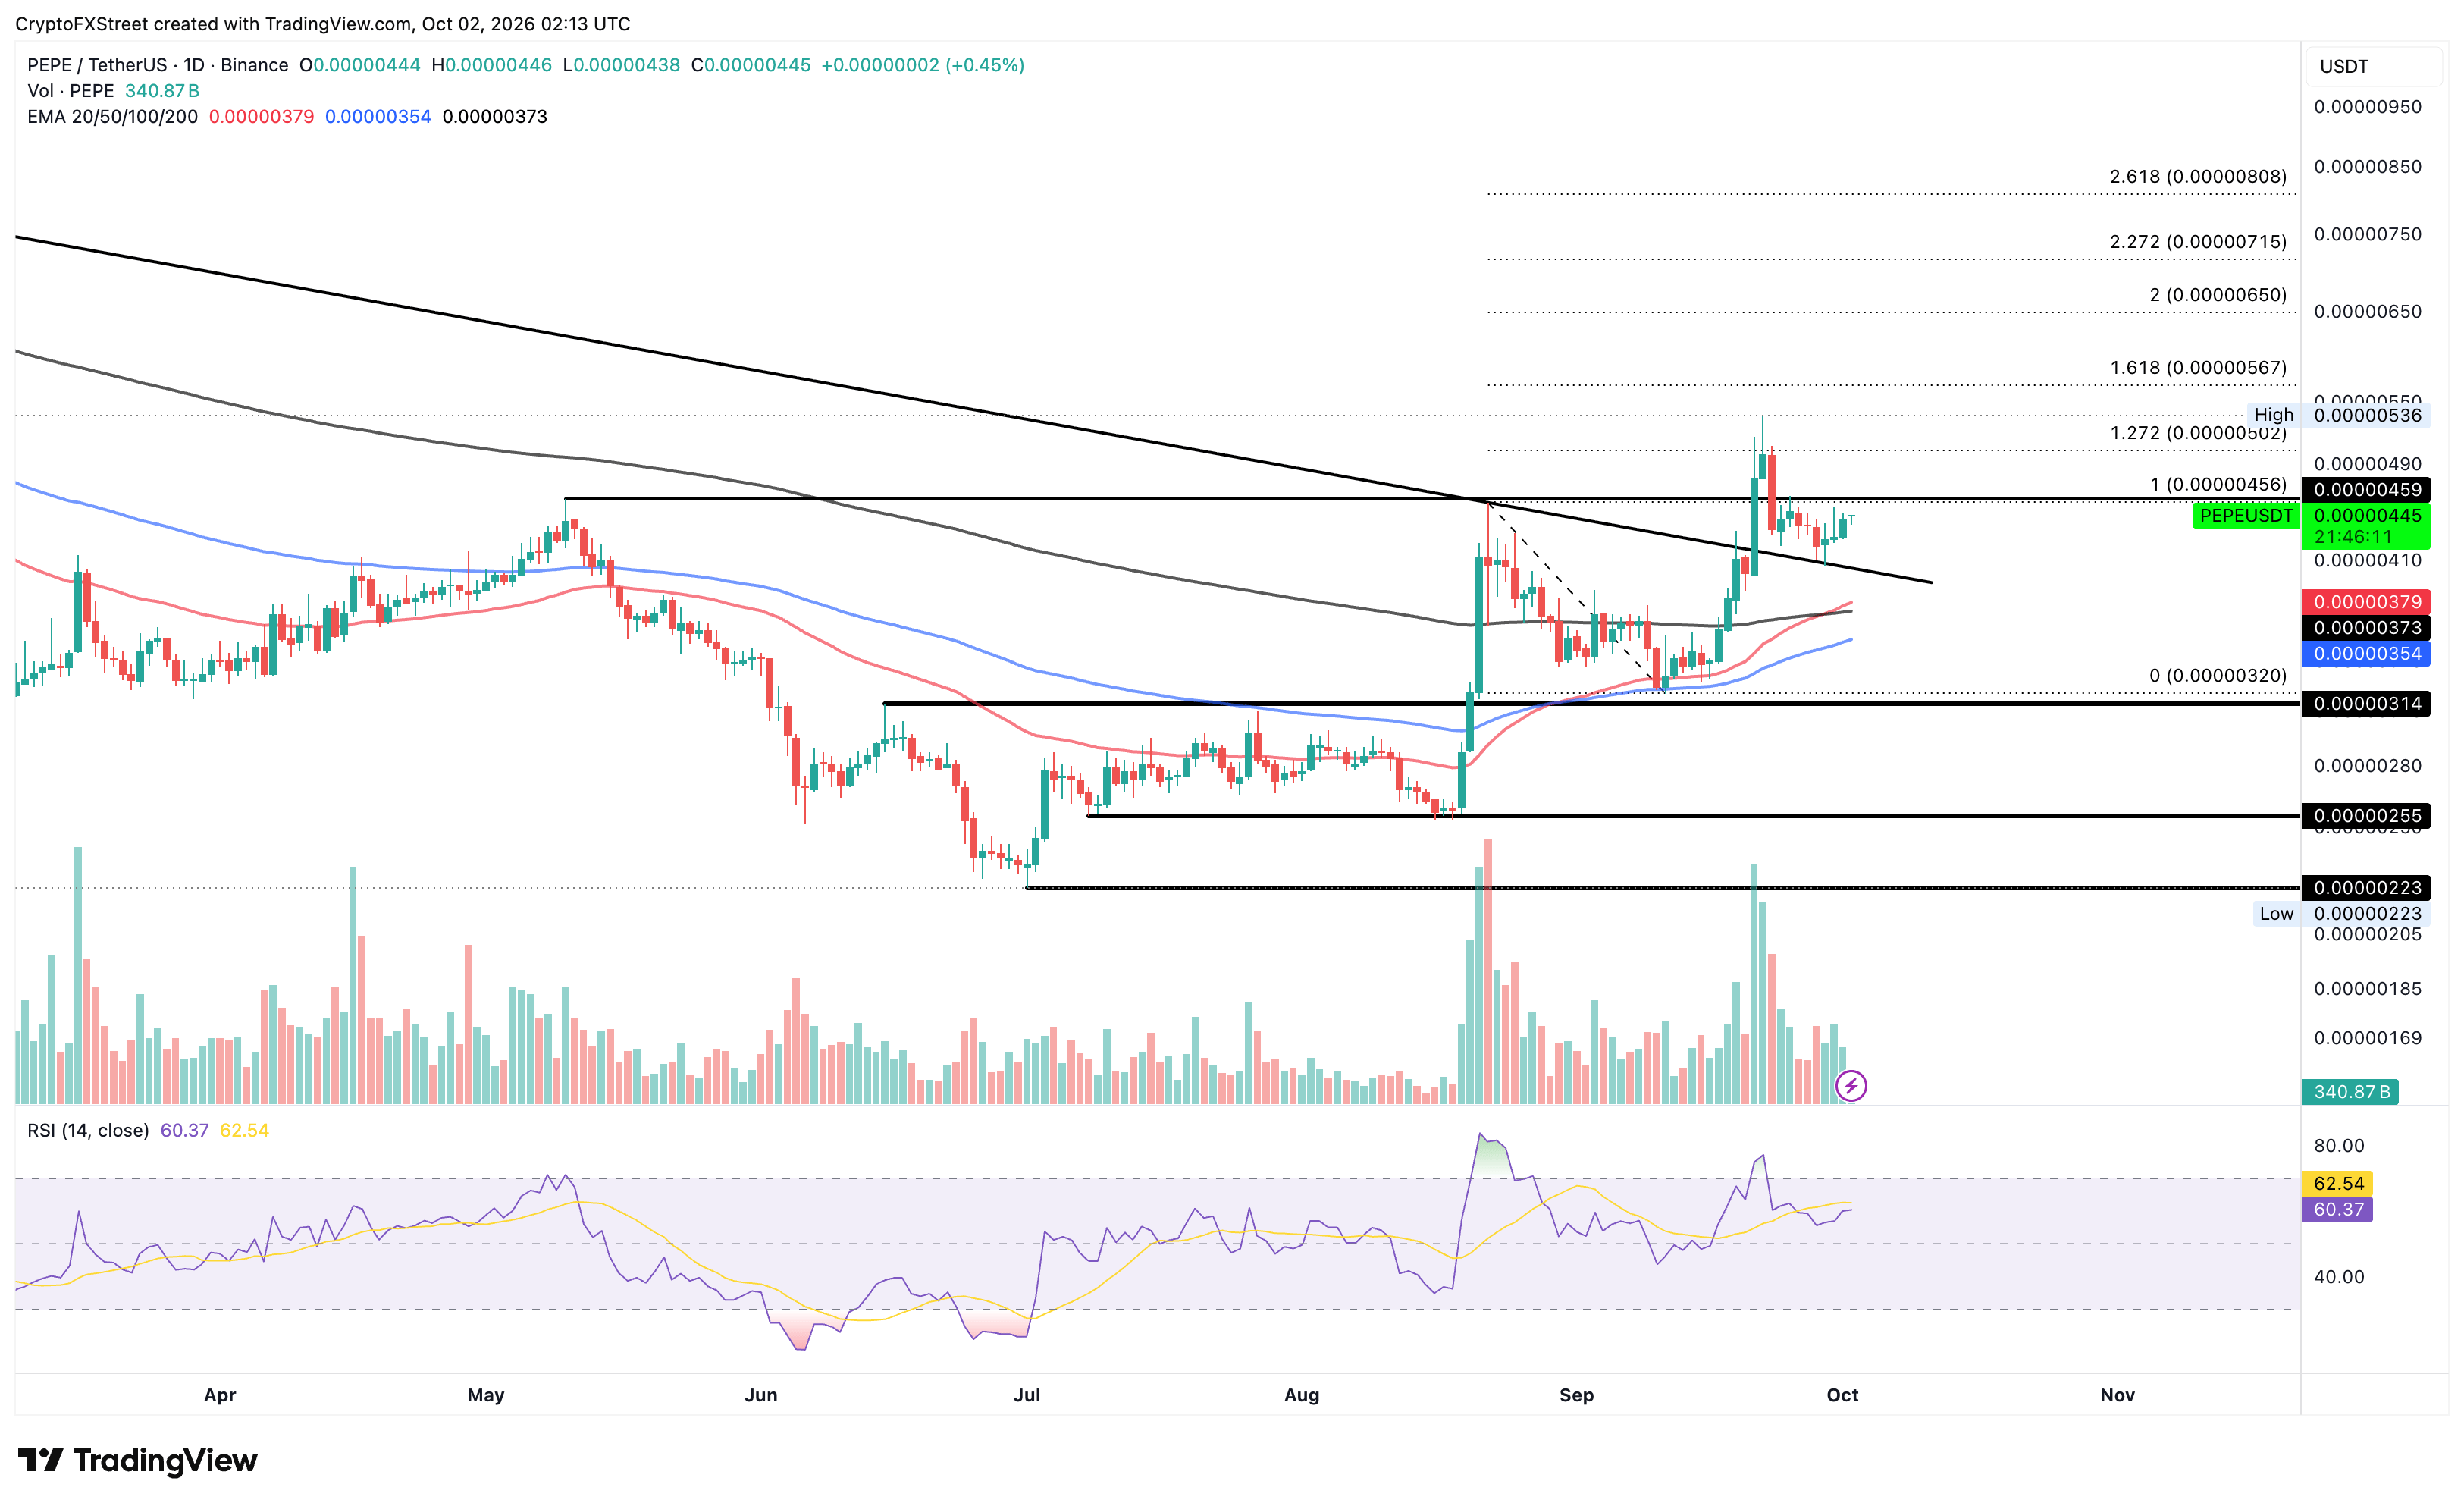
On the downside, initial support is seen at the $0.00000400 trendline break level, followed by the 50- and 200-day EMAs, which form a support cluster near $0.00000379 and $0.00000373.
(The technical analysis of this story was written with the help of an AI tool. Know more.)
Author

Vishal Dixit
FXStreet
Vishal Dixit holds a B.Sc. in Chemistry from Wilson College but found his true calling in the world of crypto.