Ethereum Price Forecast: ETH ranges as Citi raises target to $3,028
- Ethereum trades sideways between $2,600 and $2,800 as bulls strive to trigger another breakout.
- Citigroup has raised its 12-month Ethereum prediction from $2,240 to $3,028, citing slower but steady crypto inflows.
- Ethereum remains heavily supported by a firm dynamic moving-average cluster and rising momentum indicators.

Ethereum (ETH) is trading above $2,600 on Thursday, while short-term supply caps upside at $2,700 ahead of a higher limit at $2,800. The smart contracts token mirrors broader crypto price action, with Bitcoin (BTC) struggling to regain momentum above $83,000.
A breakout above the upper limit at $2,800 would encourage more traders to take on more risk, alleviating buyer exhaustion. Still, losses below the lower $2,600 range limit may trigger an extended sell-off.
Citi reviews 12-month Ethereum target upward
Citigroup has reportedly raised its 12-month Ethereum forecast to $3,028, from $2,240, according to Reuters. The bank highlighted strong crypto activity, a positive macroeconomic environment and the resumption of inflows into spot Exchange-Traded Funds (ETFs) as factors supporting Ethereum’s outlook.
The report dated Wednesday anticipates $5 billion in inflows into crypto ETFs over the next 12 months. However, the investment bank said that inflows could be slow but steady.
On the failed CLARITY Act in the United States (US), Citi said key US agencies cushioned the setback, including the Securities and Exchange Commission (SEC) and the Commodity Futures Trading Commission (CFTC), stepping up their mandates with announcements intended to regulate cryptocurrencies within their existing authority.
"The Clarity Act's failure narrowed the path to a market-structure bill, yet spurred Securities and Exchange Commission rule announcements that dampened negative sentiment," Citi said.
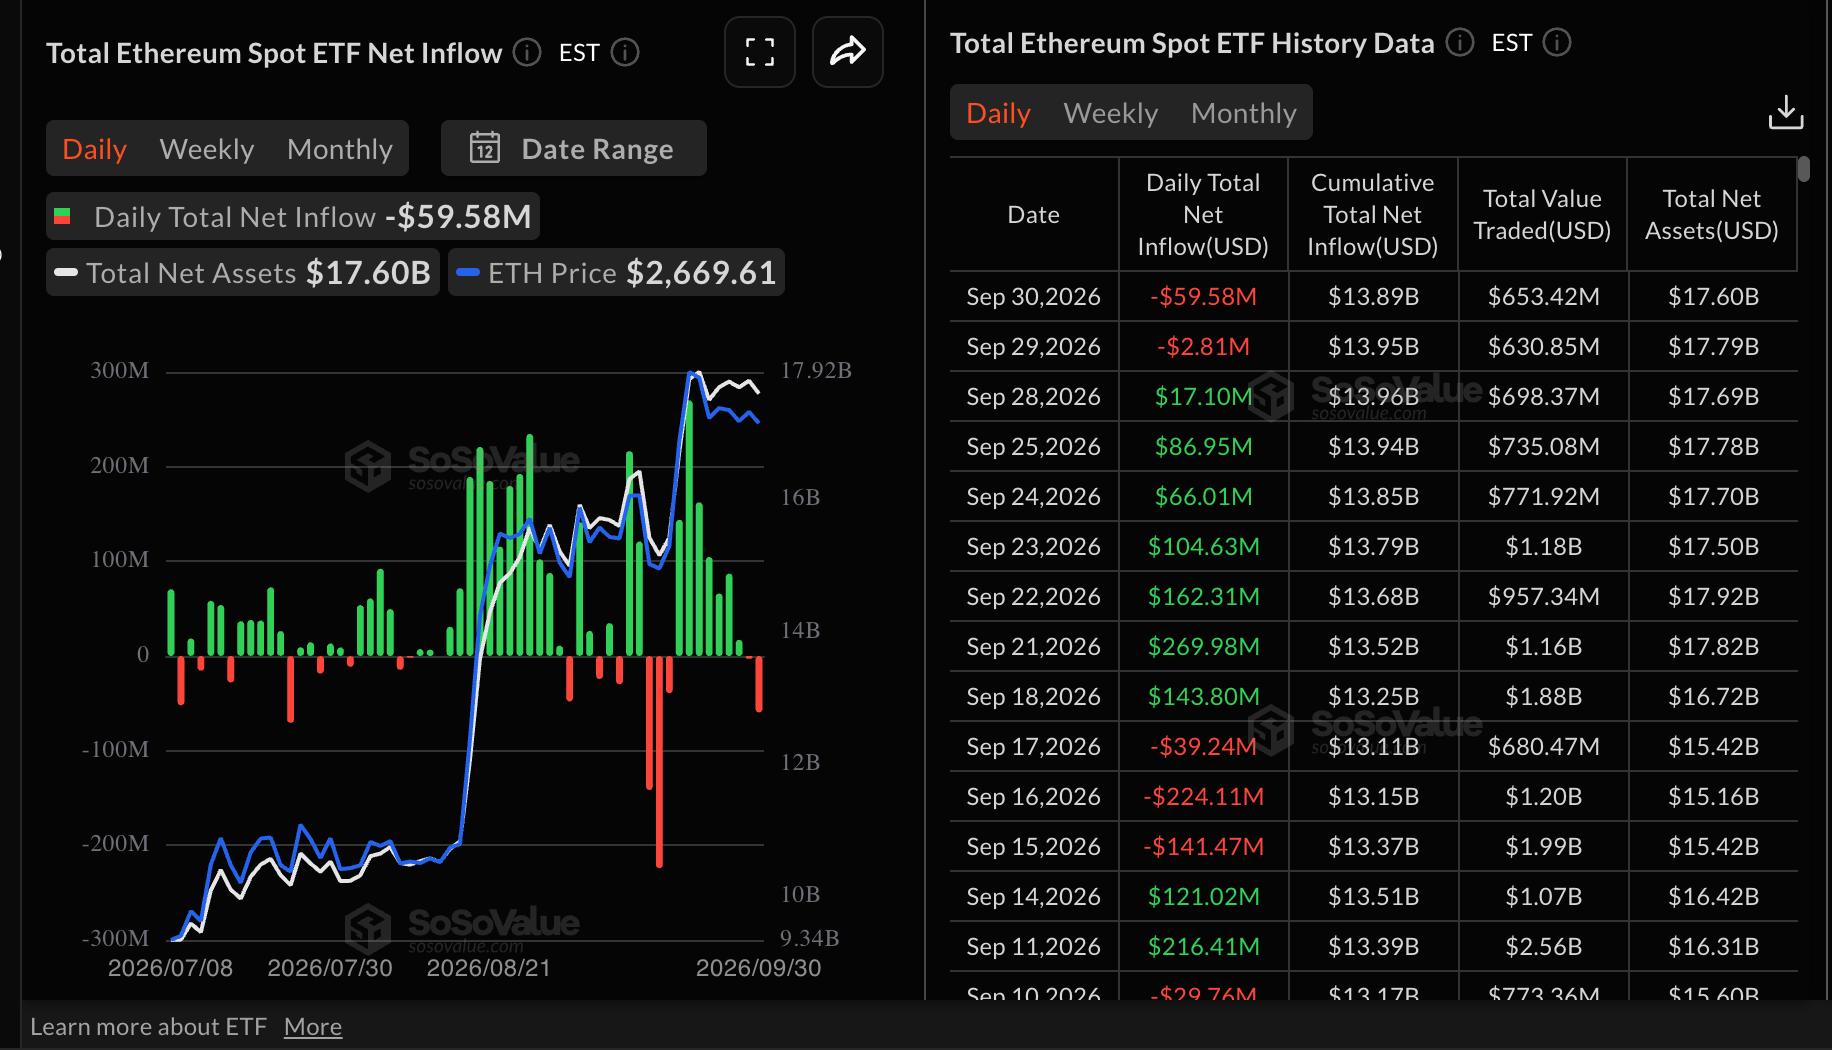
Meanwhile, Ethereum spot ETFs extended a new outflow streak for the second consecutive day as investors withdrew roughly $60 million on Wednesday and $3 million the day before. Despite the outflows, cumulative inflows stand at $14 billion, with net assets under management averaging $18 billion, according to SoSoValue.
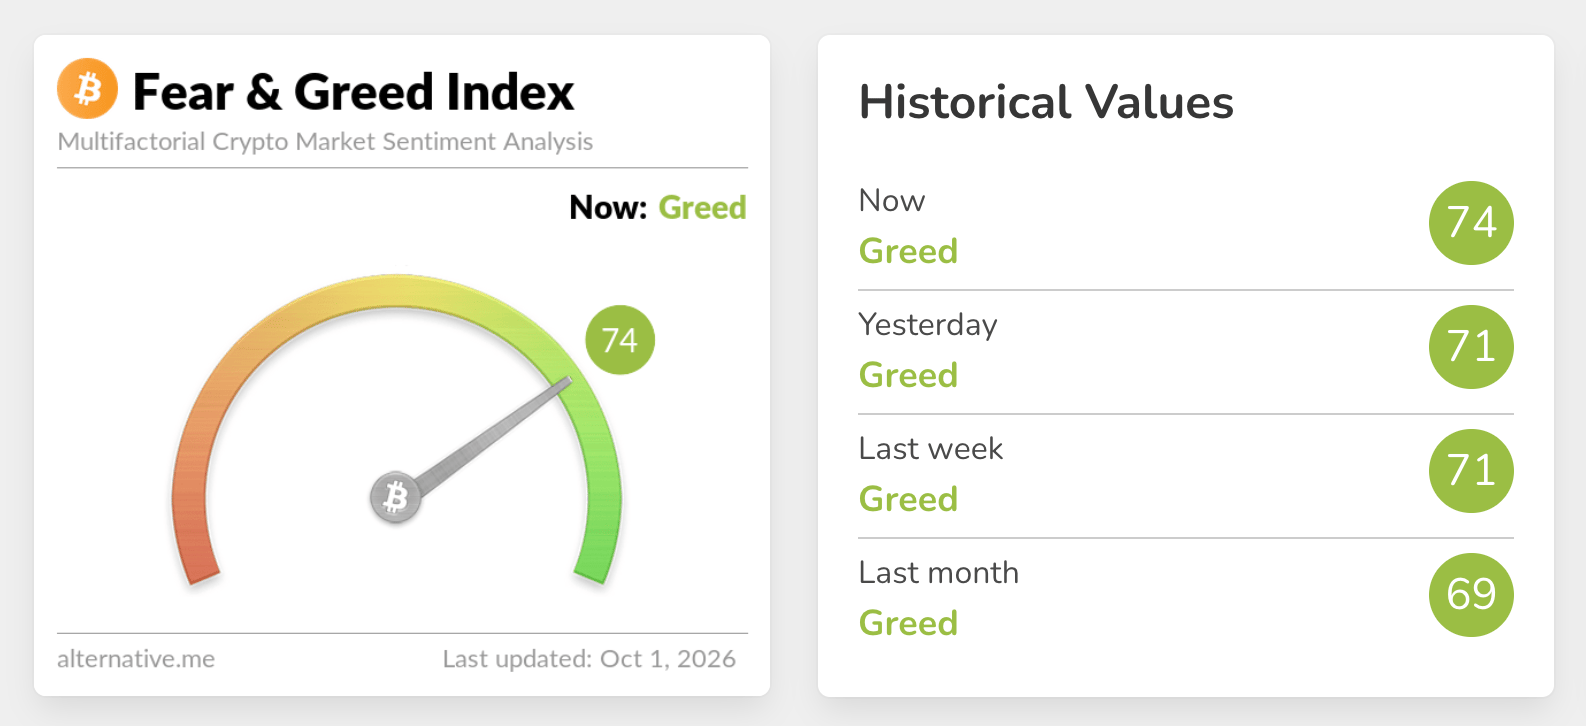
Appetite for digital assets remains elevated, as reflected in the Fear & Greed Index, which sits at 74 in the Greed territory on Thursday, up only slightly from 71 the day before. Higher risk-on sentiment suggests buy-side pressure could help stabilize crypto prices, increasing the odds of Ethereum’s recovery.
Technical analysis: Ethereum consolidates
Ethereum trades at $2,689, maintaining a constructive bullish bias despite remaining range-bound between $2,600 and $2,800. The pair holds well above the 50-day, 100-day and 200-day Exponential Moving Averages (EMAs), while the SuperTrend line at $2,434 reinforces this underlying support structure.
Moreover, the Relative Strength Index (RSI) near 63 suggests healthy, but not extreme, positive momentum. However, the Moving Average Convergence Divergence (MACD) remains slightly negative, suggesting upside continuation could proceed at a more moderate pace.
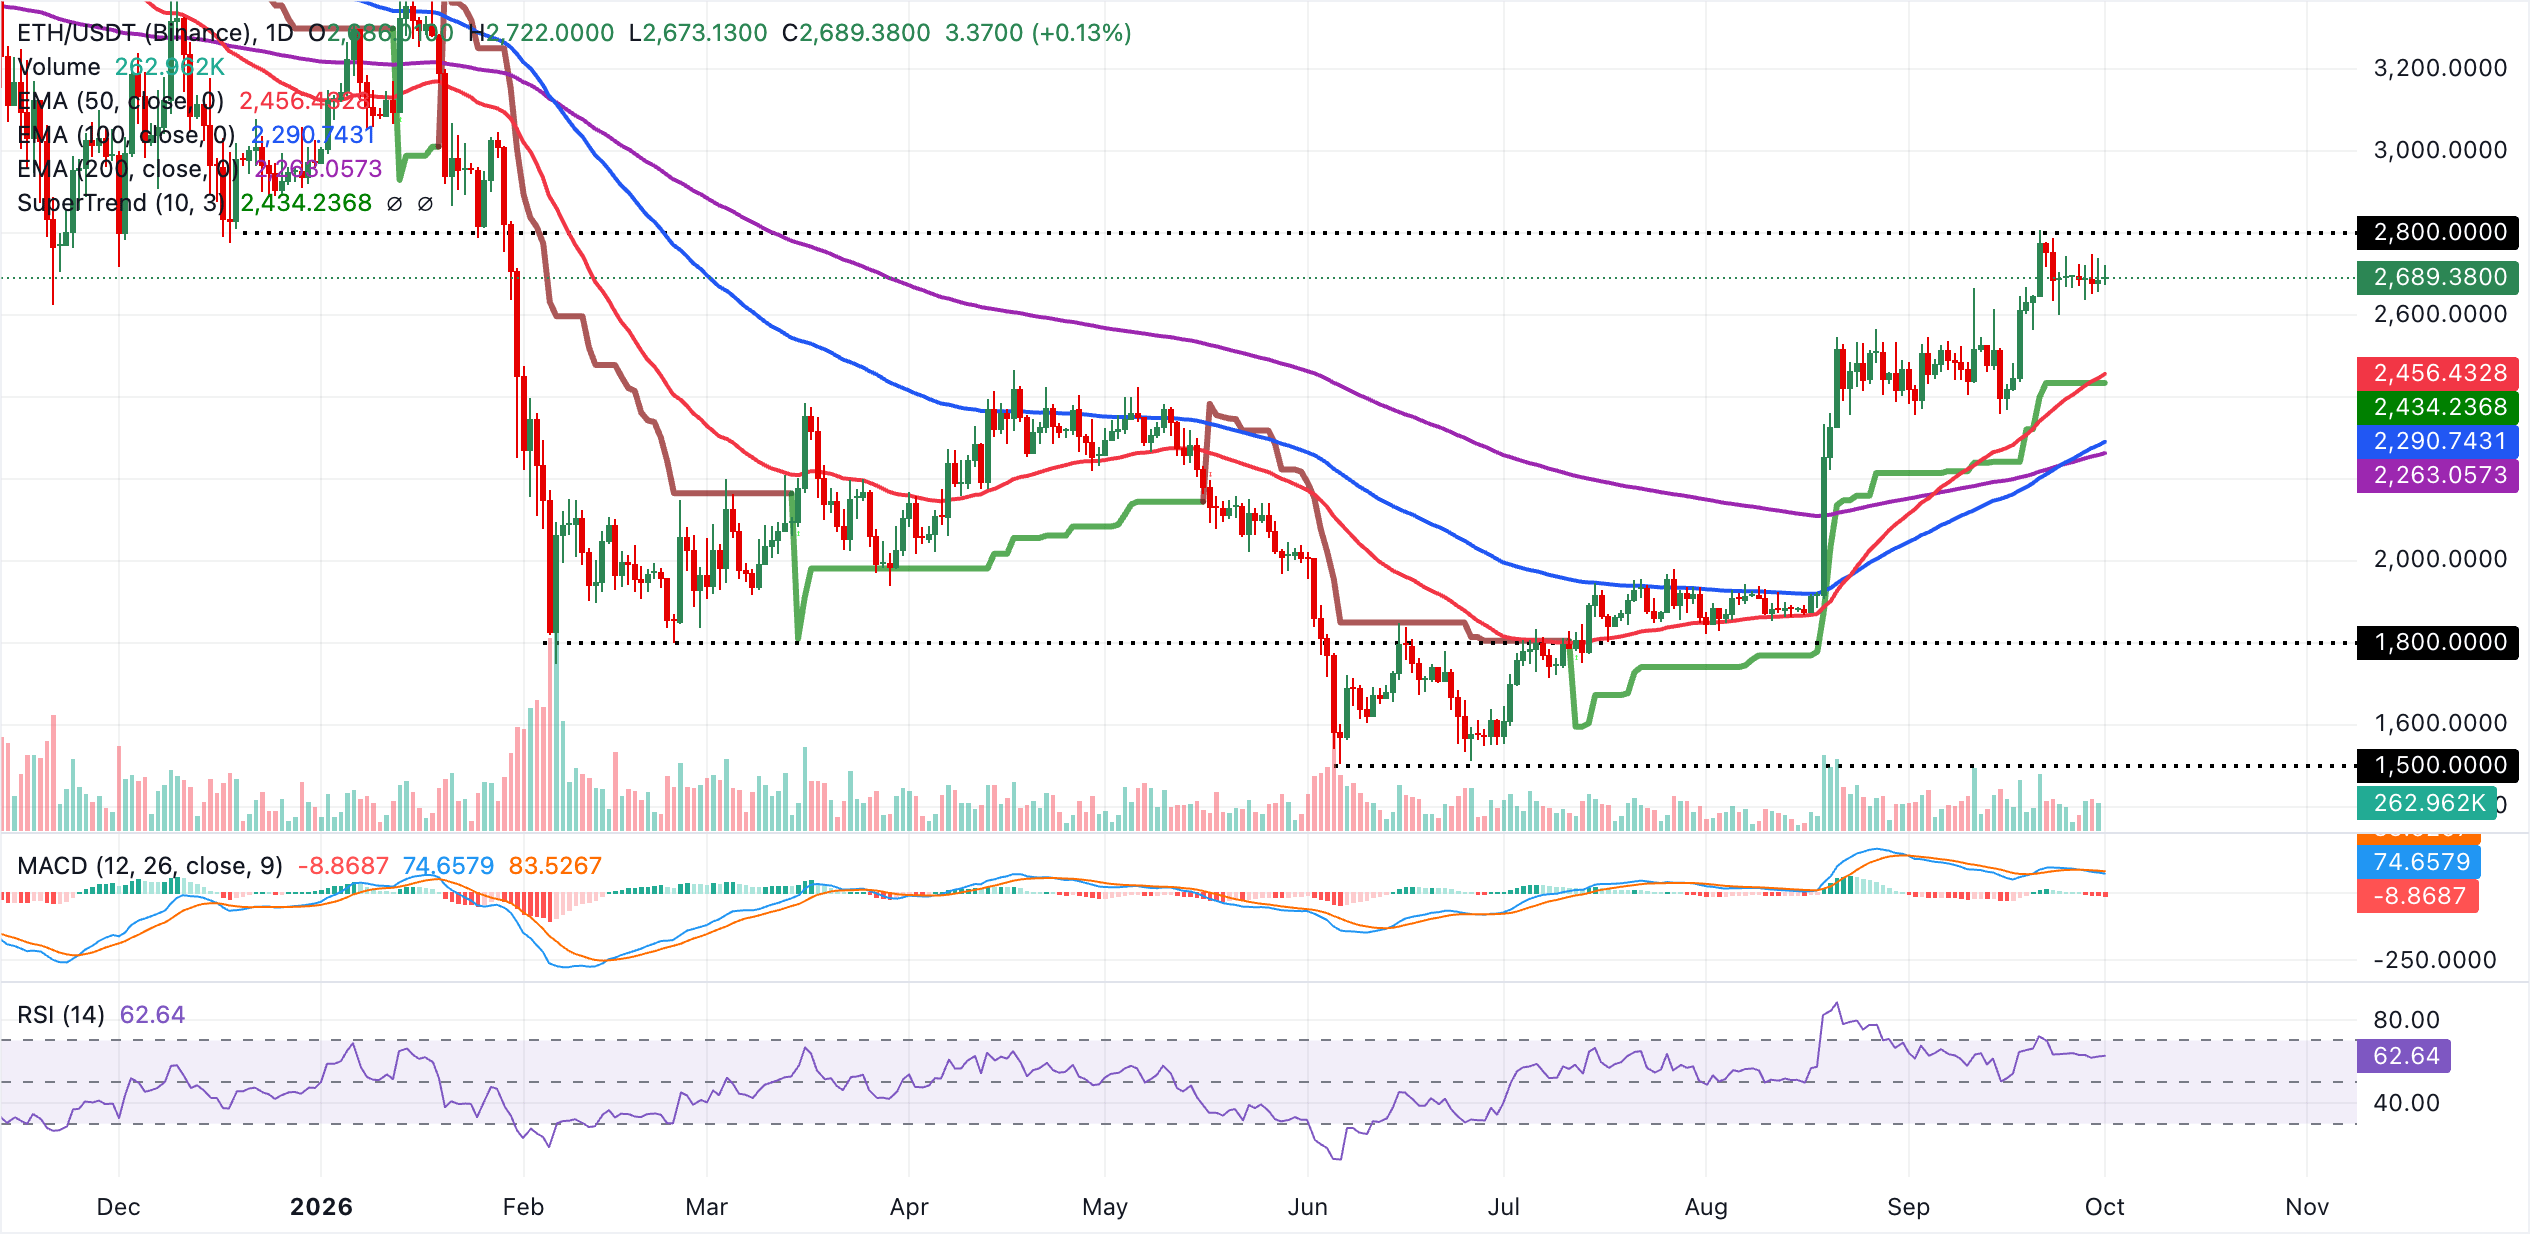
Initial structural support lies at the SuperTrend zone around $2,434, closely backed by the 50-day EMA at $2,456, forming a dense demand cluster likely to attract buyers on shallow pullbacks. Below that, deeper support is defined by the 100-day EMA at $2,291 and the 200-day EMA at $2,263, where a stronger corrective move may stall as long as the broader bullish structure remains intact.
In the weekly chart, Ethereum maintains a bullish near-term bias as price holds above the 50-week, 100-week and 200-week EMAs. Momentum remains supportive, with the RSI hovering near 64 and the MACD line holding in positive territory, suggesting upside pressure remains intact.
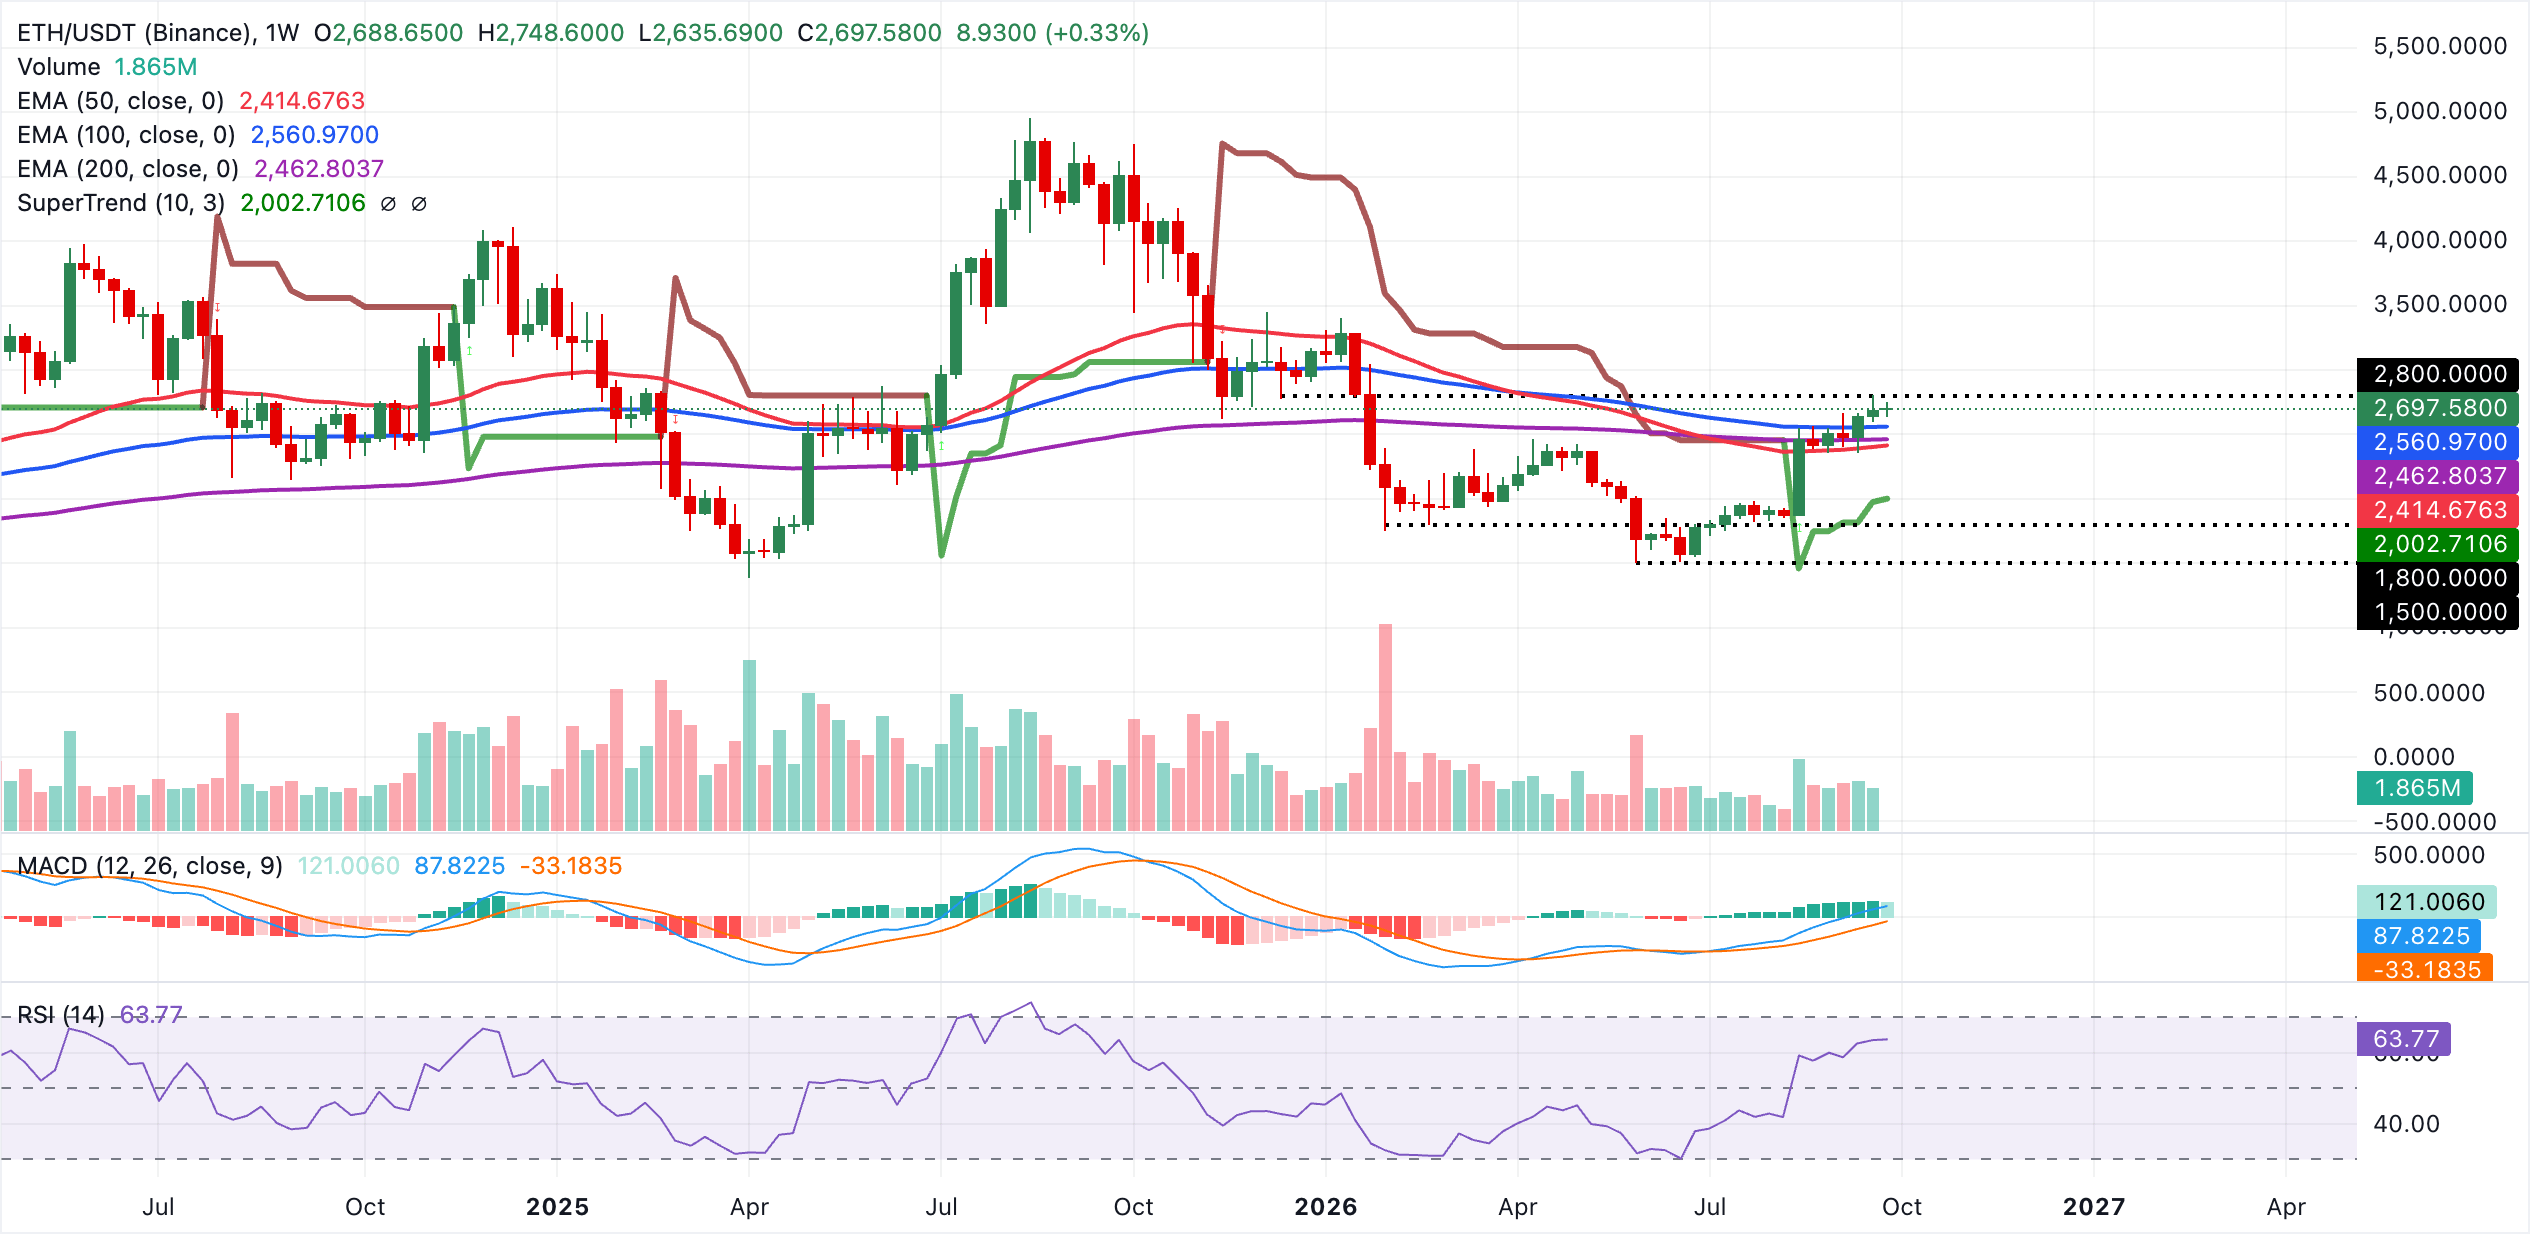
Initial support lies at the 100-week EMA near $2,561, followed by the 200-week EMA around $2,463 and the 50-week EMA close to $2,415, all of which reinforce a layered demand zone beneath spot, ahead of the more distant SuperTrend support near $2,003.
(The technical analysis of this story was written with the help of an AI tool. Know more.)
Cryptocurrency metrics FAQs
The developer or creator of each cryptocurrency decides on the total number of tokens that can be minted or issued. Only a certain number of these assets can be minted by mining, staking or other mechanisms. This is defined by the algorithm of the underlying blockchain technology. On the other hand, circulating supply can also be decreased via actions such as burning tokens, or mistakenly sending assets to addresses of other incompatible blockchains.
Market capitalization is the result of multiplying the circulating supply of a certain asset by the asset’s current market value.
Trading volume refers to the total number of tokens for a specific asset that has been transacted or exchanged between buyers and sellers within set trading hours, for example, 24 hours. It is used to gauge market sentiment, this metric combines all volumes on centralized exchanges and decentralized exchanges. Increasing trading volume often denotes the demand for a certain asset as more people are buying and selling the cryptocurrency.
Funding rates are a concept designed to encourage traders to take positions and ensure perpetual contract prices match spot markets. It defines a mechanism by exchanges to ensure that future prices and index prices periodic payments regularly converge. When the funding rate is positive, the price of the perpetual contract is higher than the mark price. This means traders who are bullish and have opened long positions pay traders who are in short positions. On the other hand, a negative funding rate means perpetual prices are below the mark price, and hence traders with short positions pay traders who have opened long positions.
Author

John Isige
FXStreet
John Isige is a seasoned cryptocurrency journalist and markets analyst committed to delivering high-quality, actionable insights tailored to traders, investors, and crypto enthusiasts. He enjoys deep dives into emerging Web3 tren