Ripple Price Forecast: XRP risks deeper losses below $1.50
- XRP trades below $1.50 as bulls struggle to regain momentum.
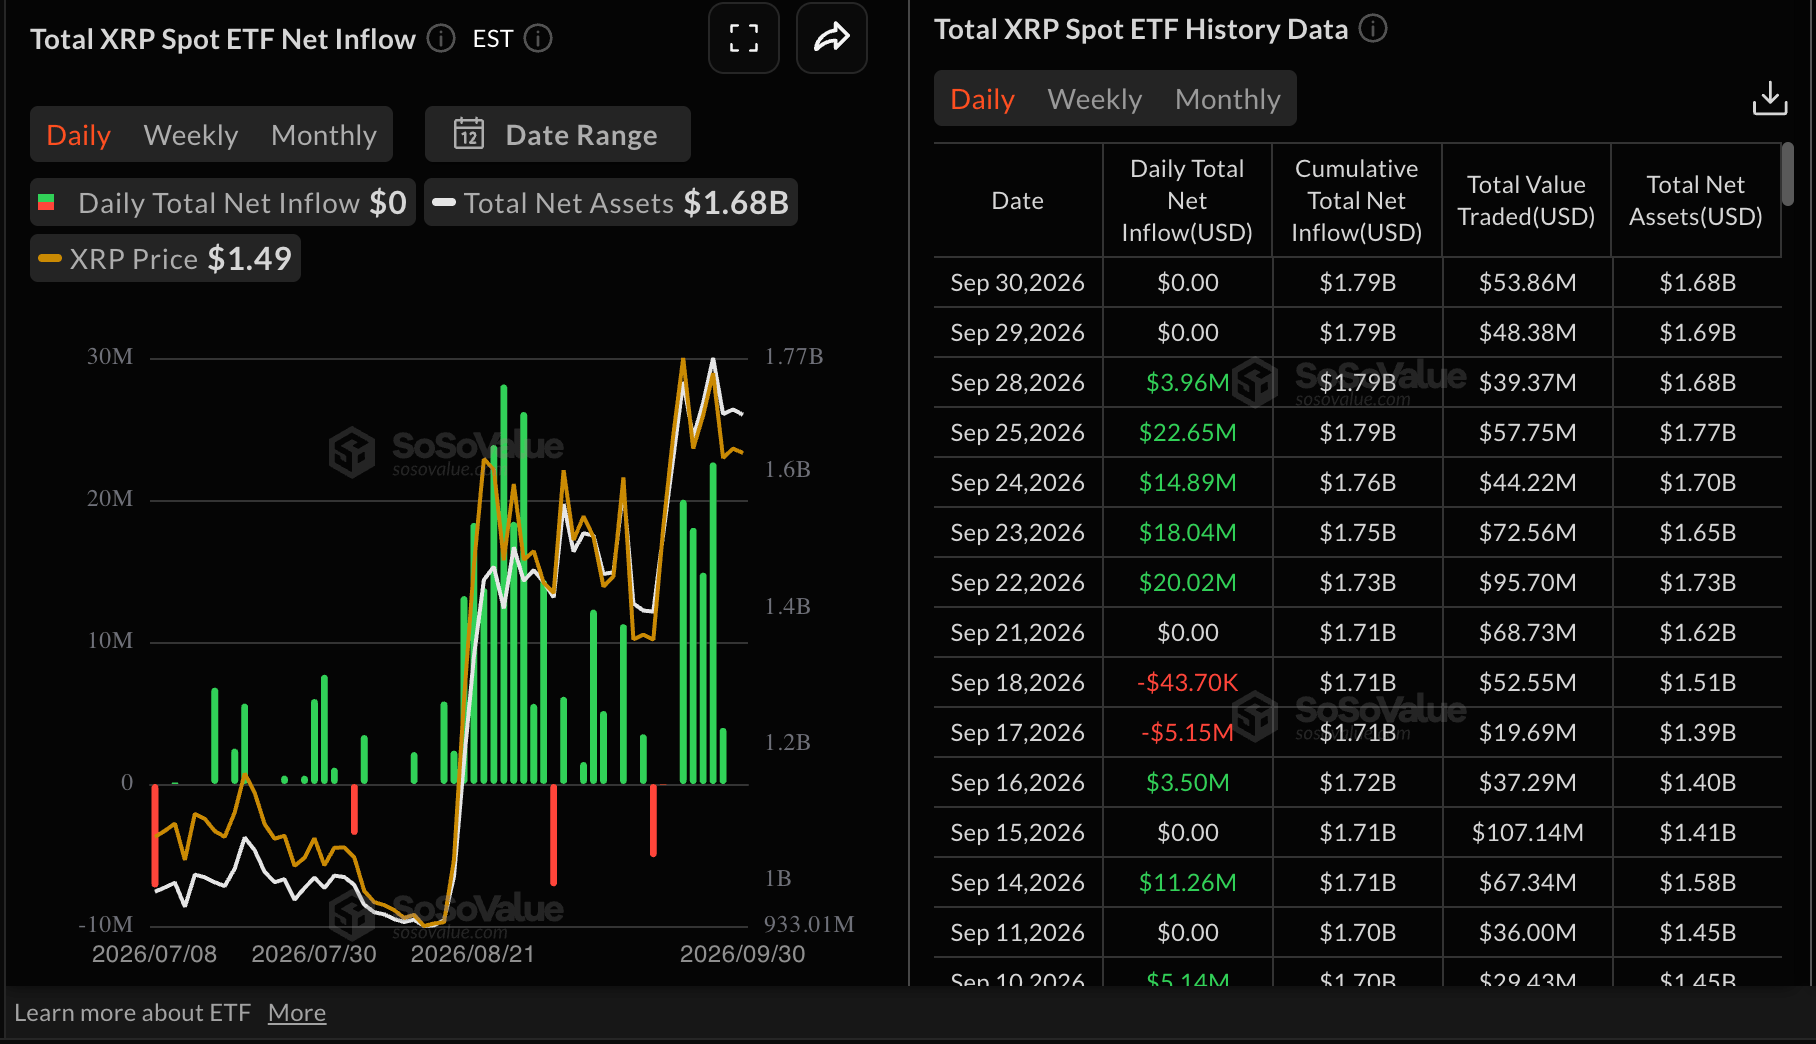
- Institutions sidestep XRP as muted ETF activity extends for the second straight day.
- The MACD confirms a sell signal, but uptrending moving averages could provide dynamic support.

Ripple (XRP) shows signs of weakness as it slides below $1.50 on Thursday. The correction from September highs of $1.66 aligns with recent struggles faced by major assets Bitcoin (BTC) and Ethereum (ETH). BTC currently trades above $83,000 while its upside is capped below $85,000. As for ETH, the smart contract token hovers between a narrow $2,600-$2,700 range.
A sustained recovery above $1.50 would boost XRP’s short-term bullish outlook. Still, it is too early to rule out deeper losses below $1.48, the first psychological support, especially with cooling institutional demand.
XRP ETF demand cools after inflow streak
XRP spot Exchange-Traded Funds (ETFs) remained muted on Wednesday and Tuesday after five consecutive days of inflows. The lack of appetite for the US-listed ETFs follows a five-day inflow streak, which helped cushion the token from accelerating losses. Still, with cumulative inflows near a record $1.8 billion and net assets at $1.7 billion, investors appear to maintain a long-term positive outlook on XRP.
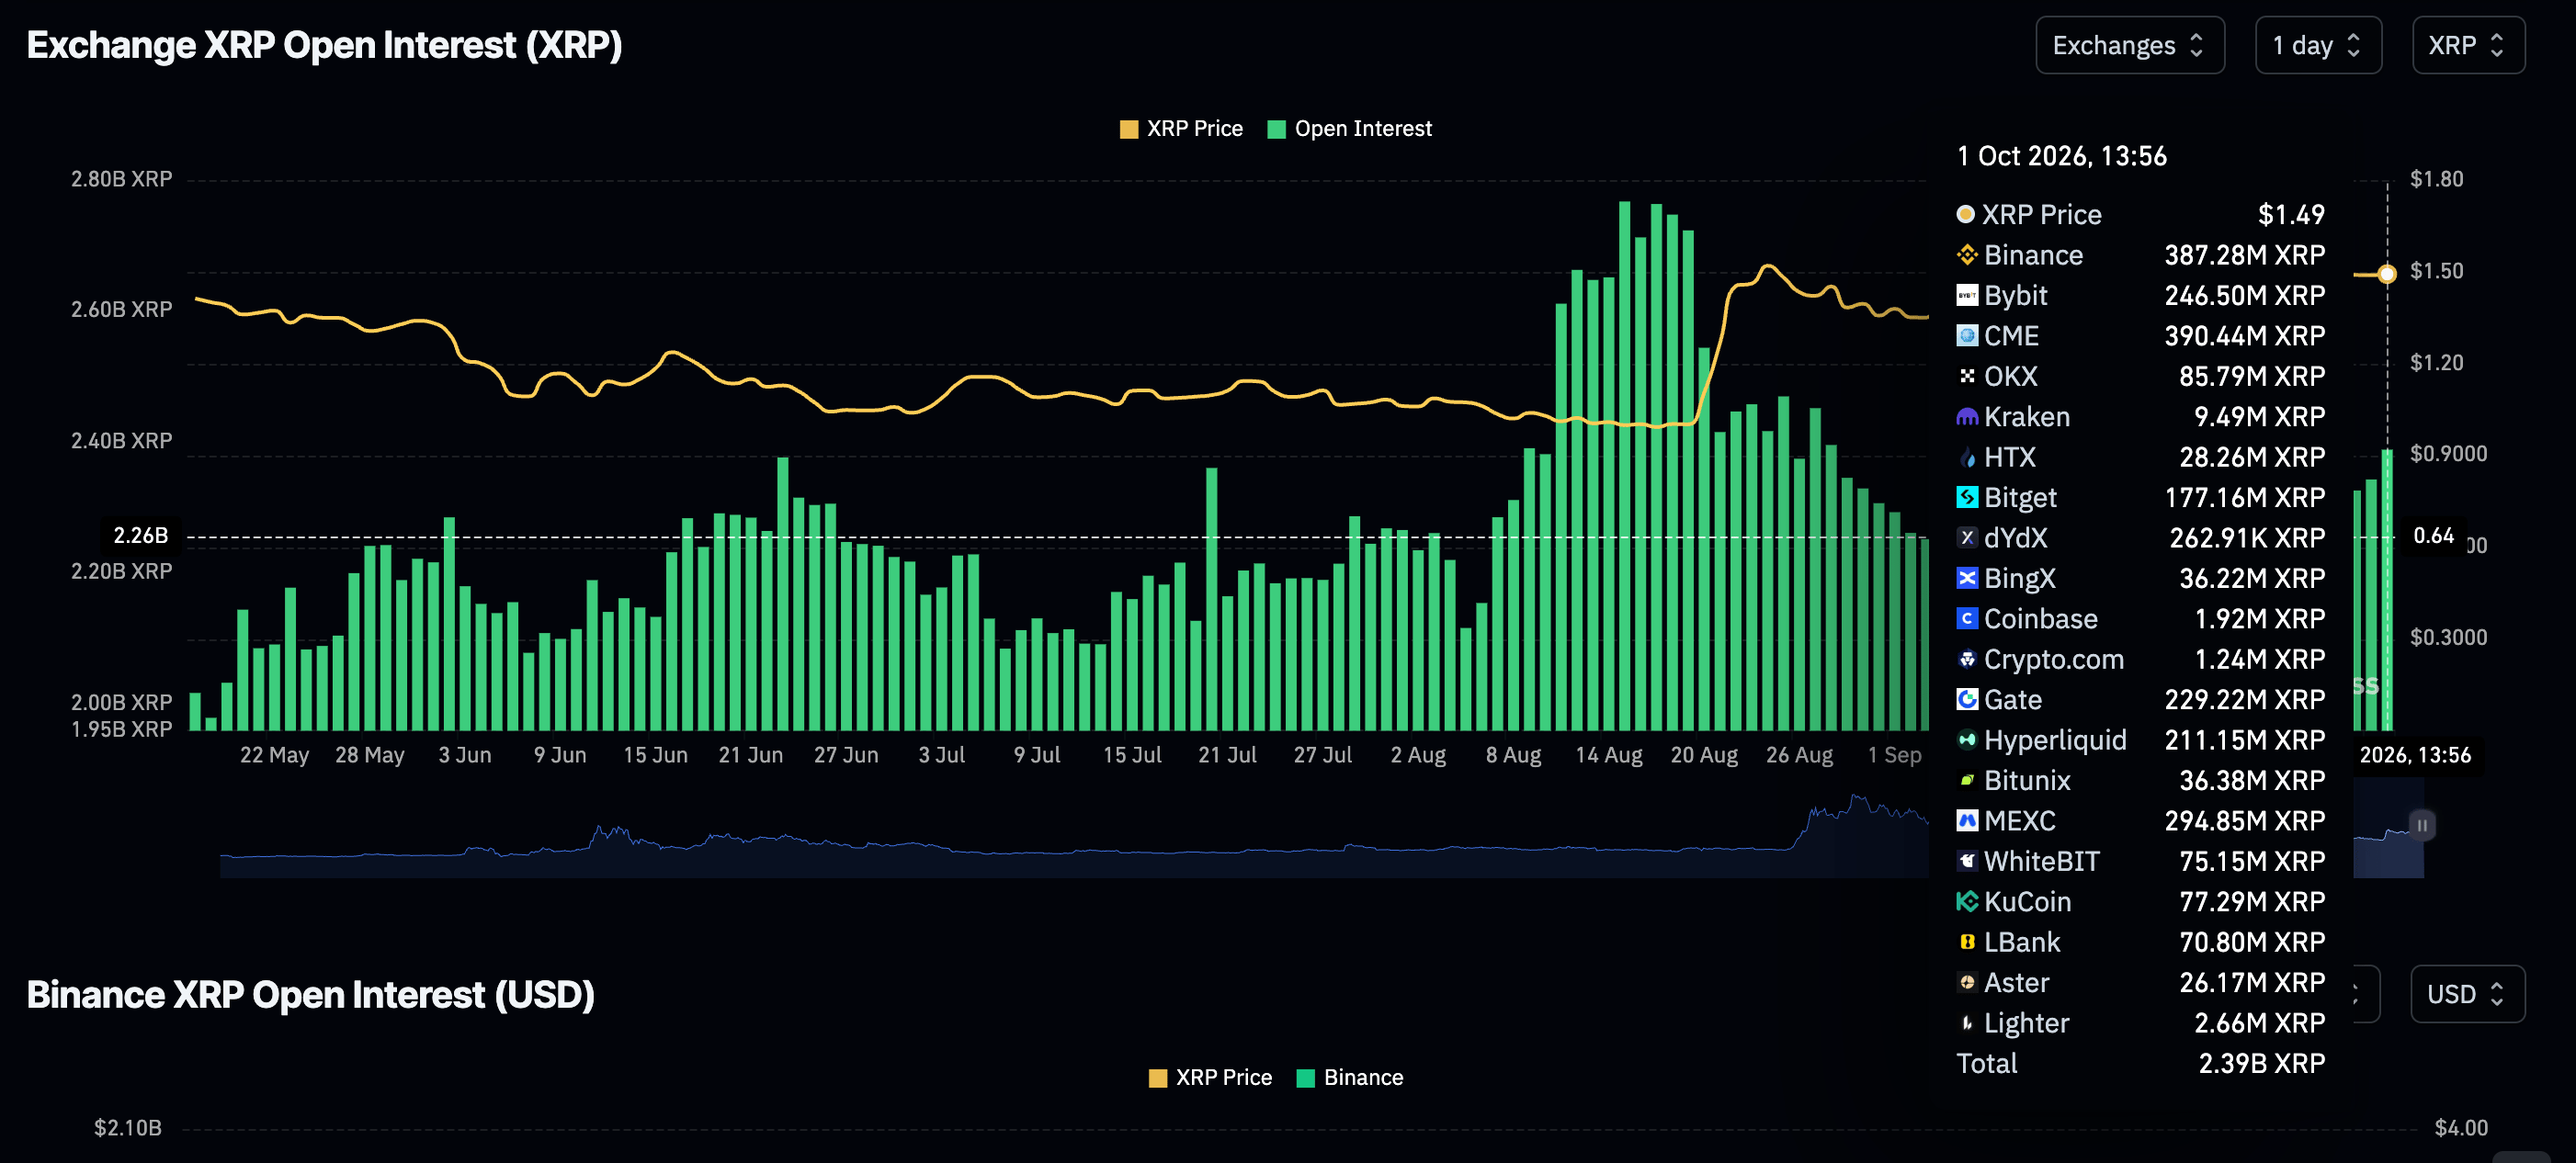
The derivatives market, on the other hand, paints a slightly positive picture, given that perpetual futures Open Interest (OI) has climbed to 2.39 billion XRP on Thursday, from 2.33 billion XRP the day before.
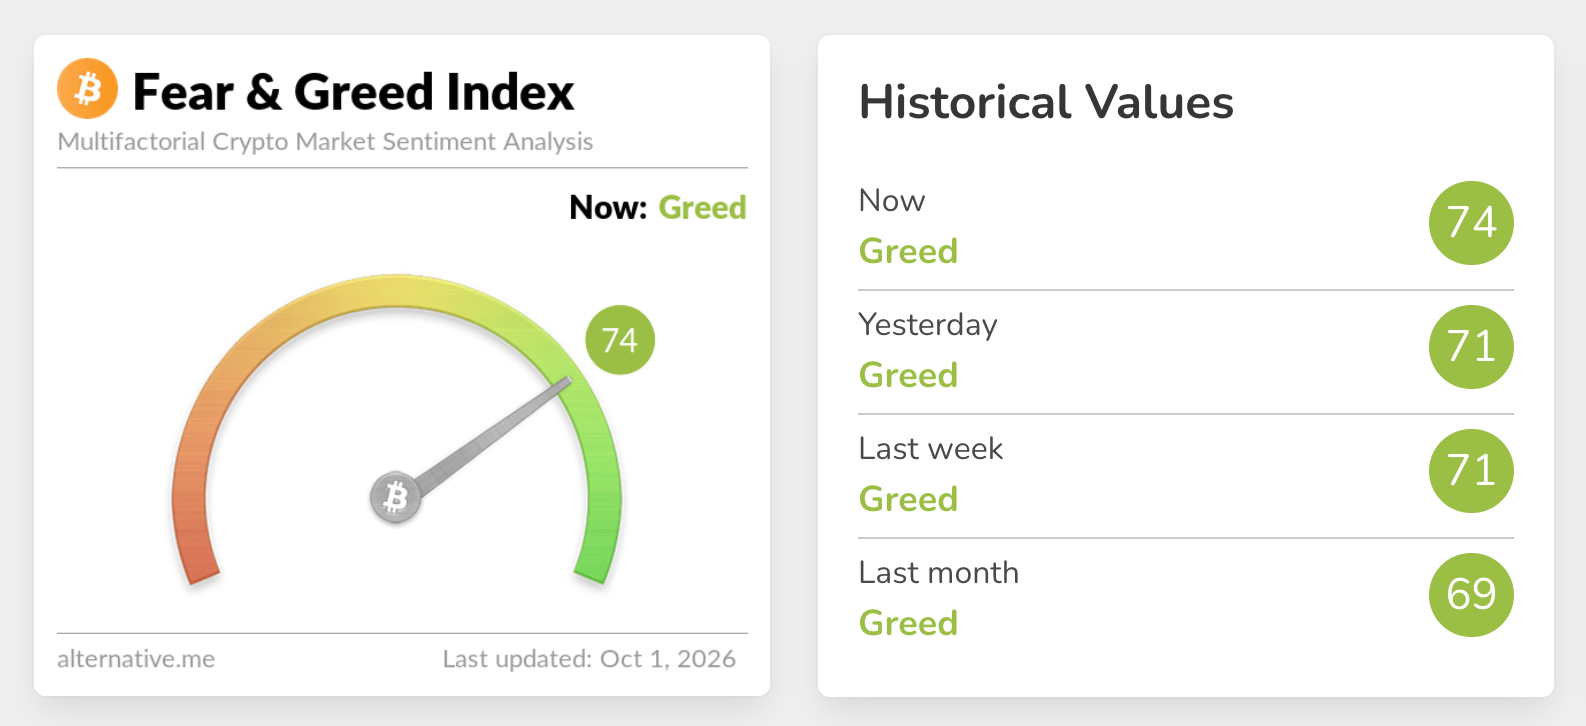
Broadly, appetite for digital assets remains elevated, as reflected in the Fear & Greed Index, which sits at 74 in the Greed territory on Thursday, up only slightly from 71 the day before. Higher risk-on sentiment suggests that buy-side pressure could help stabilize prices in the crypto market, increasing the odds of XRP’s recovery.
Technical analysis: XRP trades amid growing selling pressure
XRP hovers below the pivotal $1.50 level as sell-side pressure intensifies in the broader crypto market. Despite the correction from September highs of $1.66, the pair holds above the 50-day Exponential Moving Average (EMA) and the 200-day EMA, keeping the broader structure supported while it extends its recovery away from the SuperTrend line at $1.28.
The Relative Strength Index (RSI) around 56 hints at moderate bullish momentum, although the Moving Average Convergence Divergence (MACD) has slipped marginally back below the zero line, suggesting upside may be losing some near-term traction rather than fully reversing.
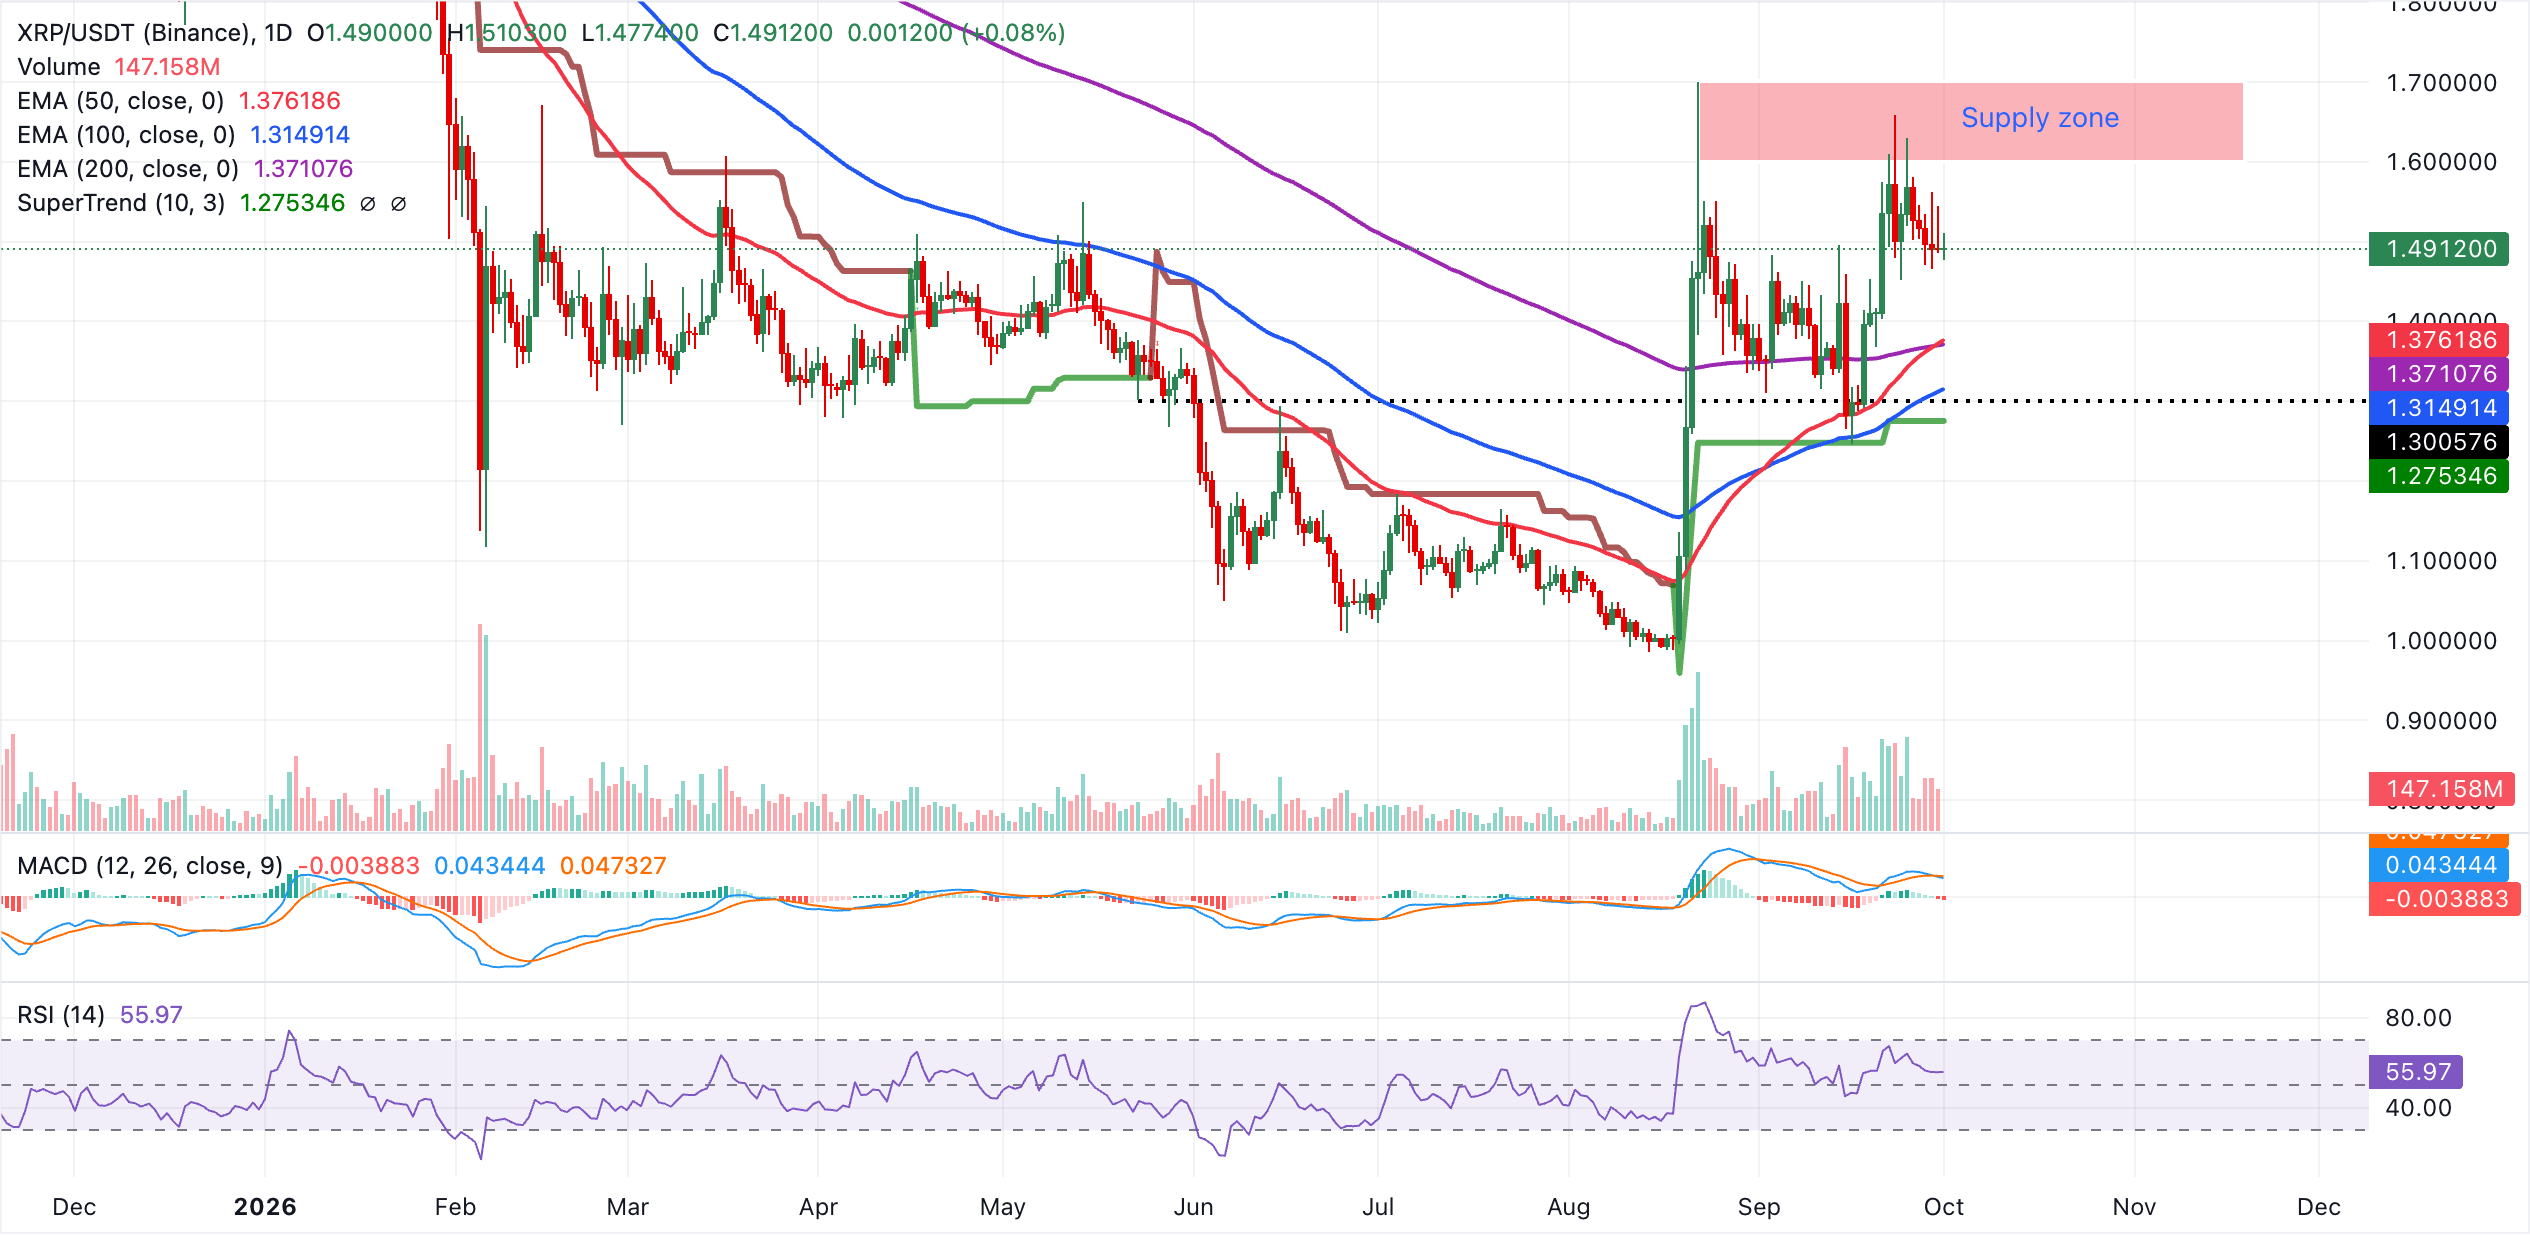
Immediate support is now aligned at the first psychological area around $1.48, with a deeper cushion emerging from the clustered 50-day and 200-day EMAs between roughly $1.38 and $1.37. A stronger floor appears at the 100-day EMA near $1.31, ahead of the SuperTrend support around $1.28, which together define the zone that would need to give way to challenge the prevailing bullish bias.
On the weekly chart, XRP retains a bullish near-term bias as it holds above the reclaimed downward resistance trendline around $1.47 and the 200-week EMA near $1.37. Price is now lodged between the 50-week EMA at $1.52 and the 100-week EMA at $1.58 overhead, suggesting an emerging medium-term recovery that is still capped by these higher trend filters.
The MACD remains positive, with the line above zero and recent readings holding firm, while the RSI around 55 hints at constructive but not yet overextended momentum.
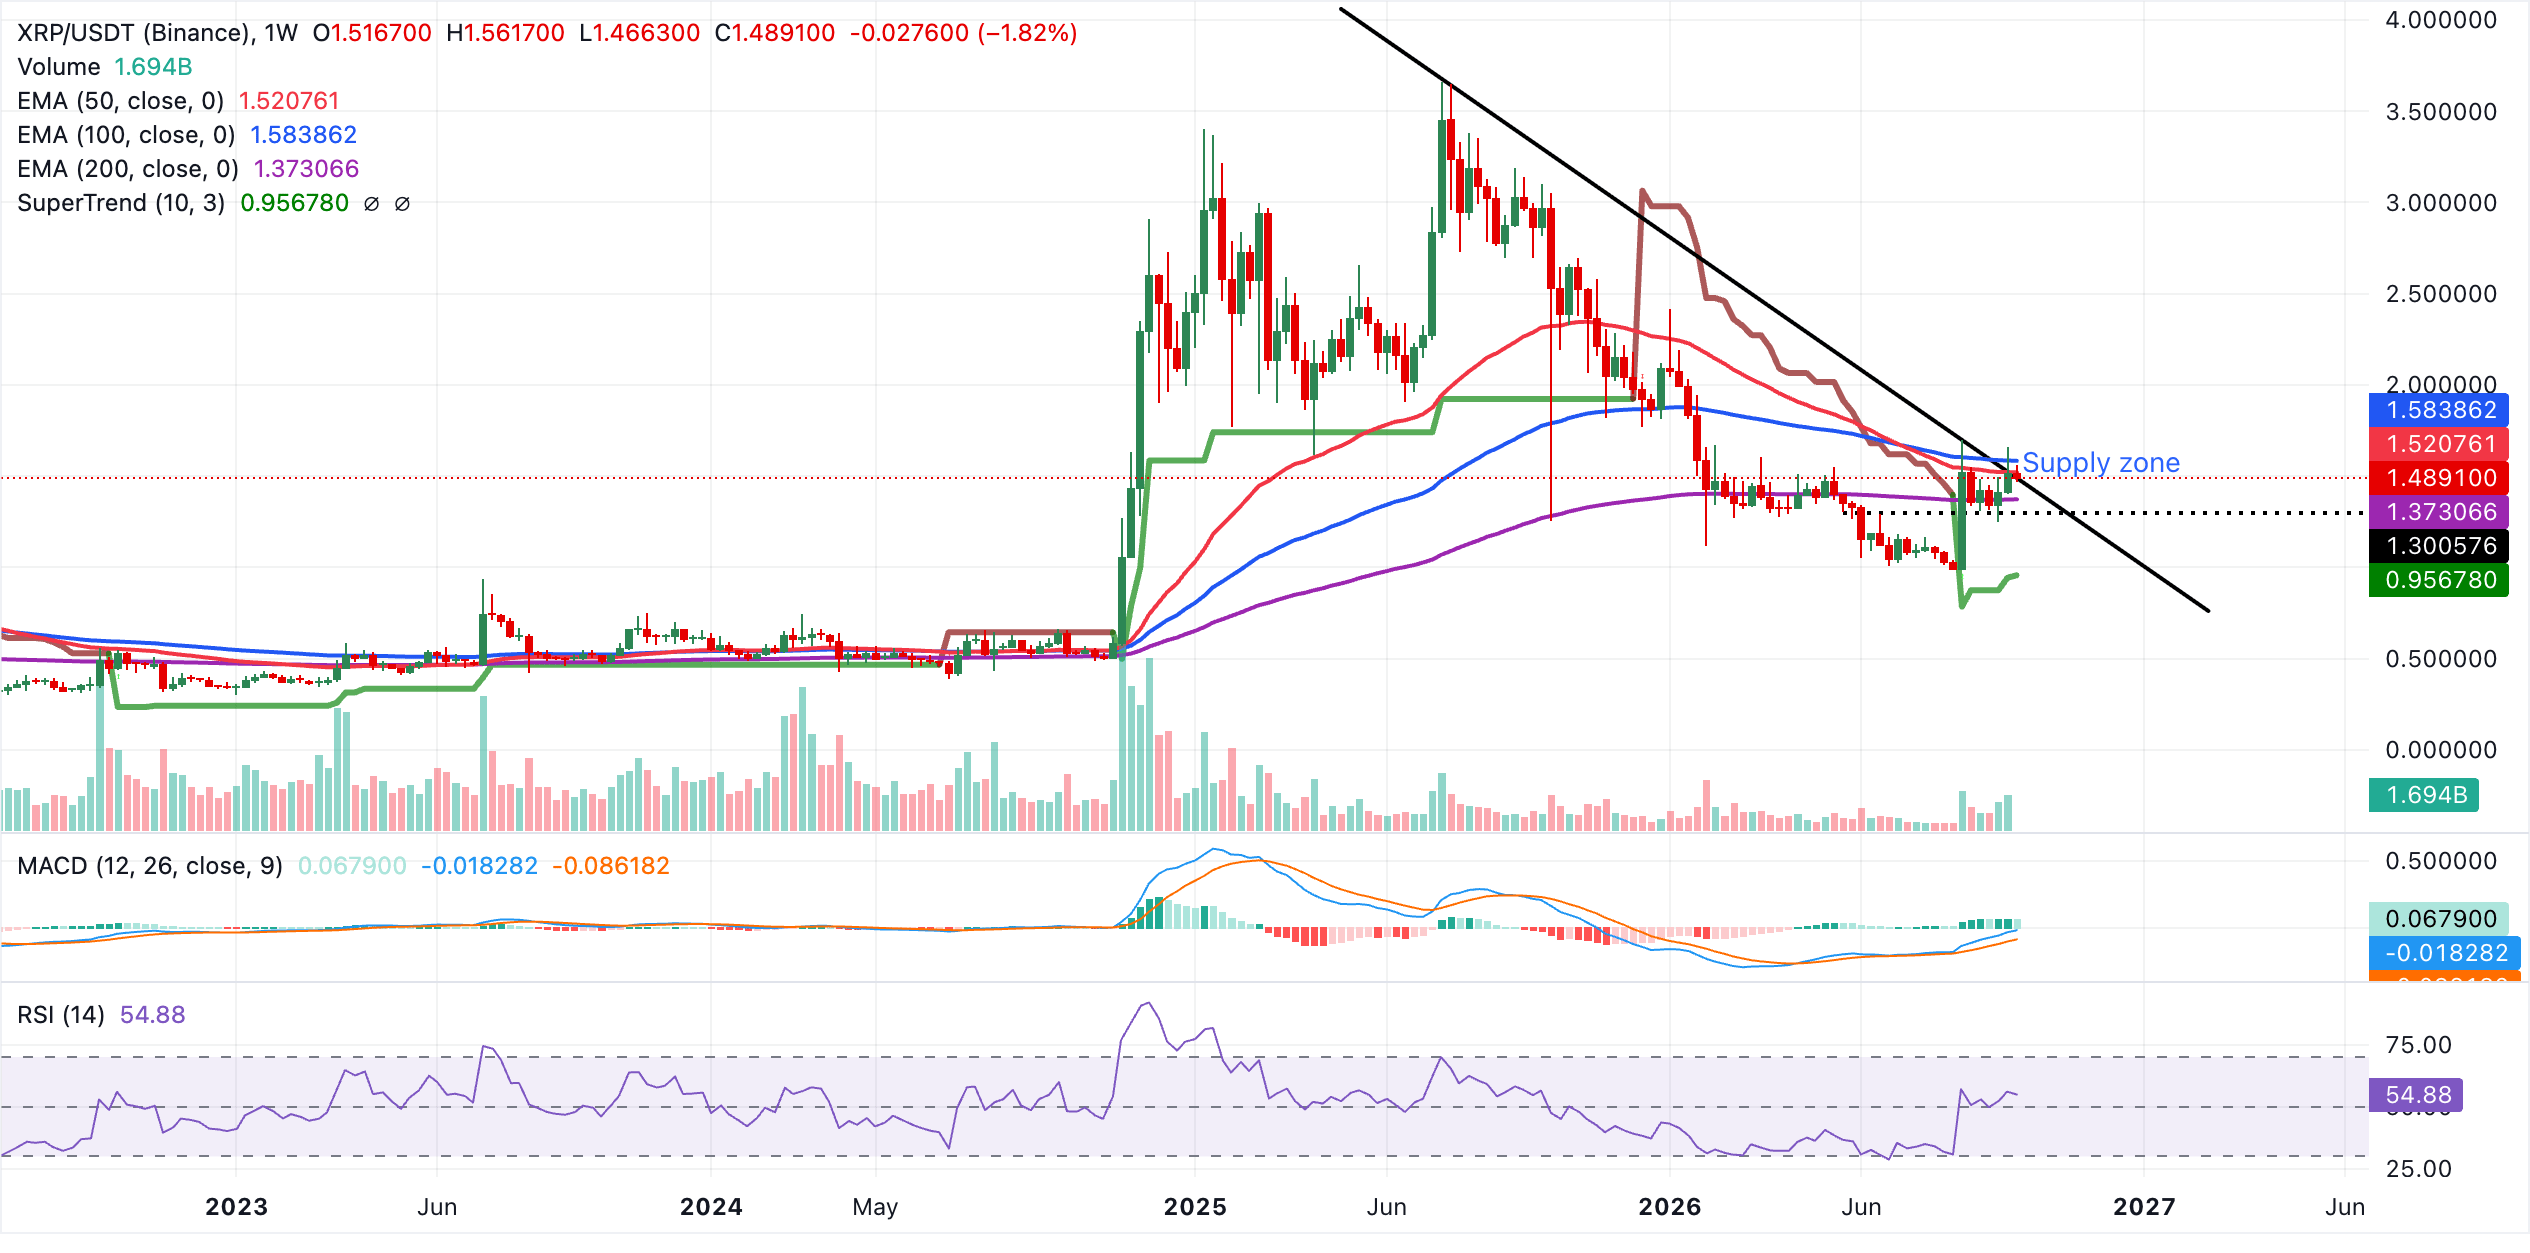
Immediate resistance lies at the 50-week EMA at $1.52, followed by a higher barrier at the 100-week EMA near $1.58, and a sustained break above these would reinforce the bullish trend extension. On the downside, initial support is seen in the $1.47-$1.48 area defined by the former downward trendline break at $1.47 and the current price region, ahead of a deeper structural floor at the 200-week EMA around $1.37.
(The technical analysis of this story was written with the help of an AI tool. Know more.)
Crypto ETF FAQs
An Exchange-Traded Fund (ETF) is an investment vehicle or an index that tracks the price of an underlying asset. ETFs can not only track a single asset, but a group of assets and sectors. For example, a Bitcoin ETF tracks Bitcoin’s price. ETF is a tool used by investors to gain exposure to a certain asset.
Yes. The first Bitcoin futures ETF in the US was approved by the US Securities & Exchange Commission in October 2021. A total of seven Bitcoin futures ETFs have been approved, with more than 20 still waiting for the regulator’s permission. The SEC says that the cryptocurrency industry is new and subject to manipulation, which is why it has been delaying crypto-related futures ETFs for the last few years.
Yes. The SEC approved in January 2024 the listing and trading of several Bitcoin spot Exchange-Traded Funds, opening the door to institutional capital and mainstream investors to trade the main crypto currency. The decision was hailed by the industry as a game changer.
The main advantage of crypto ETFs is the possibility of gaining exposure to a cryptocurrency without ownership, reducing the risk and cost of holding the asset. Other pros are a lower learning curve and higher security for investors since ETFs take charge of securing the underlying asset holdings. As for the main drawbacks, the main one is that as an investor you can’t have direct ownership of the asset, or, as they say in crypto, “not your keys, not your coins.” Other disadvantages are higher costs associated with holding crypto since ETFs charge fees for active management. Finally, even though investing in ETFs reduces the risk of holding an asset, price swings in the underlying cryptocurrency are likely to be reflected in the investment vehicle too.
Author

John Isige
FXStreet
John Isige is a seasoned cryptocurrency journalist and markets analyst committed to delivering high-quality, actionable insights tailored to traders, investors, and crypto enthusiasts. He enjoys deep dives into emerging Web3 tren