Outlook Shifting in Predictable Ways for Bitcoin

As Bitcoin is going down, we’re seeing more and more information on how the currency is in a precarious position or how the prospects of the currency is bleak. But what interests traders the most is if the recent developments have changed anything in the current outlook. And we provide you with our answer to this question. One our readers have known for some time now.
The media seem to have noticed that Bitcoin has depreciated. More Bitcoin-oriented outlets might even focus on market-specific events such as technical developments. In an article on CoinDesk, we read:
Bitcoin risks closing below the 50-week moving average (MA) – an important long-term support not breached for over two-and-a-half years.
With the bears already on the offensive following the recent sell-off, prices are likely to suffer if bitcoin closes on Sunday below the key support, currently seen at $7,611. More worryingly for the bulls, since the cryptocurrency has not traded below the 50-week MA since October 2015, acceptance below that level would only add credence to the argument that the long-term bull run has ended.
As of writing, bitcoin is changing hands at $7,449 on Bitfinex, having dropped below the 50-week MA on May 23.
We generally do not disagree with the idea that the move belong the 50-week moving average might be a bearish indication. Taking a long-term point of view, the move below the moving average based on weekly closes might be a herald of more declines to come in the next few months.
And we did see a move below this level and it seems to be confirmed. Does this mean that we only have declines in the cards? Not necessarily. No move in the market is certain unless it has already occurred. So, the move down is not certain but, for the long term, the move below the moving average might be an important event.
Where our emphasis would go, however, is that the long-term moving average is one of the indicators that might be worth to monitor. It’s not the all-important yardstick but rather a gauge that should be looked at in conjunction with the analysis of other indicators. And we do just that.
Double Retracements
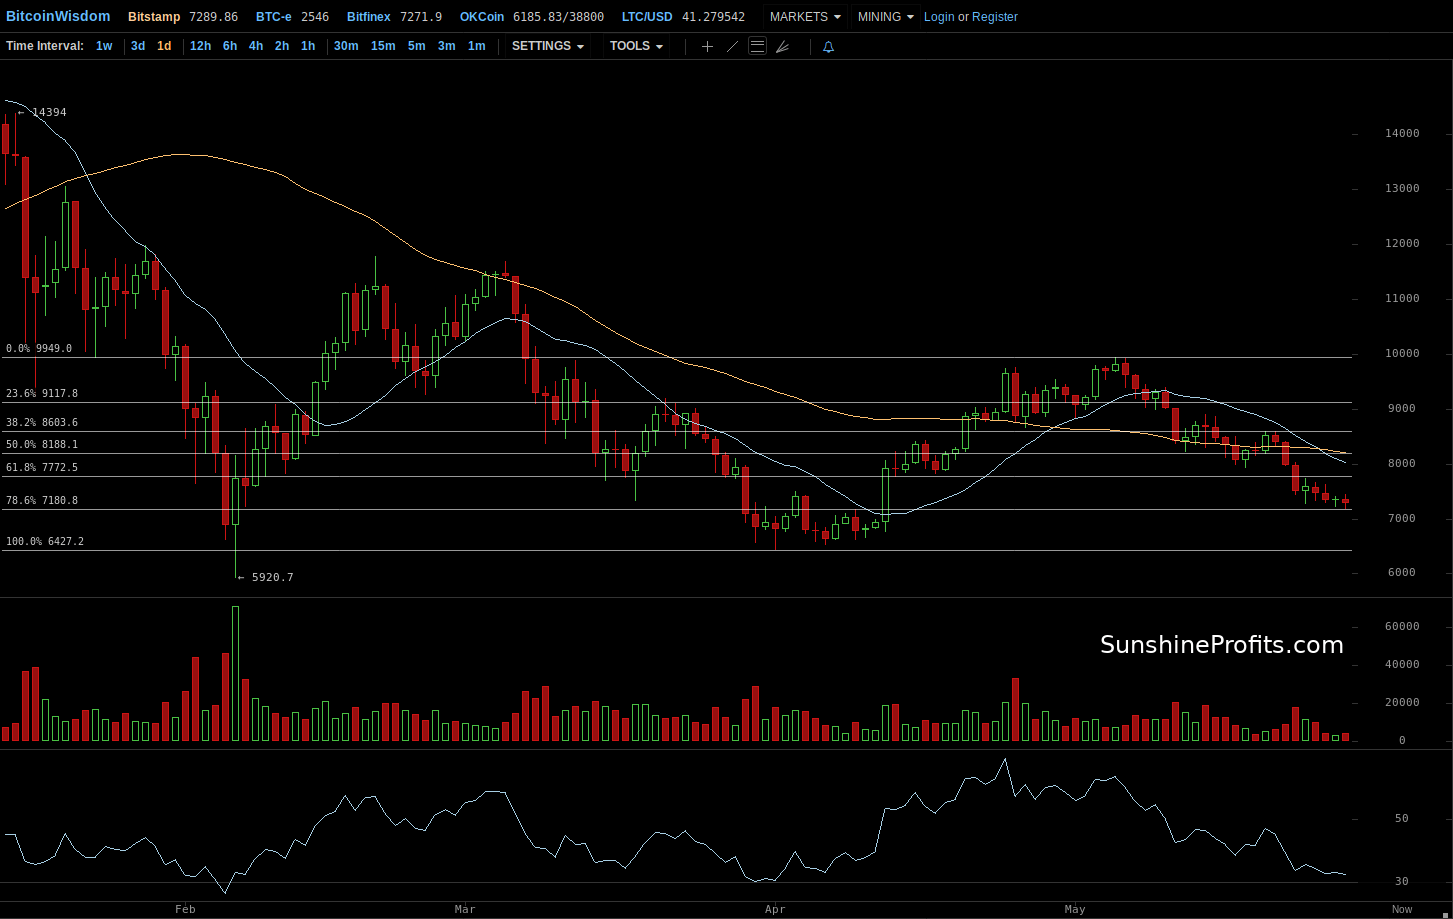
On BitStamp, we have seen a continued move down from the $10,000 level. This move down has now lasted roughly three weeks. The most recent development in the depreciation is the move down below the 61.8% Fibonacci retracement level based on the previous rally from around $6,500 to around $10,000. Bitcoin went down below this level last Wednesday (May 23) and, even more importantly, has stayed below this level for almost a week now and this suggests that the indication here is bearish as far as the short term is concerned.
At the moment of writing, the currency is closing on the 78.6% retracement, a level possibly less important than the previous one, but a bearish indication nonetheless.
If we take a look at other retracement levels, the ones based on the February rally, the implications are virtually unchanged. Bitcoin went below the 61.8% retracement and it’s at the 78.6% retracement. A move below this level would be bearish again. The fact that the retracement levels based on two time frames coincide and have almost identical indications suggests that any bearish indication here might be stronger that if it had been based on one set of retracements.
Array of Support Levels
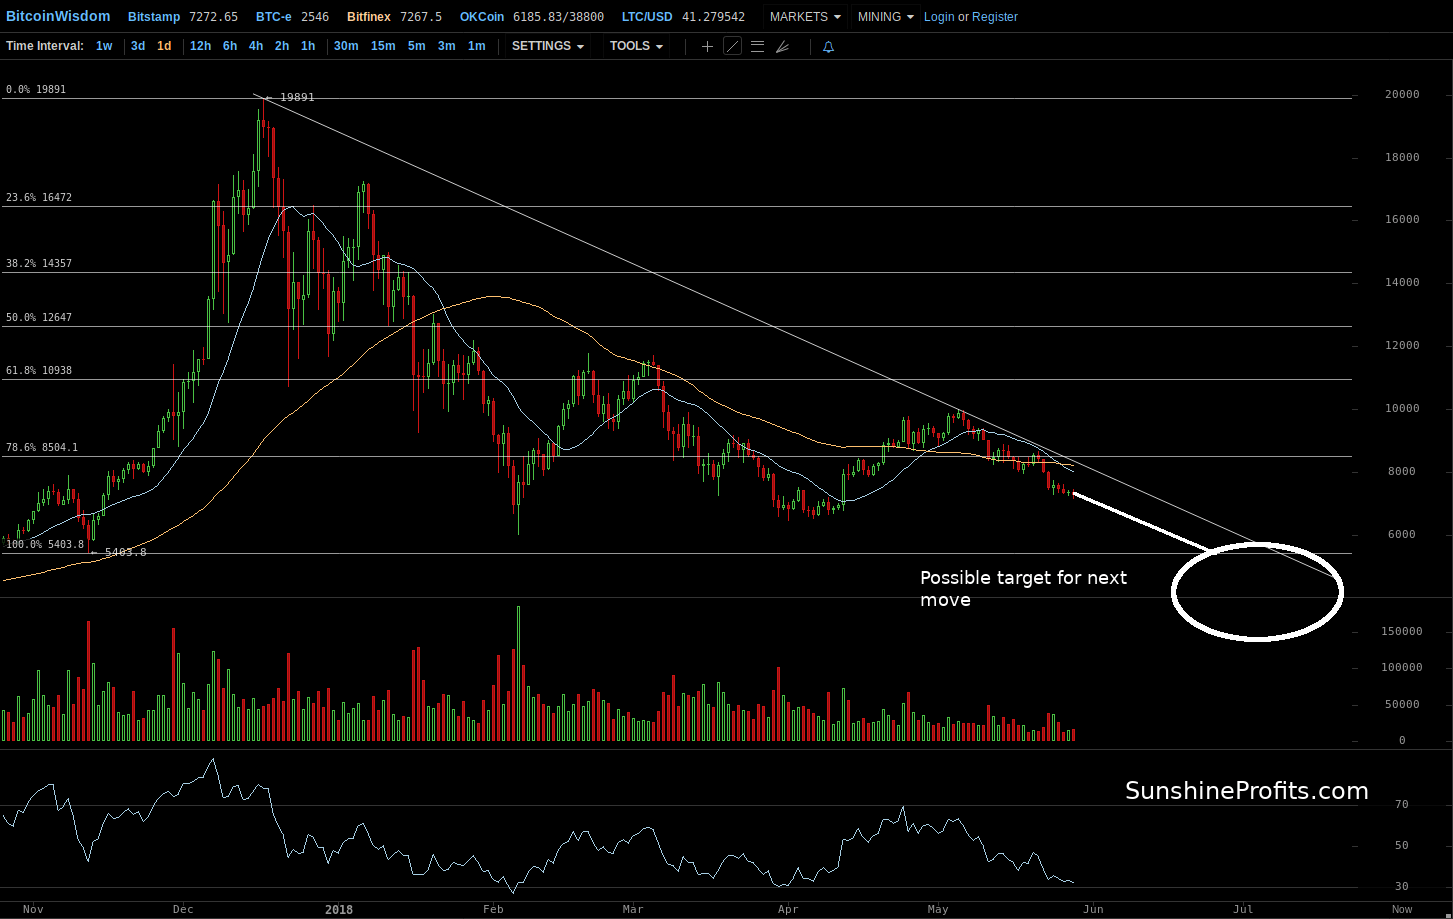
On the long-term Bitfinex chart, we see a development which we have described in our alerts for some time now. Bitcoin went below the 78.6% retracement level and has remained below this level for some time now. The move seems to be confirmed. The 78.6% level is not an extremely important one, but the breakdown below this level contributes to the bearish outlook, in our opinion.
Right now, the currency is declining in line with the long-term bearish trend. The next support level is around $6,500 but it’s not an extremely strong one. Actually, we have several support levels in the $5,500-6,500. From this area, the $5,500-6,000 looks like a stronger support. If we were to narrow this down some more, $6,000 might be a trigger for the next very important move.
So, based on the indications we’re seeing right now, Bitcoin could potentially go down to $6,000 and if we see a move below this level, and particularly below $5,500, the decline might accelerate markedly and our current hypothetical profits might grow even further. A counter-trend rally might occur around $6,000 but any pullback could be very volatile, so it might not be easy or even possible to exit hypothetical positions and reenter them at higher prices. Consequently, it might be worth to sit out any weak correction if it occurs. Nothing of this is automatic and our approach might change as the situation unfolds. Stay tuned!
Summing up, the decline continues and might become even deeper.
Want free follow-ups to the above article and details not available to 99%+ investors? Sign up to our free newsletter today!
Author

Mike McAra
Gold Price Forecast
Mike is a quantitative analyst focused on the economic reality, not theoretical models. His investment thinking is grounded on empirical evidence and common sense.


