Optimism holds in Ripple's XRP as veteran analyst spots bearish pattern that might fail
- Veteran analyst Peter Brandt spots a head-and-shoulders pattern in the weekly XRP chart, which generally signals the end of an uptrend.
- XRP derivatives market upholds optimism as Open Interest grows by 3%.
- The technical outlook remains bullish despite the bearish pattern as XRP holds above the neckline support.

XRP adds to gains on Tuesday after Monday's 7% surge, as crypto markets cheer the ceasefire between Israel and Iran. While the short-term outlook for Ripple's token looks supported with growing open interest, the long-term chart displays a head and shoulders pattern, which generally suggests the end of an uptrend.
The pattern was highlighted by veteran analyst Peter Brand, who said he remains optimistic about the XRP price trend as the token is still holding above a crucial support level.
Peter Brandt anticipates a bearish failure
Peter Brandt shares a possible head-and-shoulders pattern, typically seen before a bearish turnaround. The pattern is formed by three peaks, with the centre peak higher than the other two, projecting the shape of two shoulders and a central head.
The analyst spots $1.8790 acting as the neckline on which the pattern is formed on the weekly chart. Notably, the analyst regards the price volatility on April 7, creating a long-range Doji candle, as an out-of-line movement due to the broader market influence.
Despite the observed bearish pattern, Peter urges traders to avoid bearish speculations as XRP holds above the neckline.
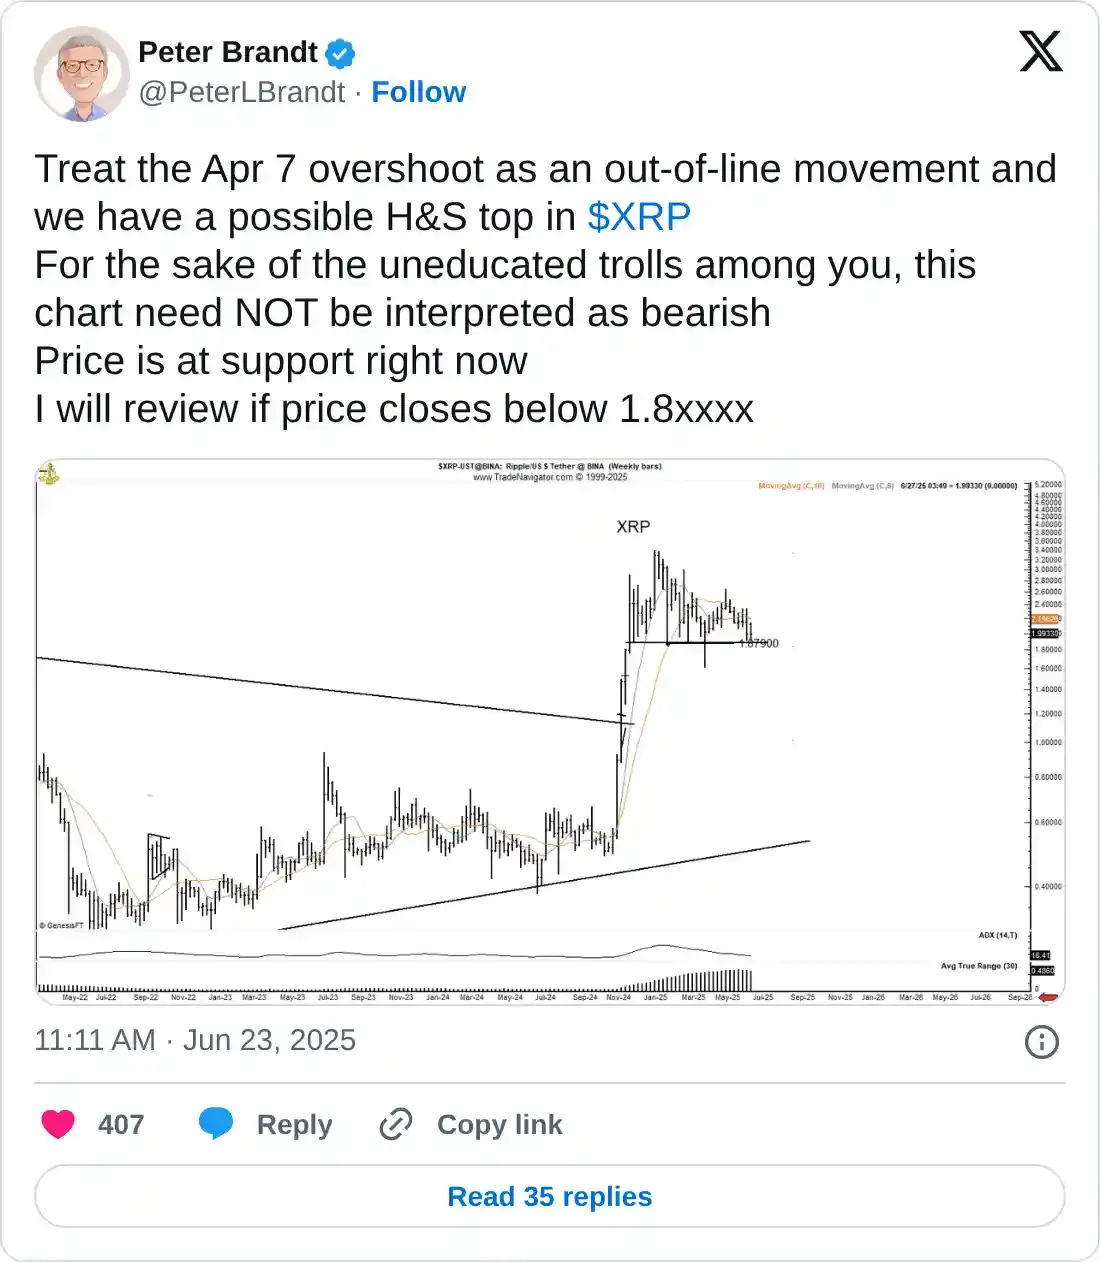
Peter notes that he might review the chart if the XRP price closes below the $1.8790 support level.
Optimism sparks in XRP derivatives
CoinGlass data shows a 6.55% increase in XRP Open Interest (OI), reaching $3.77 billion, suggesting increased buying activity. An increasing OI is related to a rise in capital inflows that could fuel a potential leverage-driven rally in XRP.
The OI-weighted funding rate flips positive to 0.0059% from -0.0072%, signaling a sudden boost in buying activity. Bulls pay the positive funding rates to align swap and spot markets, as increased buying in the derivatives market could lead to price imbalances.
Amid the short-term recovery, bearish positions worth $9.38 million were wiped out compared to $3.10 million in long liquidations.
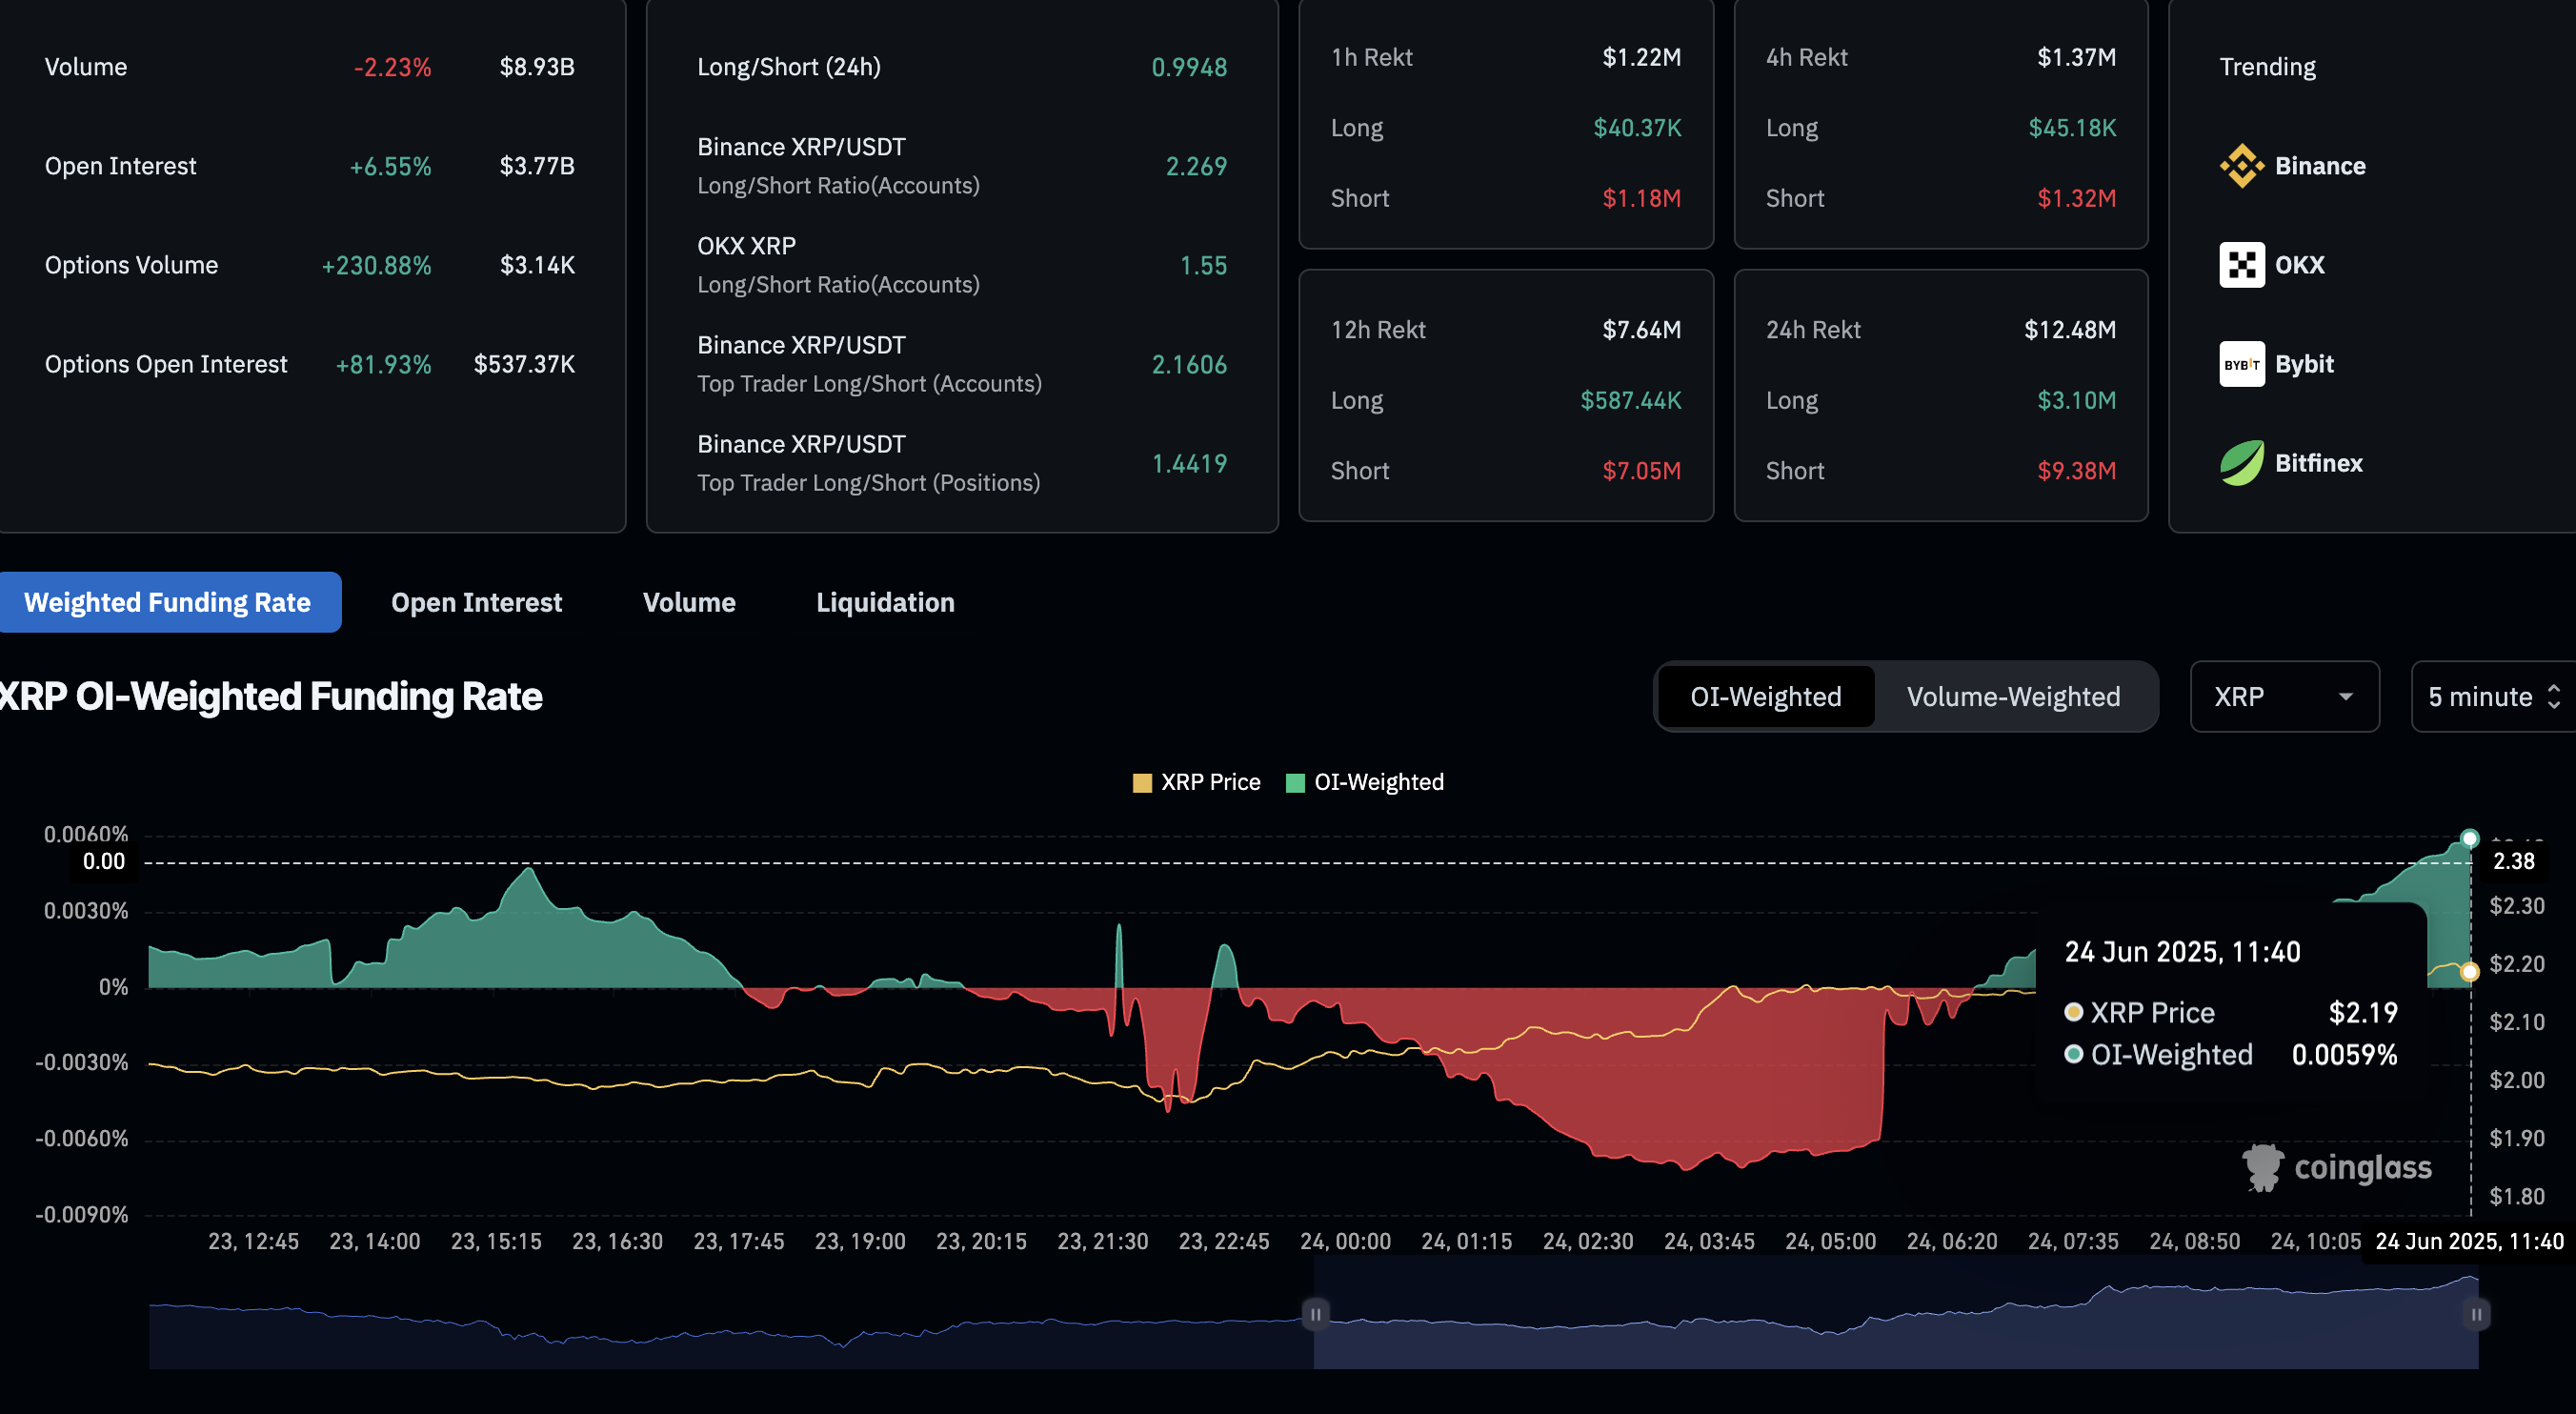
XRP derivatives data. Source: Coinglass
XRP price recovery aims to break out of the 100-day EMA
XRP inches higher by almost 2% at press time on Tuesday, adding to the 7% jump from Monday . The recovery run stemming from the weekly low of $1.9083 helps avoid a daily close below the $2.00 round figure.
Price nears the 50-day Exponential Moving Average (EMA) at $2.2164, followed closely by the 100-day EMA at $2.2324. A potential closing above the 100-day EMA could test the overhead trendline near $2.38, formed by the peaks on January 16, January 20, and May 14.
The Moving Average Convergence/Divergence (MACD) momentum indicator shows the MACD line approaching the signal line for a bullish crossover. Such a crossover is considered a buy signal.
The Relative Strength Index (RSI), meanwhile, indicates an increase towards the halfway line from bearish levels.
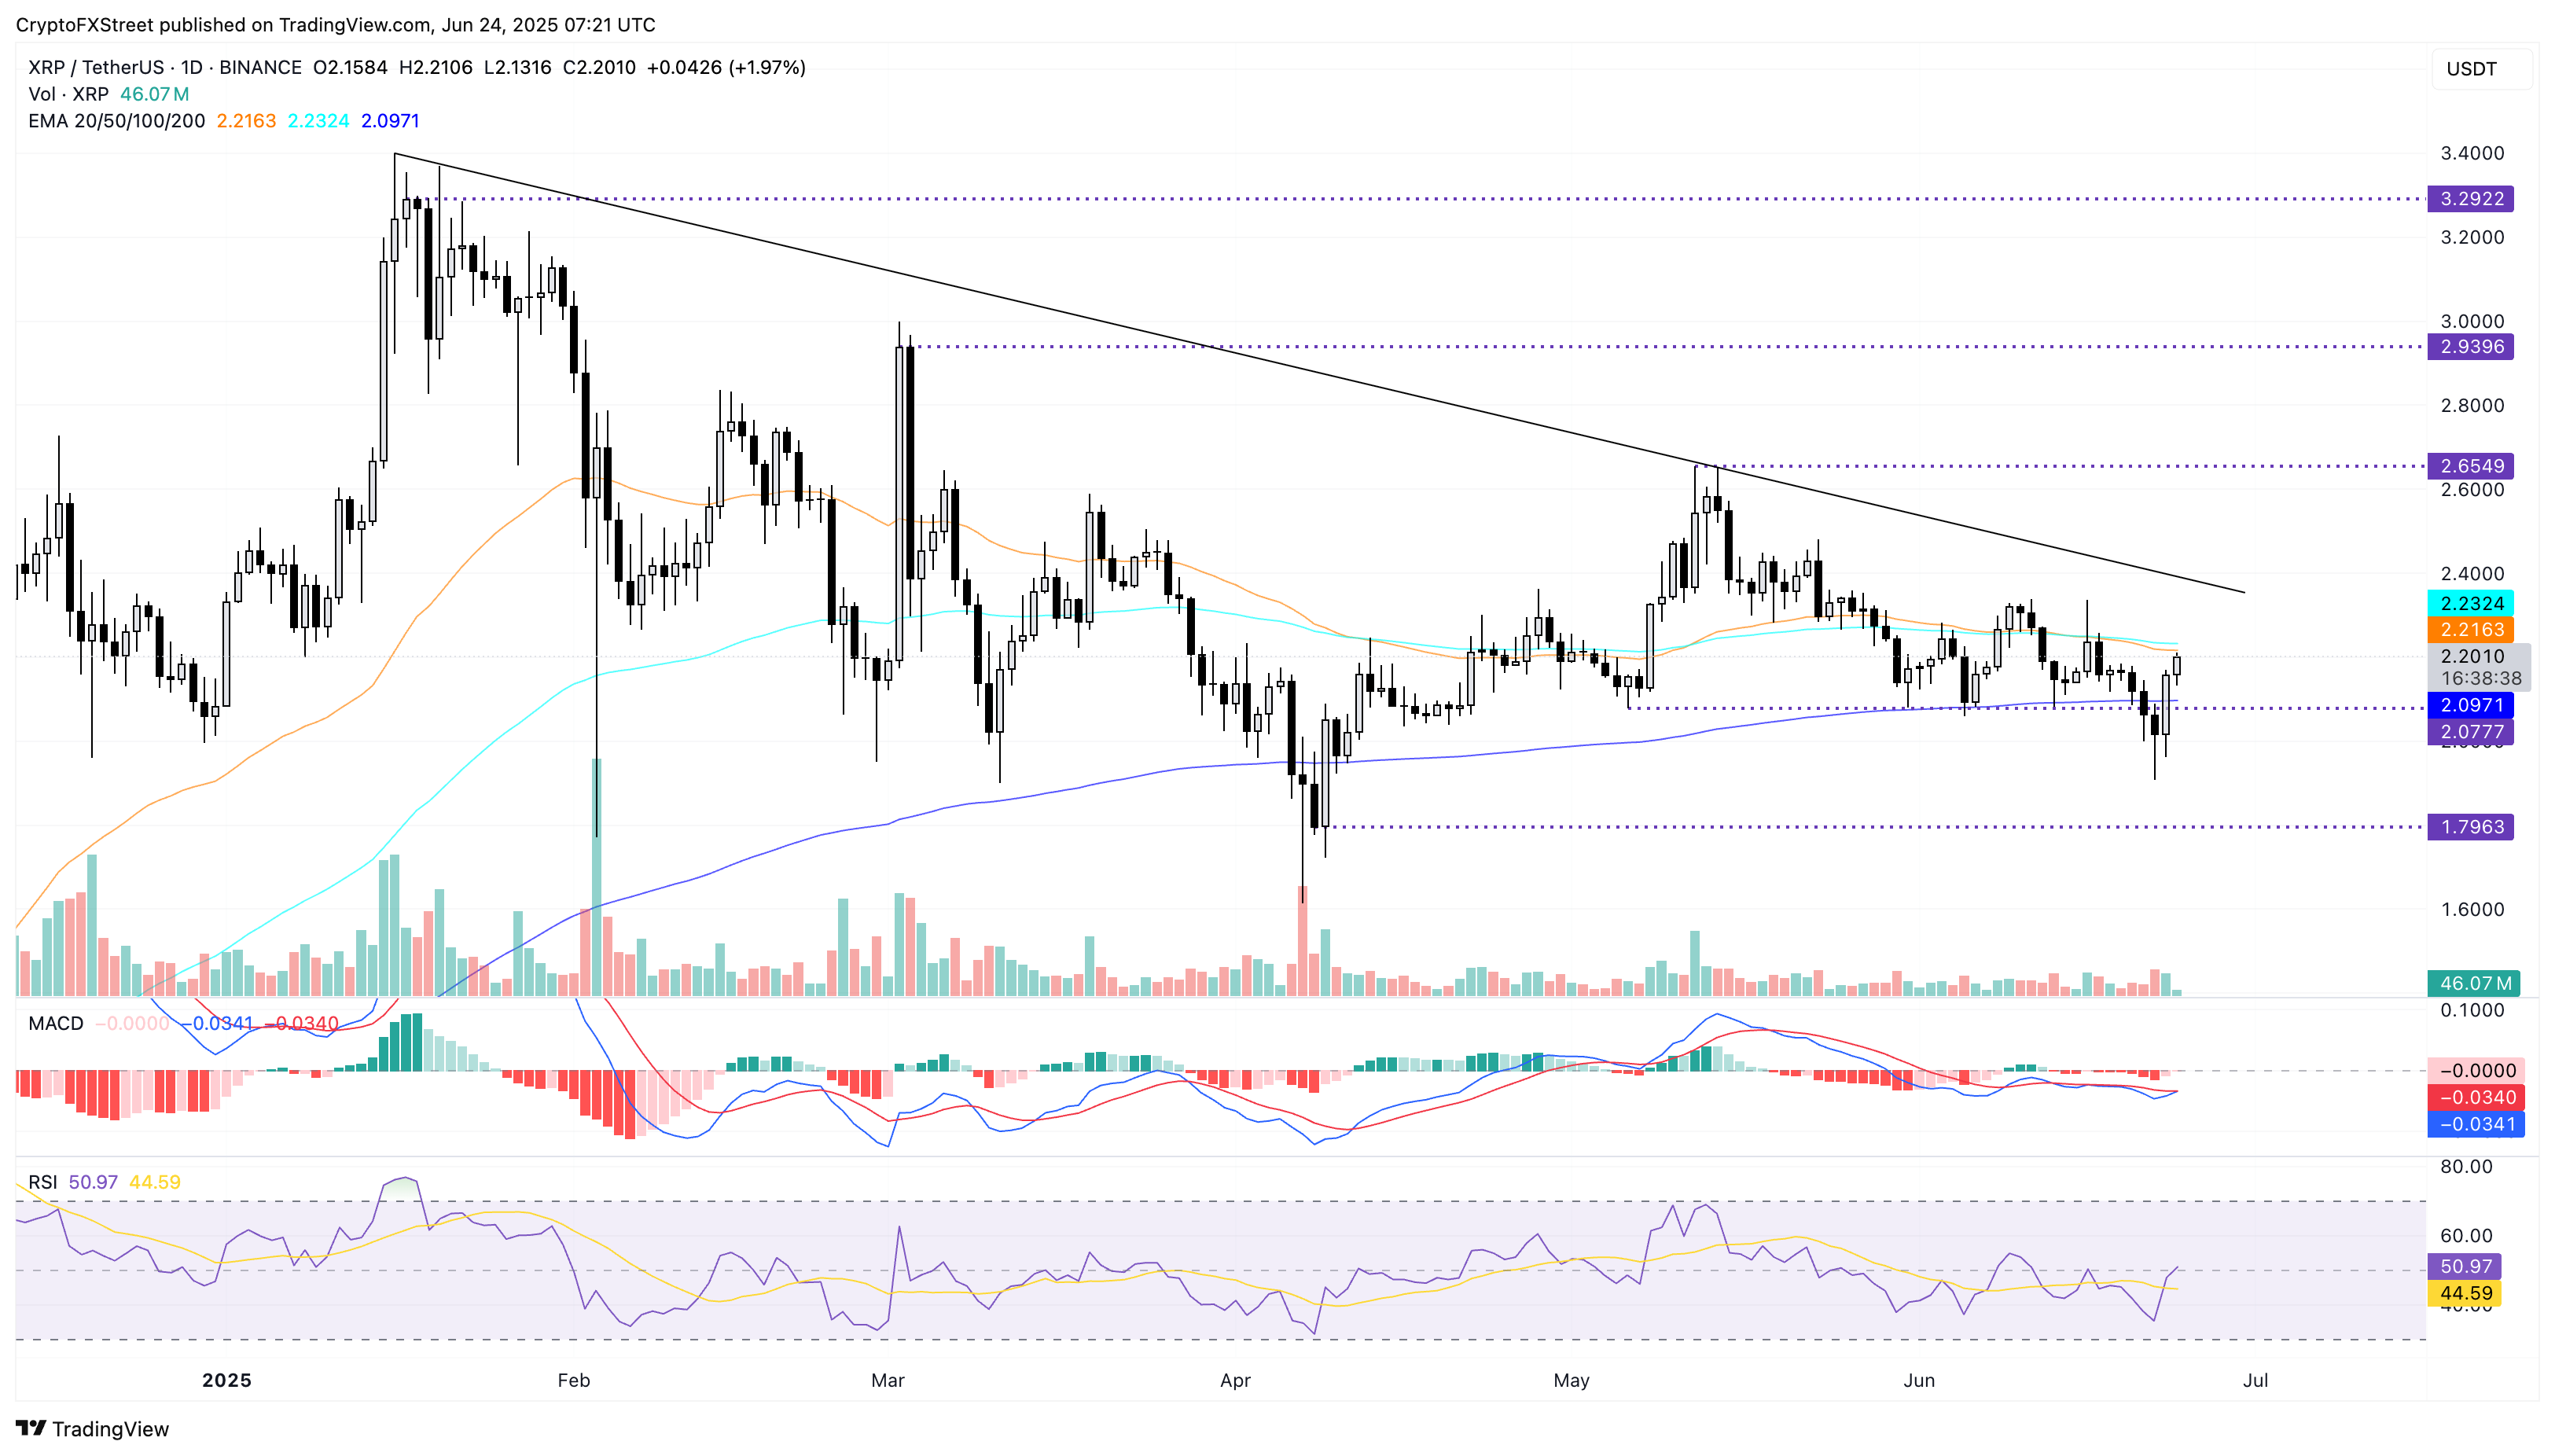
XRP/USDT daily price chart.
If XRP fails to uphold above the $2.00 round figure, it could test the $1.8790 neckline highlighted by Peter Brandt, risking a steeper correction.
Author

Vishal Dixit
FXStreet
Vishal Dixit holds a B.Sc. in Chemistry from Wilson College but found his true calling in the world of crypto.


