Optimism fading for BTC/USD?

Down -4.0% month to date, Bitcoin (BTC) versus the US dollar (USD) is extending last week’s -7.3% fall.
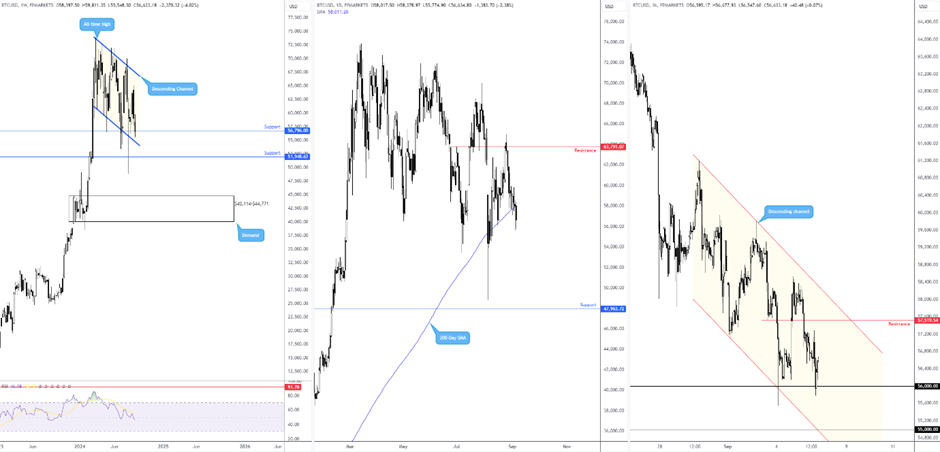
Weekly support
The technical landscape reveals that although weekly support at US$56,796 prompted a bullish reaction in August, the major cryptocurrency failed to register any meaningful highs. Adding to this, the unit is also retesting the grip of current support again, along with the Relative Strength Index (RSI) dipping its toe below the 50.00 centreline (indicating average losses exceed average gains). South of current support, another technical floor lies close by in the form of channel support, extended from the low of US$60,717, closely followed by support coming in at US$51,948.
So, although BTC is on the ropes at the moment, there is plenty of neighbouring weekly support ahead.
Daily price below the 200-Day SMA
Meanwhile, price action on the daily timeframe is navigating beneath the 200-day simple moving average at US$58,009, which is a bearish signal in and of itself. The push lower is emphasised given the lack of support seen until as far south as US$47,963. This suggests that current weekly support could be in a vulnerable position.
H1 movement rebounding from US$56,000
Short-term action on the H1 chart shows price rebounding from the US$56,000 handle.
Assuming daily flow remains beneath the 200-day SMA, this places a bold question mark on weekly support at US$56,796. This could also mean that short-term breakout traders may short any break of US$56,000, targeting at least US$55,000.
On the other hand, should US$56,000 remain support, buyers are unlikely to commit until daily price trades back above the 200-day SMA, and H1 closes above channel resistance, extended from the high of US$61,193.
Author

Aaron Hill
FP Markets
After completing his Bachelor’s degree in English and Creative Writing in the UK, and subsequently spending a handful of years teaching English as a foreign language teacher around Asia, Aaron was introduced to financial trading,


