Open Positions Report: Where's the money in the crypto market? Bitcoin, Ethereum, Litecoin, Bitcoin Cash
- Open positions report informs us of critical price levels.
- It is amazing the volume of addresses with an average price close to zero.
- The 2017 boom left a lot of buys out of the money.

The basic concept of trading is to buy cheap and sell expensive. It is simple but in the world of trading conditions change very fast.
The perception of the value of an asset changes rapidly, and with it, the price someone is willing to pay. But the price paid for something is also important. Except in cases of need for liquidity or fear of losing, even more, no one sells below the cost price of their product.
In the world of trading stocks, currencies, or commodities, these magnitudes can be measured using option positions. In the crypto market, tools such as those provided by Intotheblock provide us with this information.
The In/Out of the Money tool
This tool provides us with information about the position in which the holders of a cryptocurrency are. This information defines three possible areas:
-In the Money: Defines the number of active addresses that are in profit. That is, if they sold their positions, they would make money.
-Out of the Money: Defines the number of active addresses that are losing money. In other words, if they sold their adpositions, they would lose money.
-At the Money: Defines the amount of addresses that are neutral. In other words, if they sold their positions, the result would be more or less neutral for their account.
Now let's see how these magnitudes are distributed in thee 4 top cryptocurrencies by capitalization.
Bitcoin
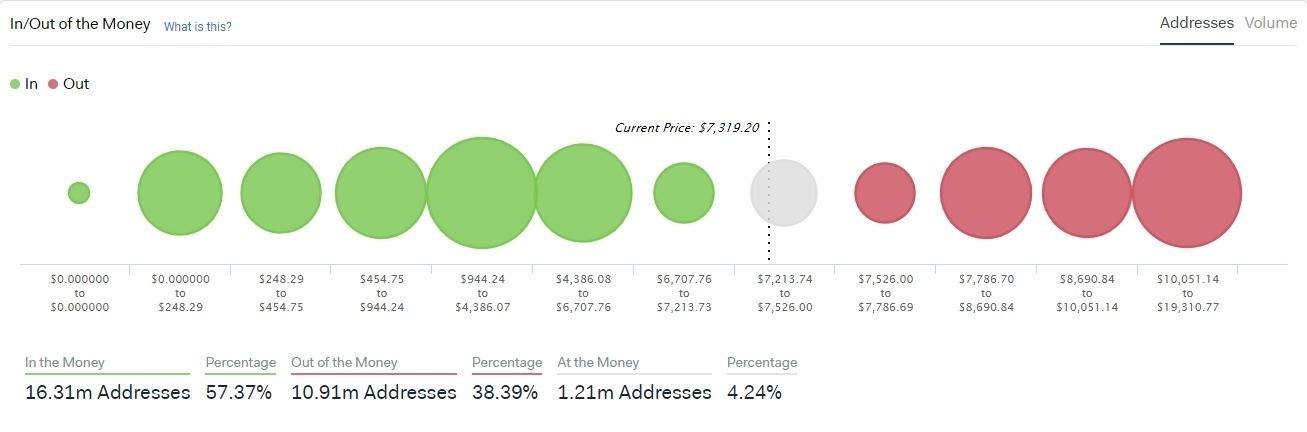
In the distribution of positions in Bitcoin, there are currently 16.31 Mill of addresses (57.37%) In the Money, 10.91 Mill of addresses (38.39%) Out of Money and 1.21 Mill of addresses At the Money (4.24%).
The highest concentration of winning positions is in a range between $944 to $4,386 (2.8 Mill Bitcoins).
The highest concentration of losing positions are in the range between $10,051 and $19,310 (2.5 Mill Bitcoins).
Source: Intotheblock
The most remarkable information is the large volume of positions bought in the highest price range, which supports the idea that the price would tend to go up. In normal conditions, these buyers at high levels will not sell their Bitcoins.
It is also important to highlight the number of Bitcoins (1.2 Mill) quantified at zero or quasi zero cost. These are Bitcoins mined in the first moments. This group represents the biggest threat to the price.
Ethereum
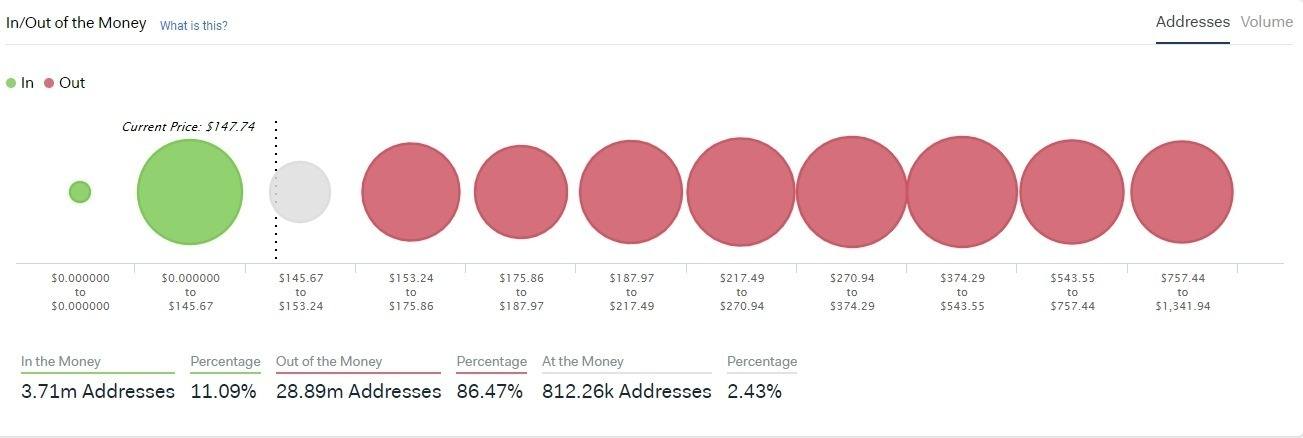
In the distribution of positions in the Ethereum, there are 3.71 Mill of addresses (11.09%) In the Money, 28.89 Mill of addresses (86.47%) Out of Money and 227.2 K of addresses At the Money (2.43%).
The highest concentration of winning positions is between $0.01 to $145.67 (34.5 Mill Ethereums).
The largest concentration of losing positions are in the range between $153 and $175.86 (12.6 Mill Ethereums).
Source: Intotheblock
The most remarkable information is that the largest group in losses is just above the current price, which would be a reason for it to cost so much to exceed that level between $153 and $175 to the ETH/USD pair. There are many people who, when the price reaches these levels, will be making money and might be tempted to sell. These sales consume upside potential and complicate evolving to higher rates.
Bitcoin Cash
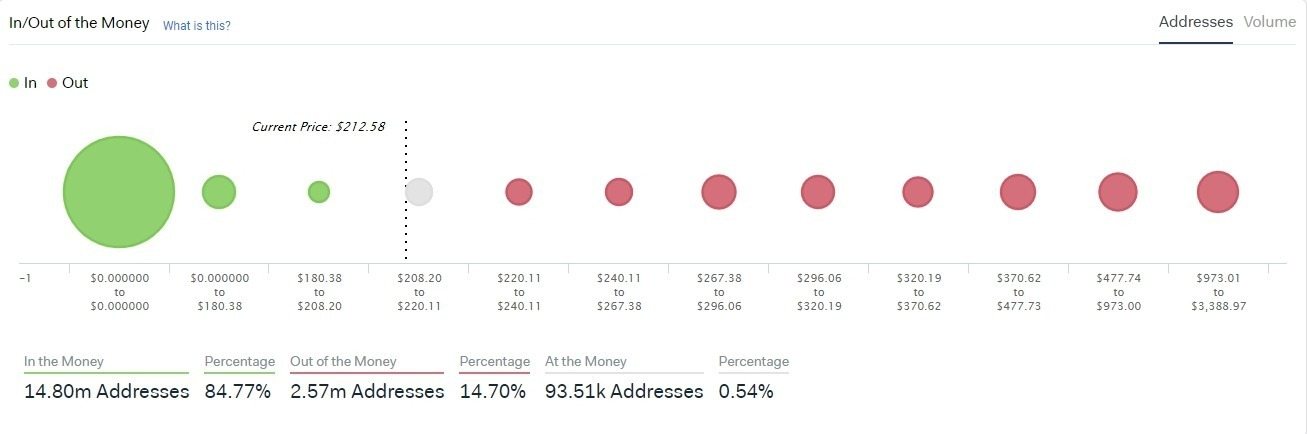
In the distribution of positions in Bitcoin Cash, currently, there are 14.8 Mill of addresses (84.77%) In the Money, 2.57 Mill of addresses (14.70%) Out of Money, and 93.5 K of addresses At the Money (0.54%).
The highest concentration of winning positions is in a range from $0.00 to $0.00 (5.95 Mill BCH).
The largest concentration of losing positions are in the range between $246 and $320 (1.82 Mill BCH).
Source: Intotheblock
The most remarkable information is that the highest concentration of winning positions is at 0 costs, so they are tokens obtained in the fork process, distributed among the Bitcoin forks.
It is also interesting to see how few addresses there are in the current range, ranging from $208 to $220. At this price level, there should be very little resistance, as few traders are willing to sell.
Litecoin
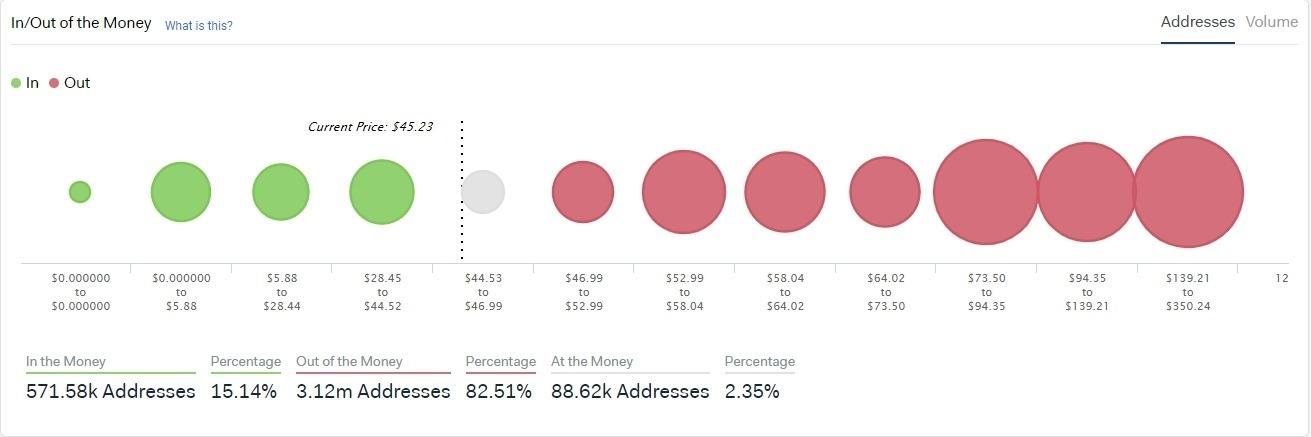
In the distribution of positions in Litecoin, currently are 571 K of addresses (15.14%) In the Money, 3.12 Mill of addresses (82.51%) Out of Money, and 88.6 K of addresses At the Money (2.35%).
The highest concentration of winning positions is between $28.4 to $44.5 (15.7 Mill from Litecoins).
The largest concentration of losing positions are in the range between $73.5 and $94.3 (9.4 Mill of Litecoins).
Source: Intotheblock
The most remarkable information is that the current price rests directly on the largest volume of traders who are in the money, so they have no anxiety to sell and thus give strength to the ongoing supports.
Author

Tomas Salles
FXStreet
Tomàs Sallés was born in Barcelona in 1972, he is a certified technical analyst after having completing specialized courses in Spain and Switzerland. He expanded his technical training following the guidance of great experts on the financial markets.



