OmiseGO Price Prediction: OMG could slide below a crucial support, targeting $3
- OMG is currently trading at $3.58 not able to recover from the recent crash.
- Bulls are allowing OMG to bounce from an overextended hourly RSI.

OMG had a significant awakening period on August 15, gaining a ton of trading volume. OMG had around $100 million in daily volume throughout 2020 and managed to peak at $5 billion on August 21 after a massive rally towards $7 from $1.5.
OMG/USD daily chart
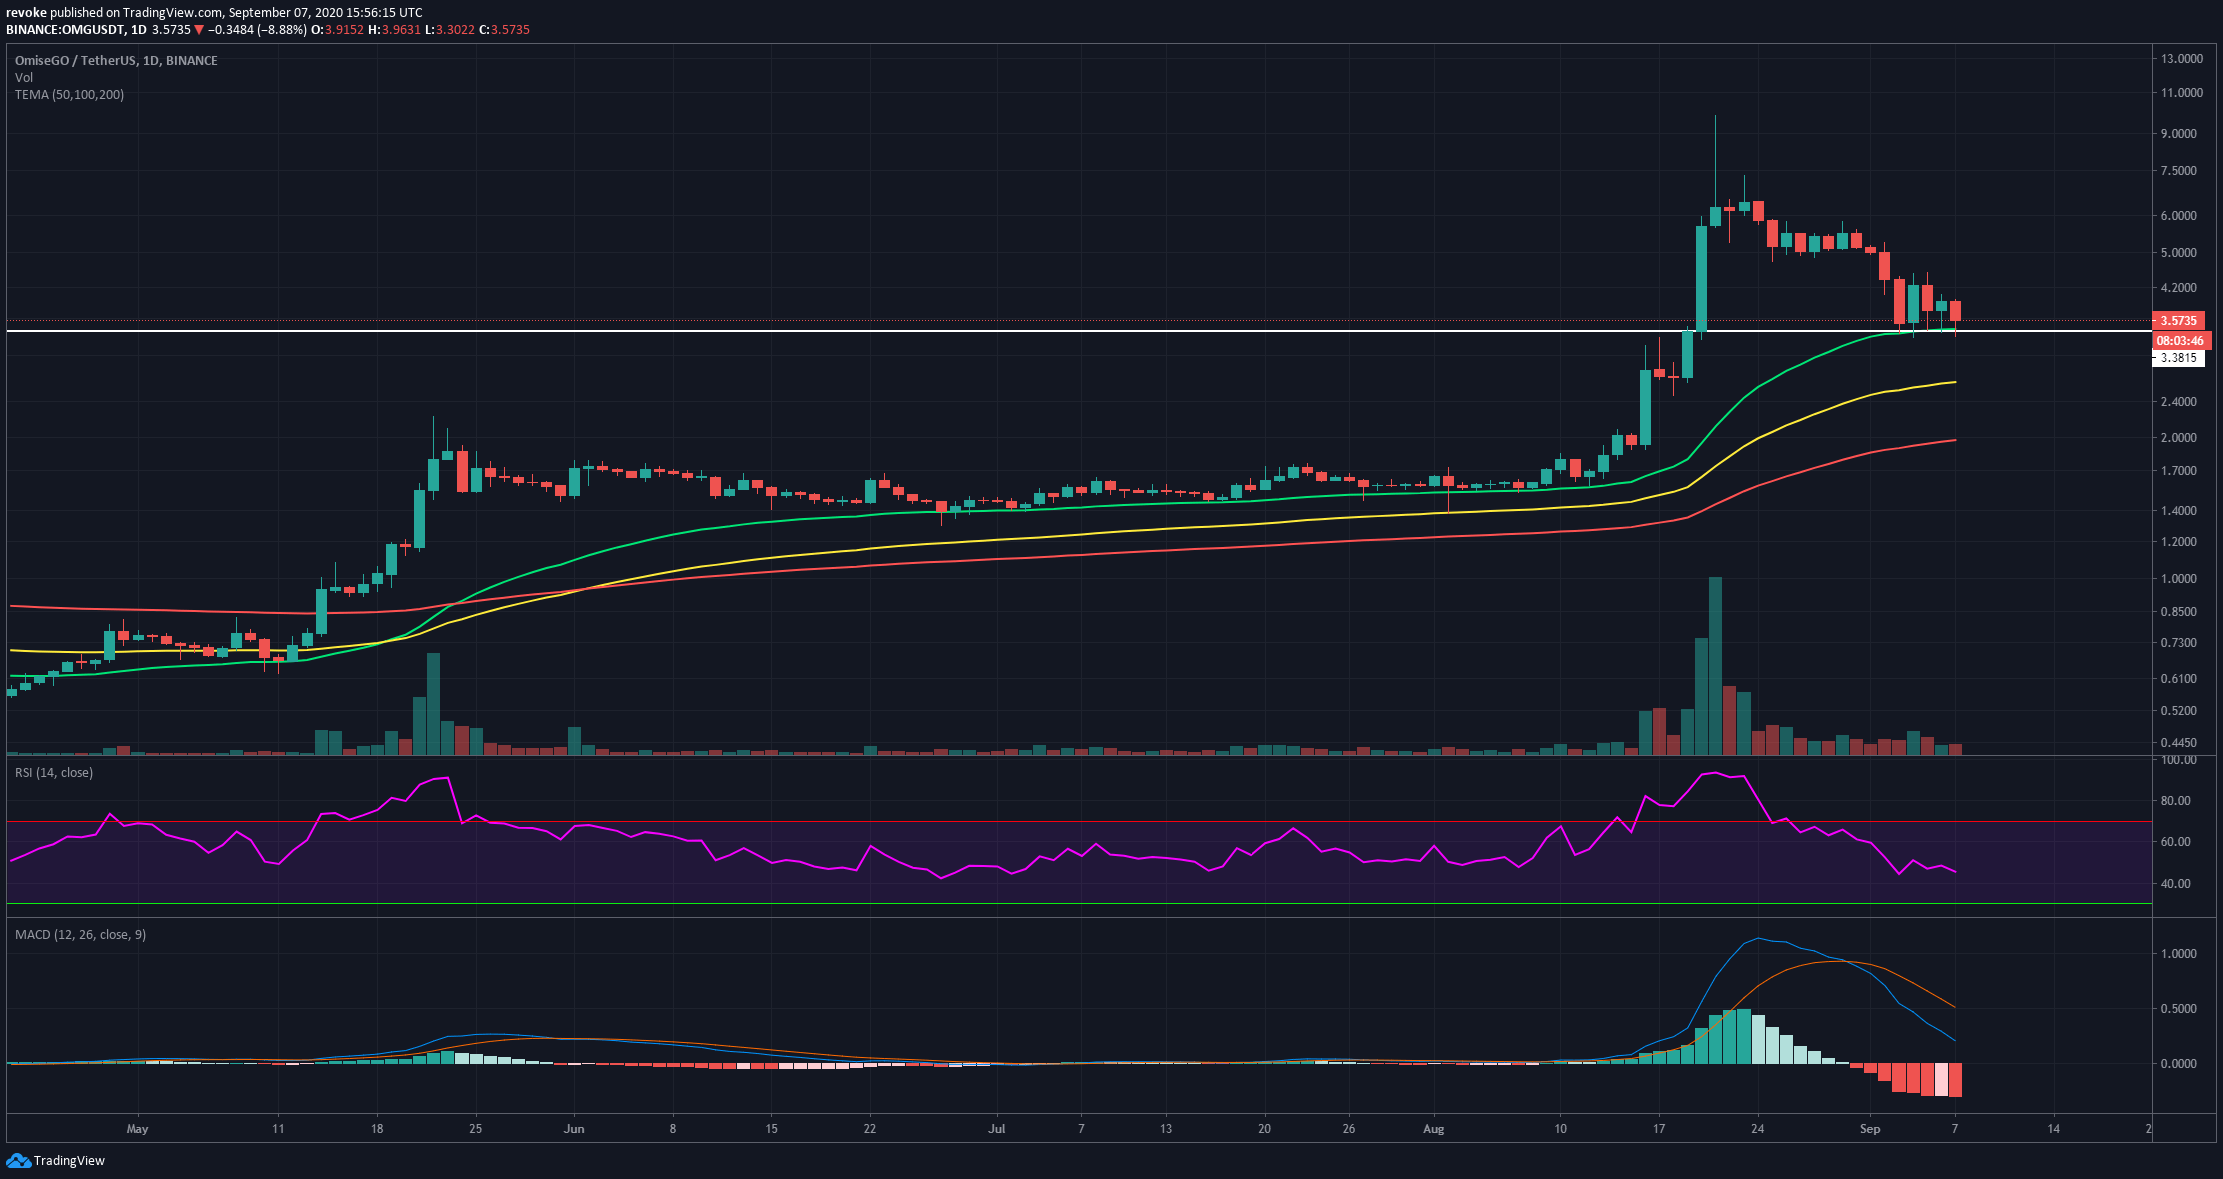
OMG's downtrend is now clear; however, bulls are defending the daily 50-MA at $3.42, and they have stopped the price from falling below this indicator for five days in a row. The RSI is not yet overextended, while the MACD turned bearish around August 30. The significant drop in volume indicates that a bigger move is nearby.
OMG/USD 1-hour chart
-637350913464951582.png)
OMG has quite clearly established a descending triangle pattern on the 1-hour chart forming a robust support line at around $3.4. This can also be seen using the In/Out of the Money Around Price on-chain metric which shows many addresses buying at $3.39. It also shows a cluster of addresses at $2.96, indicating that $3 would be another crucial area of support if $3.4 is lost. On the other hand, the biggest resistance level at $3.79 only has around 700 addresses together, compared to the 1.68k addresses at $3.4.
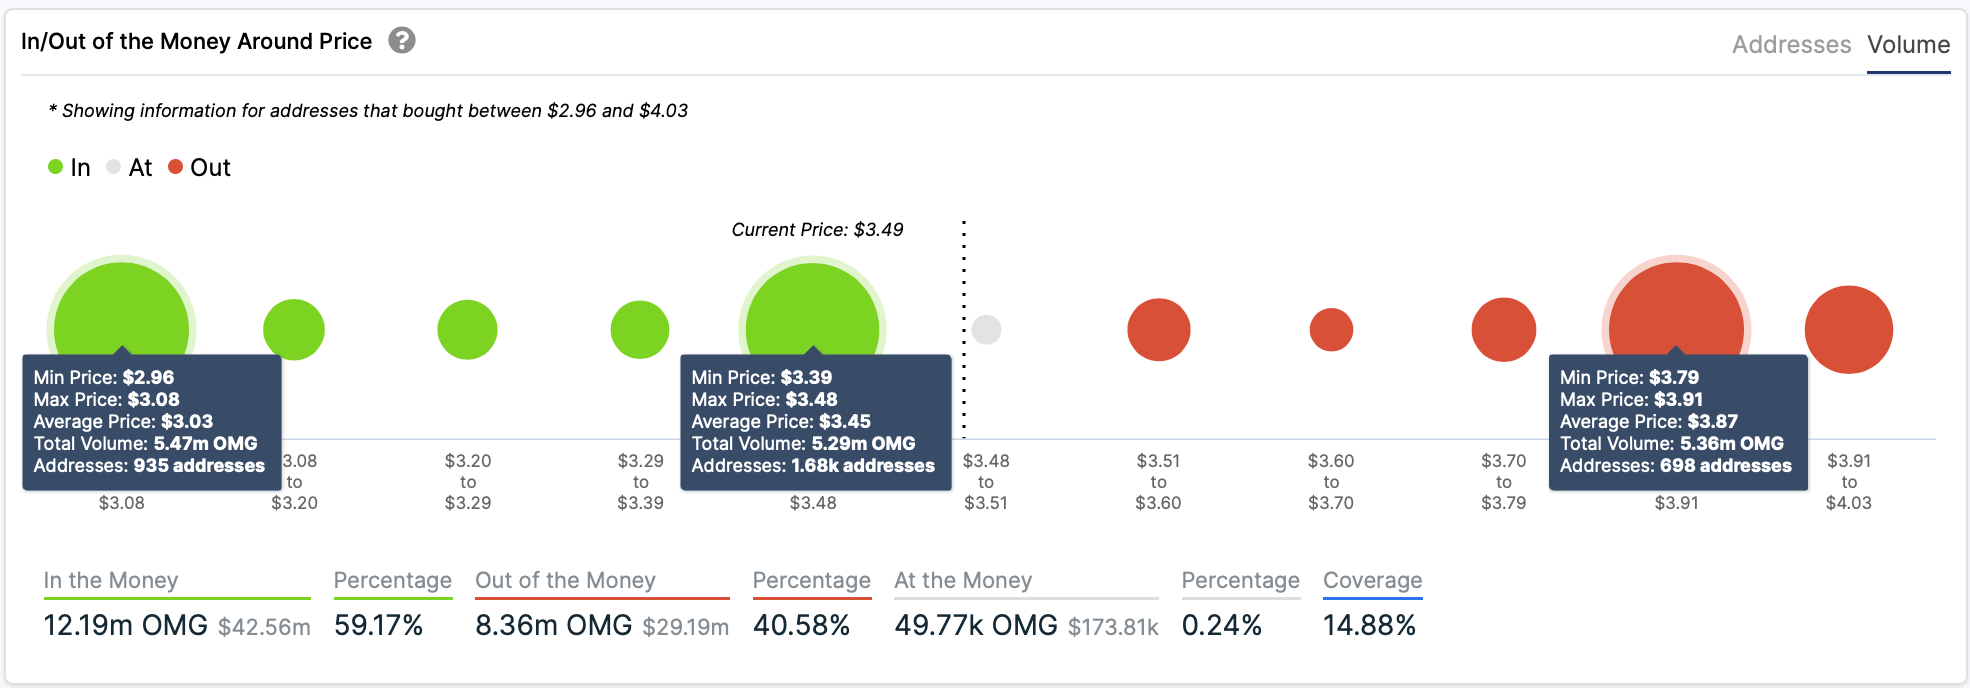
A descending triangle is generally a bearish pattern; however, considering the strength of the support area and the resistance level's weakness at $3.79, we could see OMG bounce from the lower line of the descending triangle towards $4. Until now, the RSI has given reliable buy signals after overextension.
Author

Lorenzo Stroe
Independent Analyst
Lorenzo is an experienced Technical Analyst and Content Writer who has been working in the cryptocurrency industry since 2012. He also has a passion for trading.


