NEO Technical Analysis: NEO liftoff to $20 seems imminent
- NEO embraced support at the 200-day SMA, giving way for ongoing recovery.
- A buy signal on the daily chart adds credibility to the technical outlook eying $20.

NEO resumed the uptrend after the downtrend lost momentum at $14. An ongoing recovery has already pulled the cryptoasset to $15. If buy orders continue to increase, NEO is likely to climb to levels above $20. For now, bulls are in the cockpit with the throttle in their hands, ready for takeoff.
NEO bulls build upon crucial support
The resumption of the uptrend was made possible by the support formed at $14. NEO also hit oversold conditions according to the Relative Strength Index on the 12-hour chart. For now, all the attention is being channeled towards breaking the immediate hurdle and settling above $15.
The same 12-hour timeframe also illustrates a descending wedge pattern where two converging trendlines form a wedge. One trendline connects the respective highs and the other trendline the lows.
The pattern describes a narrowing bearish momentum, hence the expected reversal. Price action above the upper trendline usually culminates in a significant breakout.
In other words, if NEO bulls push past the wedge pattern, the bullish outlook will be validated. It is also vital that NEO closes the day above the 50 Simple Moving Average to allow buyers to shift the focus to $18 and $20, respectively.
-637402405206548226.png)
NEO/USD 12-hour chart
The bullish narrative appears to have come into the picture after the TD Sequential indicator flashed a buy signal on the daily chart in the form of a red nine candlestick. Moreover, the price is sitting above the 200-day SMA, which suggests that NEO is firmly supported. On the upside, resistance is anticipated at the 50 SMA and the 100 SMA but once broken, NEO could quickly rally past $20.
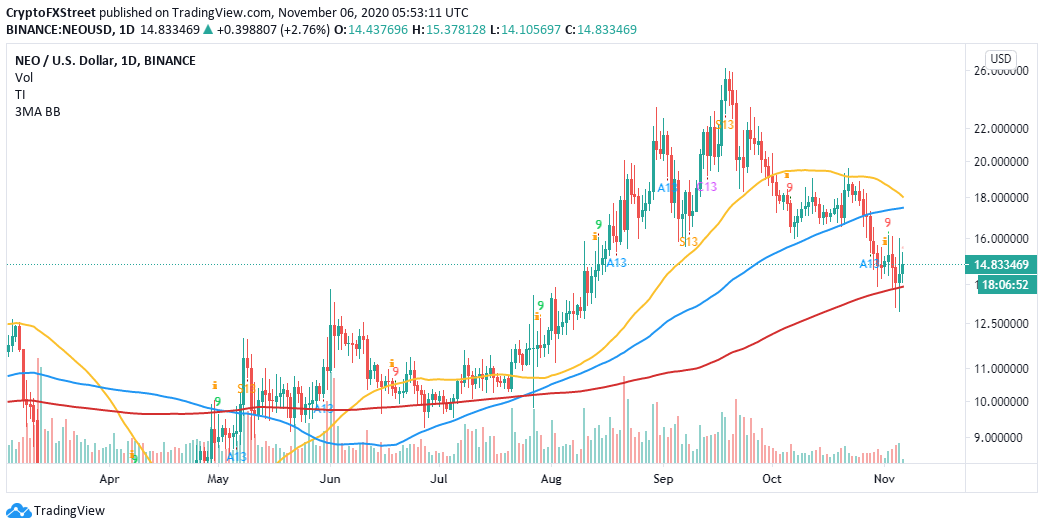
NEO/USD daily chart
Consequently, a recent bullish divergence presented by the Relative Strength Index away from NEO’s price highlighted the possibility of the uptrend gaining traction. In other words, the bearish momentum appears to have dwindled along the week, while the bullish grip intensified.
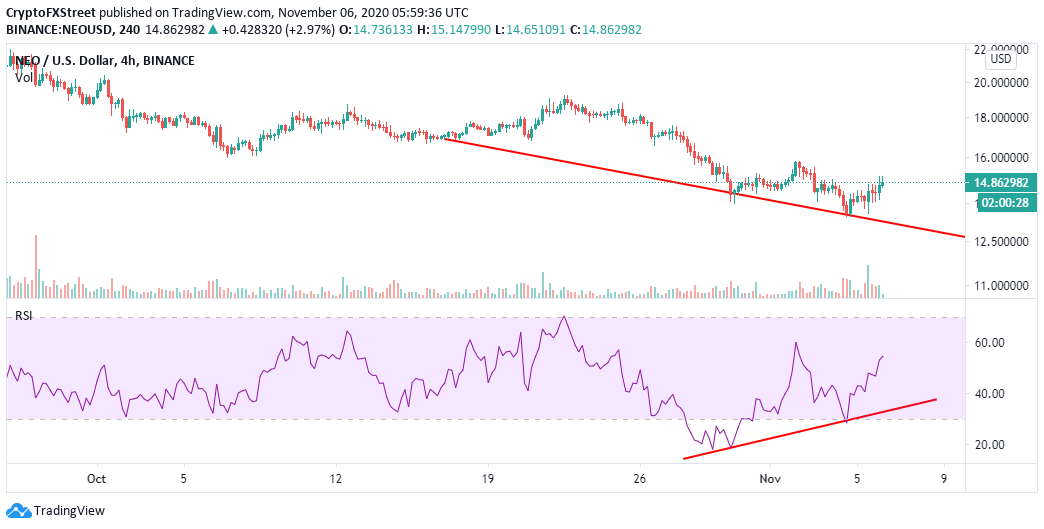
NEO/USD 4-hour chart
It is worth noting that the bullish outlook will be invalidated if NEO gets rejected from the immediate resistance at $15. Downward momentum will also gain traction if the 200-day support is shattered. The drop might not be so kind to the bulls, mainly because the next critical support is $9.5.
Author

John Isige
FXStreet
John Isige is a seasoned cryptocurrency journalist and markets analyst committed to delivering high-quality, actionable insights tailored to traders, investors, and crypto enthusiasts. He enjoys deep dives into emerging Web3 tren




