|

NEO Price Analysis: NEO/USD rips higher once again past 12.00

  • NEO/USD is trading 14.32% higher on Monday as bulls continue to be in control.
  • There is a key resistance zone coming up beyond the 13.00 level.

NEO/USD daily chart

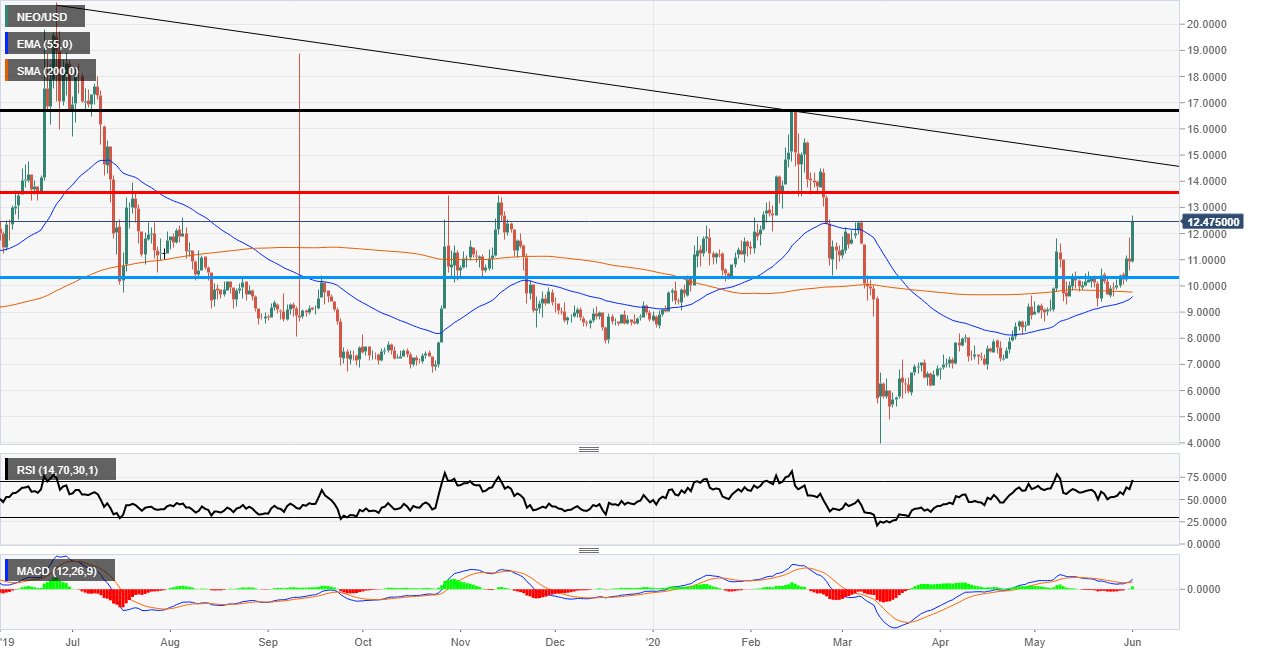
Neo is one of the major outperformers on Monday as the price has risen over 14% on the session. The psychological 13.00 is the next target after 12.00 was broken with ease in the EU session. 

Looking at the daily chart, the next major resistance is on the red horizontal line at 13.4450. This level has been used many times as both support and resistance but between October and December 2019 there was a sell-off at the zone.

The Relative Strength Index indicator has moved into overbought territory which could mean there is a pullback in the short term. The MACD histogram has moved above the zero line and the signal lines are both above the mid-point which is bullish. Lastly, the two key moving averages (55 & 200) are about to have a bullish cross. So all in all all signals are go for NEO.
NEO Price Rise

Author

Rajan Dhall, MSTA

Rajan Dhall is an experienced market analyst, who has been trading professionally since 2007 managing various funds producing exceptional returns.


More from Rajan Dhall, MSTA
Share:

Editor's Picks

Top Altcoins Price Forecast: XRP and ADA rebound as DOGE lags behind

The broader cryptocurrency market shows early signs of a bullish recovery, with Bitcoin rising above $65,000 amid improving retail sentiment. Top altcoins, including Ripple and Cardano, are gaining bullish momentum, while Dogecoin continues to consolidate, holding above a crucial support zone.

Ripple and Stellar outlook: Mixed signals keep traders at a crossroads

Ripple and Stellar trade within tight ranges as traders await the next directional move. XRP’s technical indicators suggest bearish momentum is fading, while XLM continues to consolidate near a critical support zone. Mixed derivatives metrics highlight growing market indecision, raising the likelihood of a volatile breakout in either direction in the coming days.

Shiba Inu Price Forecast: Extends gains as on-chain and derivatives metrics confirm bullish bias

Shiba Inu extends gains, trading above $0.0000042 after breaking above the descending trendline the previous day. Strengthening on-chain data and improving derivatives metrics support further gains for the meme coin. CryptoQuant’s exchange netflow chart below shows five consecutive days of net outflows since July 17.

Bitcoin climbs above $65K as ETF flows recover despite rising macro risks
Bitcoin (BTC) has climbed above $65,000 on Monday as improving onchain activity, recovering US spot Bitcoin exchange-traded fund (ETF) flows, and stabilizing derivatives point to a more balanced market, according to Glassnode.
Bitcoin’s potential recovery in the second half hinges on these 4 catalysts
Bitcoin (BTC) has fallen over 34% in the first half of this year as the King Crypto failed to capitalize on a good semester for risk assets despite the woes from the Iran war.