NEO price analysis: NEO/USD penetrating $58, a break below could be devastating, as support line has been holding since October 2017
- NEO/USD down over 6% on Tuesday, a standout under-performer within the session.
- Losses within the week so far seen in excess of 12%, as crypto market continues 2017 bearish trend.

The NEO price is a standout under-performer on Tuesday, nursing losses of 6% in the latter stages of the session. This comes inline with the pressure seen across the board in the day, but also so far this week.
NEO/USD is down on the week 12%, after just two trading sessions so far. NEO has been under pressure since hitting $94 on 30th April, running short of returning to $100, last traded here on 8th March.
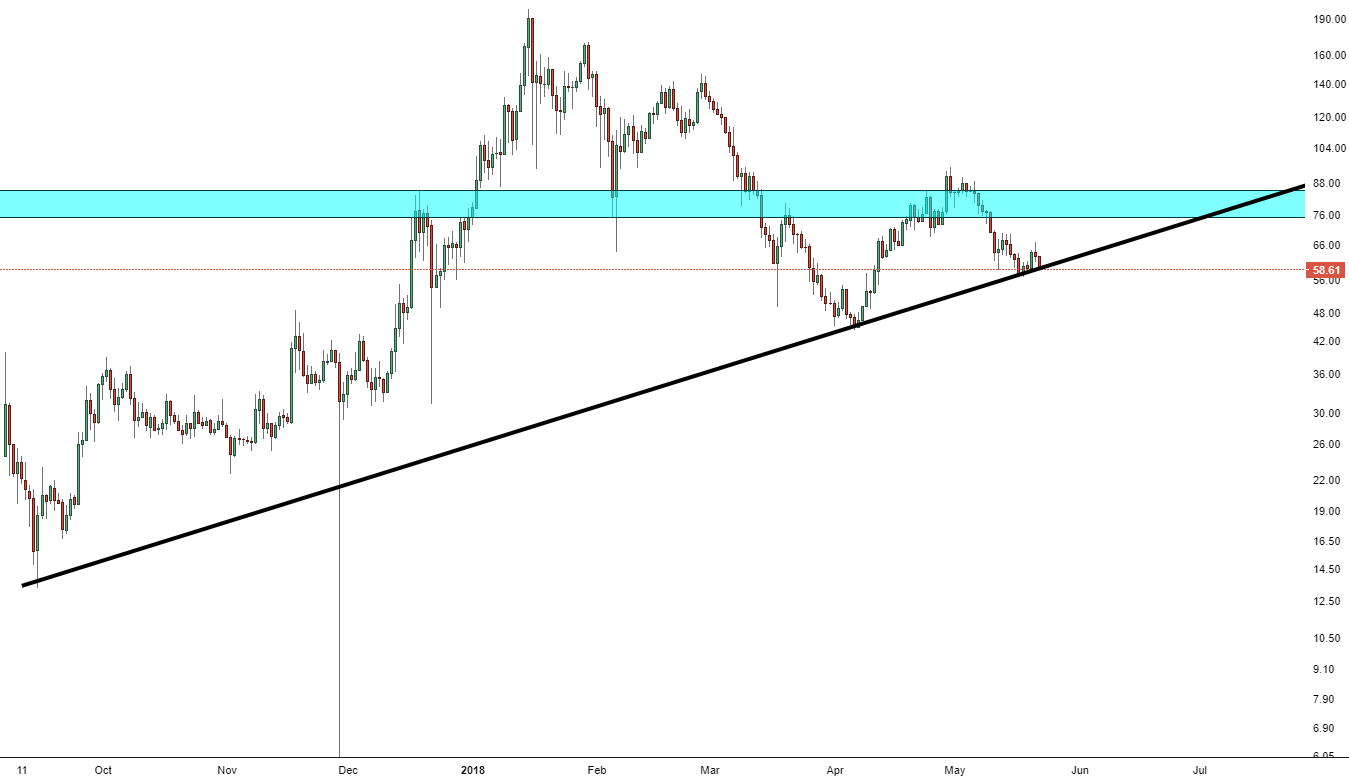
Technically, NEO/USD is testing a very key area of support, tracking at $58-58.50, this is where the long-running trend line sits, which has been running since September 2017. A breach can see the bears take the price down to $45, the lows seen at the start of April, Resistance is seen at the mid $60 range and then from $75-85.
NEO/USD daily chart
Author

Ken Chigbo
Independent Analyst
Ken has over 8 years exposure to the financial markets. He started his career as an analyst, covering a variety of asset classes; forex, fixed income, commodities and equities.


