- XMR/USD hit the highest levels in nine days at $165.66.
- The coin broke the rising channel to the upside on the 4H chart.
- RSI recedes from the overbought territory but stays bullish.
Monero (XMR/USD) witnessed a quick retracement from nine-day highs of $165.66, holding a major part of the intraday gains so far this Sunday.
The digital asset saw a fresh spurt of buying after it recaptured the critical 100 and 200-simple moving averages (SMA) on the four-hour chart.
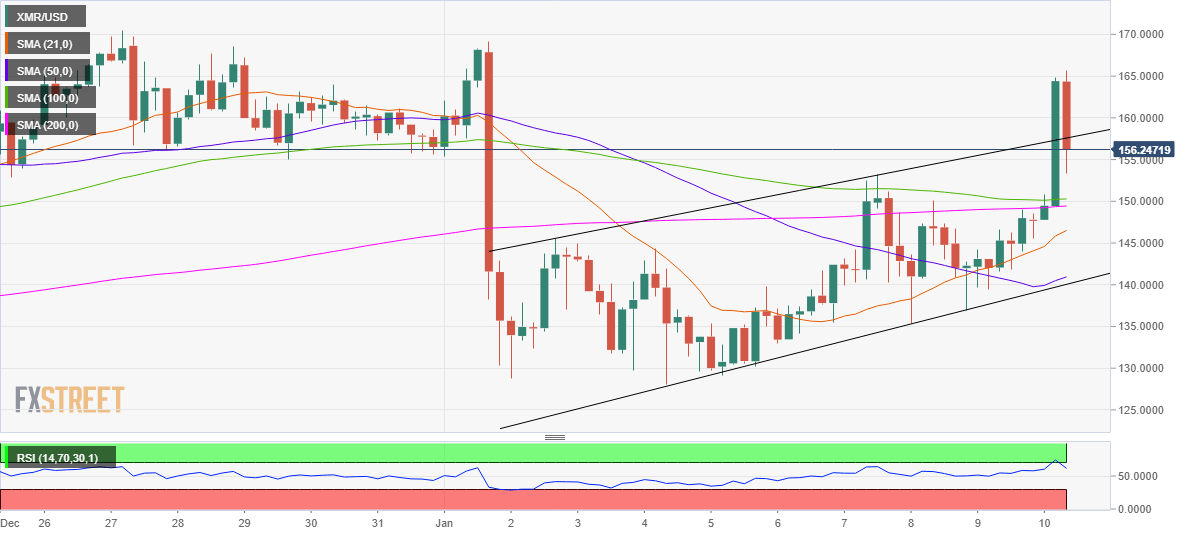
XMR/USD: Four-hour chart
The bulls extended control, prompting the price to dive out of the rising channel formation. A firm break above the rising trendline hurdle at $157.20, validated the pattern, opening doors towards the measured target at around $182.
Over the last hour, the sellers seem to have fought back, as the price drops back below the pattern resistance now support at $157.20.
If the pullback picks up pace, a test of the key $150 support cannot be ruled out. That level is the meeting point of the horizontal 100 and 200-SMAs.
Further south, the upward-sloping 21-SMA at $146.53 could come to the XMR bulls’ rescue.
The latest leg down is backed by the U-turn seen in the Relative Strength Index (RSI) from the overbought region. The indicator still holds in the bullish region despite the reversal, suggesting that the upside bias remains intact.
XMR/USD: Additional levels
Information on these pages contains forward-looking statements that involve risks and uncertainties. Markets and instruments profiled on this page are for informational purposes only and should not in any way come across as a recommendation to buy or sell in these assets. You should do your own thorough research before making any investment decisions. FXStreet does not in any way guarantee that this information is free from mistakes, errors, or material misstatements. It also does not guarantee that this information is of a timely nature. Investing in Open Markets involves a great deal of risk, including the loss of all or a portion of your investment, as well as emotional distress. All risks, losses and costs associated with investing, including total loss of principal, are your responsibility. The views and opinions expressed in this article are those of the authors and do not necessarily reflect the official policy or position of FXStreet nor its advertisers. The author will not be held responsible for information that is found at the end of links posted on this page.
If not otherwise explicitly mentioned in the body of the article, at the time of writing, the author has no position in any stock mentioned in this article and no business relationship with any company mentioned. The author has not received compensation for writing this article, other than from FXStreet.
FXStreet and the author do not provide personalized recommendations. The author makes no representations as to the accuracy, completeness, or suitability of this information. FXStreet and the author will not be liable for any errors, omissions or any losses, injuries or damages arising from this information and its display or use. Errors and omissions excepted.
The author and FXStreet are not registered investment advisors and nothing in this article is intended to be investment advice.
Recommended Content
Editors’ Picks
We found missing market data for the Compound price; you won't believe how high COMP can rally

Compound's COMP price could be a very favorable digital asset in the coming weeks. This article is meant to inform investors of data excluded on Tradingview's Binance, Coinbase and Kucoin exchanges for reasons that have yet to be explained.
Solana price shows early signs of weakness, here’s the scenario investors should be aware of

Solana price shows early signs of a bearish downtrend underway. The invalidation level is a vital determinant of future price action. Solana price shows exhaustion as the bulls have lost the battle for the $40 barrier.
Dogecoin price will be $0.01 or $1.00 by the end 2022, here’s why

Dogecoin price pulls back to $0.06 after seeing rejection just below the $0.08 barrier on Monday. DOGE price points to $0.055 as a bearish confluence zone on the Fibonacci Projection Indicator. Invalidation of the bullish uptrend remains $0.048 with one caveat.
Top 3 Price Prediction Bitcoin, Ethereum, Ripple: Summertime bull-run a multi-year bear market?

Bitcoin price is currently trading at $20,727. Investors will likely stay on the sidelines until the peer-to-peer digital currency can hurdle above the 200-week simple moving average (SMA), currently priced at $22,540.
Bitcoin: Everything you need to know about BTC 200-week MA

Bitcoin price has gone through turbulent times over the last few months. From reaching a new all-time high to hitting yearly lows and revisiting levels since 2020, the crypto markets have been extremely volatile.