Monero Price Forecast: XMR rally at risk as RSI flashes bearish divergence
- Monero edges lower by 2% on Monday, extending the loss from Sunday.
- Derivatives data indicates persistent risk-on sentiment among traders with heightened Open Interest.
- The technical outlook remains grim as the RSI indicator flashes a bearish divergence.

Monero (XMR) trades below $400 on Monday, extending the loss from the previous day. The intraday pullback in the privacy coin risks a double-top reversal as RSI flashes a sell signal. This also puts the rising optimism in the XMR derivatives market, indicated by heightened futures Open Interest, at risk.
Monero’s derivatives market remains optimistic
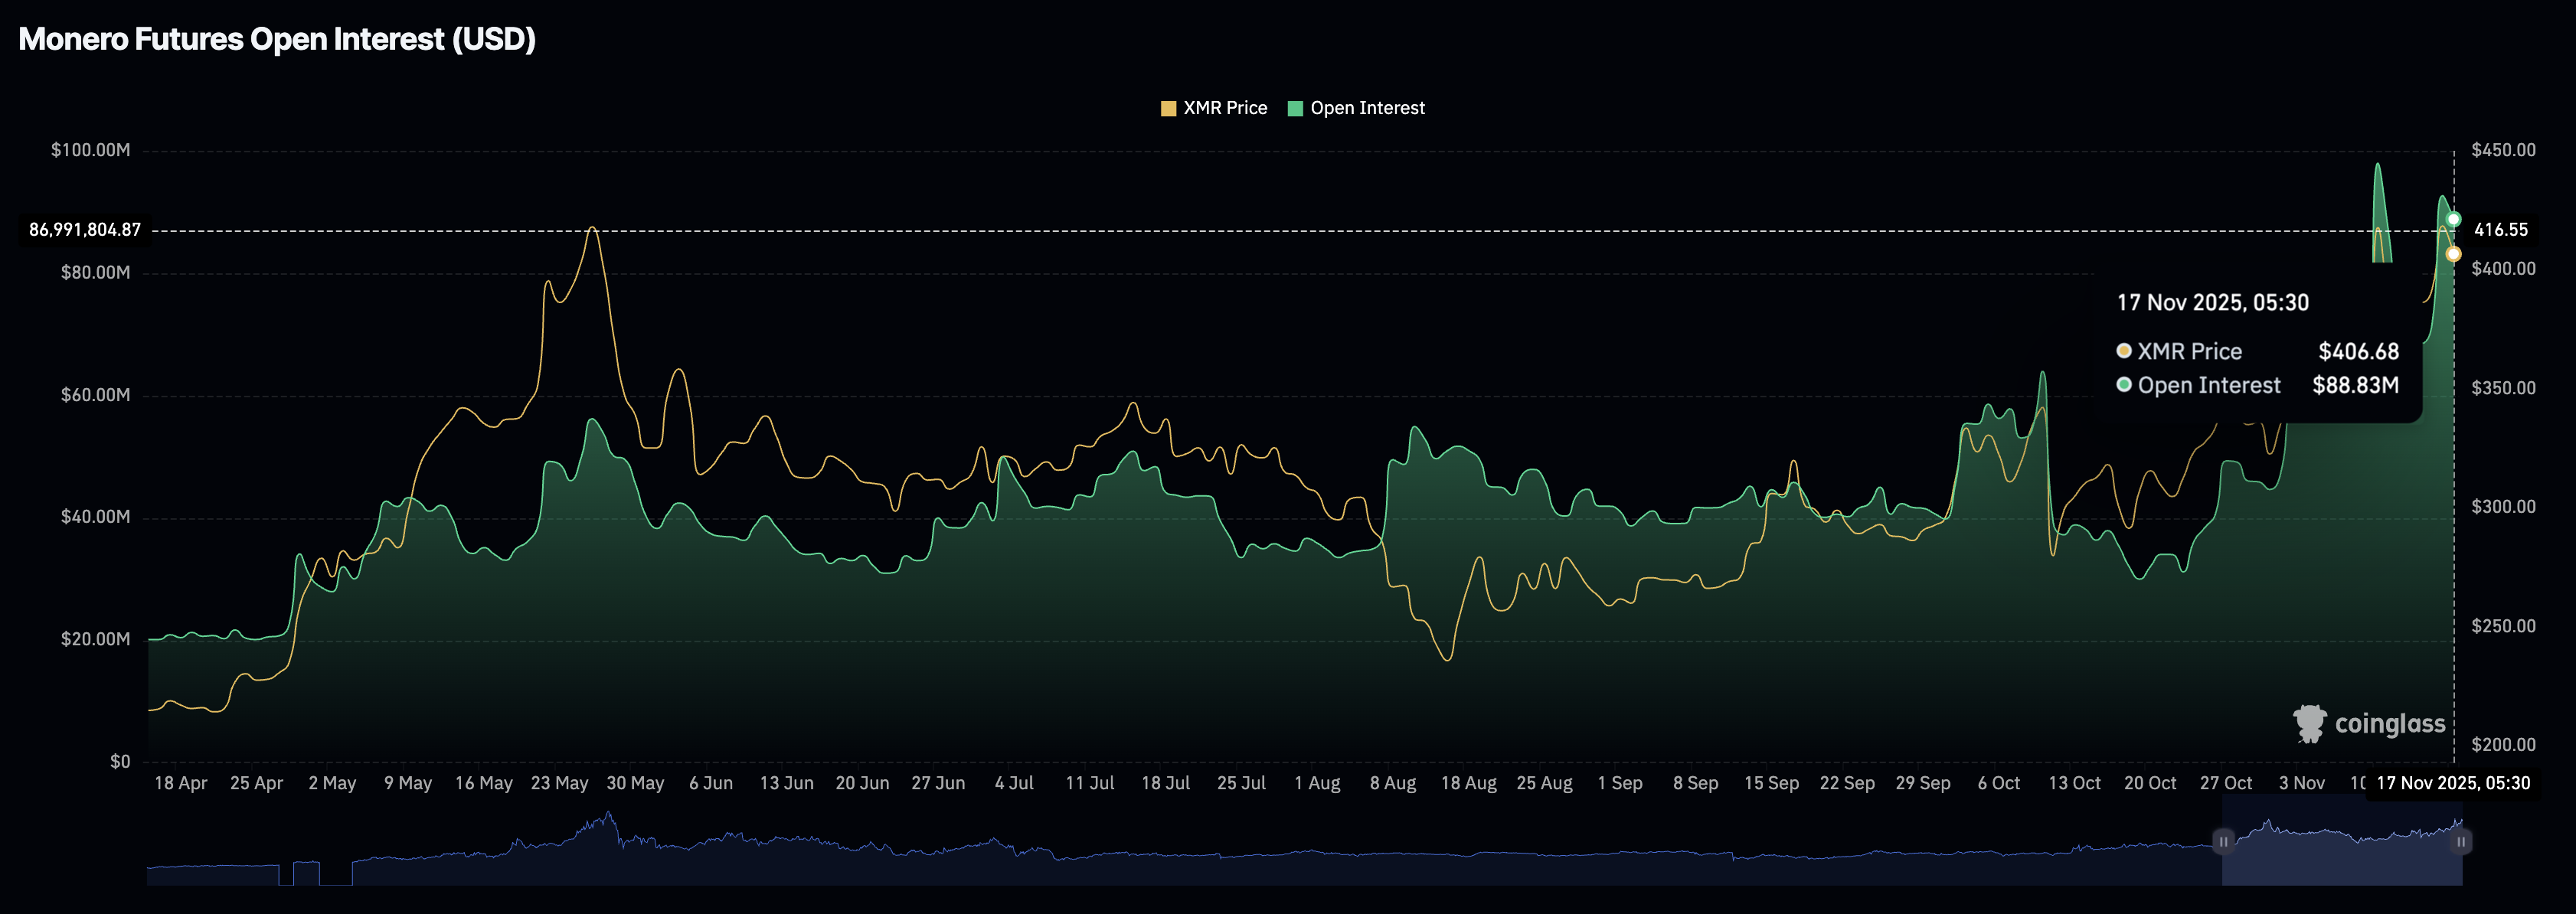
Monero retains retail interest as the privacy coins outperform the broader market. According to the CoinGlass data, the XMR futures Open Interest (OI) – notional value of all outstanding futures contracts – stands at $88.83 million, close to the annual high of $97.98 million from November 10. This indicates strength in the traders’ sentiment, anticipating potential recovery.
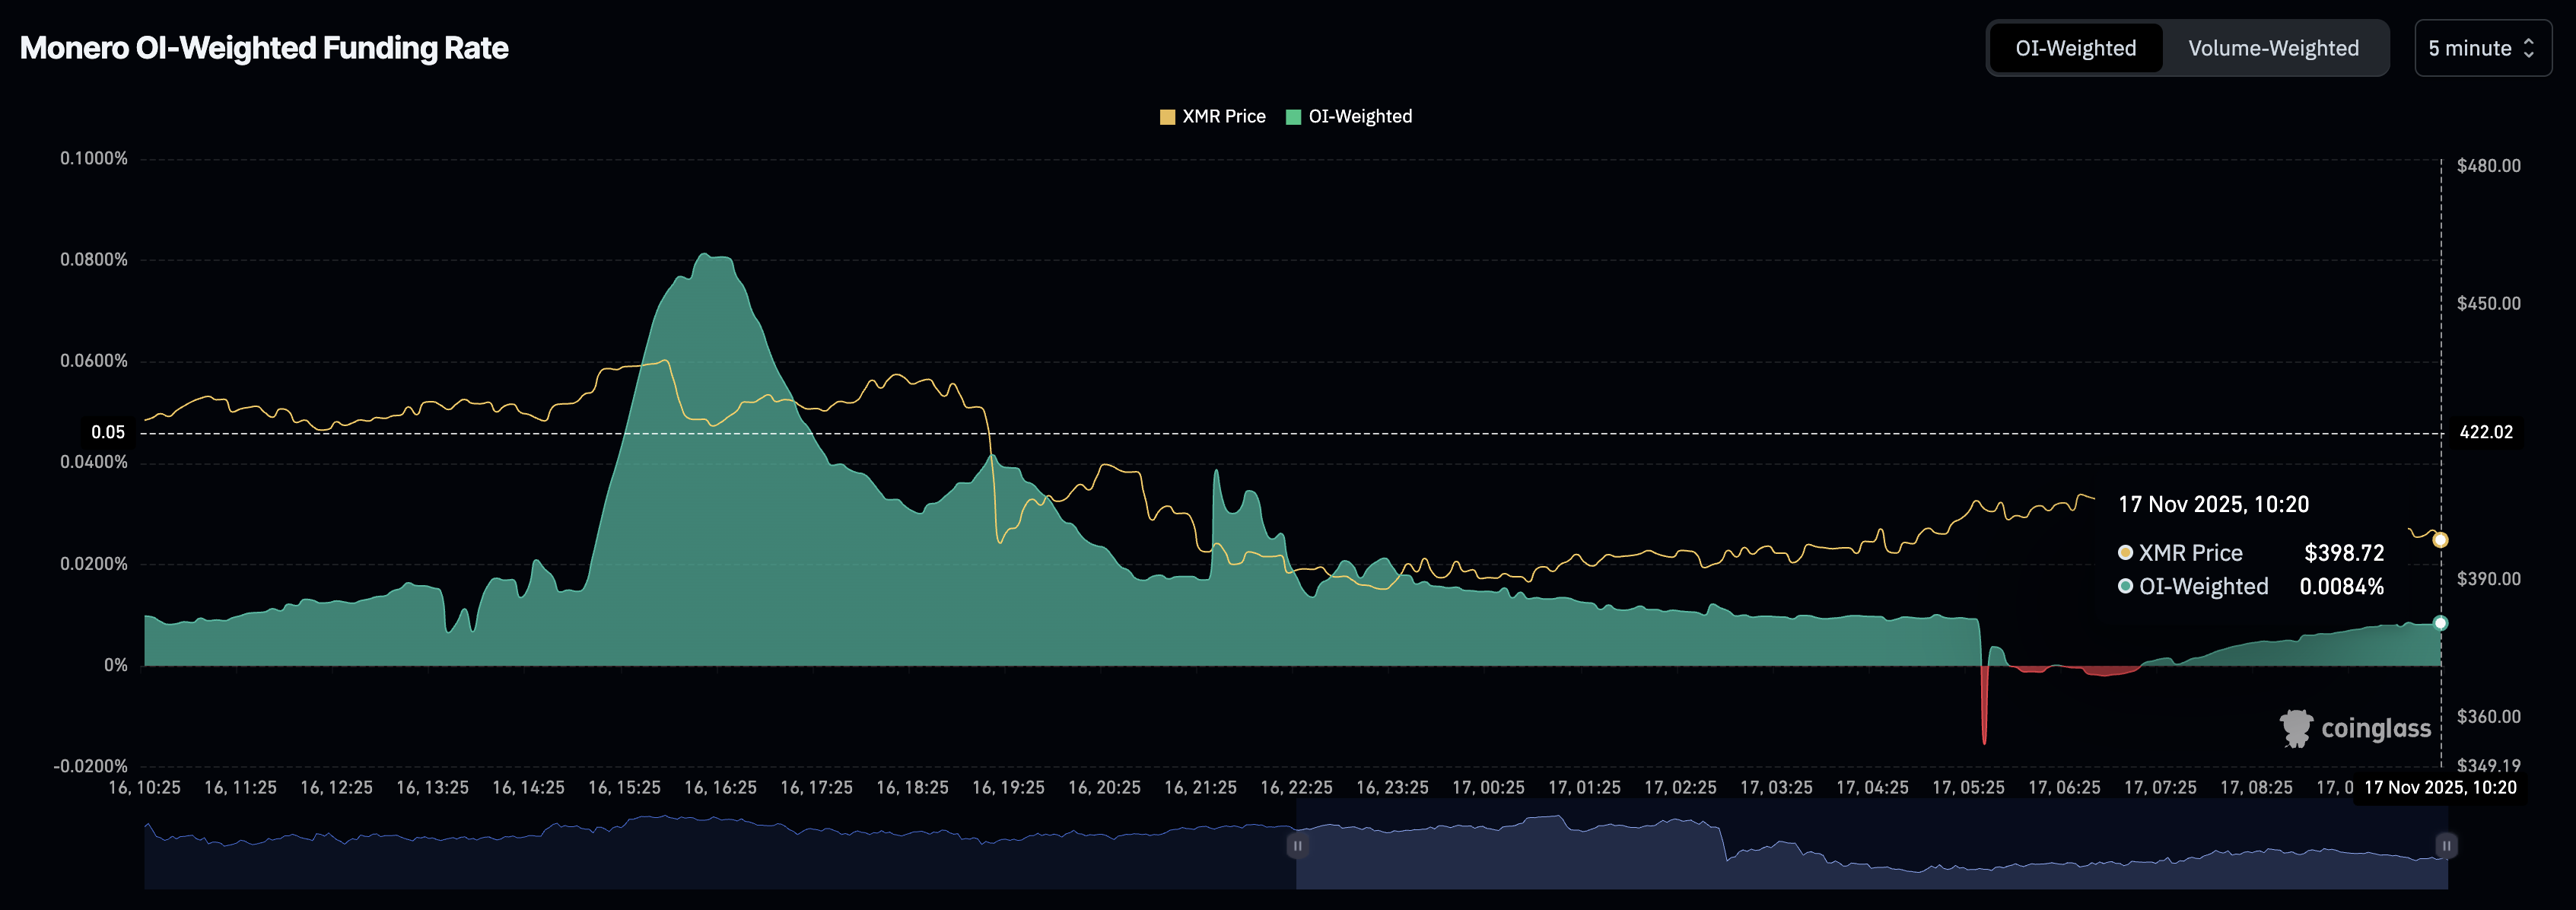
In line with the increasing OI, the OI-weighted funding rate flips to a positive 0.0084% after a sudden negative shift, earlier in the day. This indicates that buyers are willing to hold long positions.
Monero risks further losses as bullish momentum wanes
Monero slips below $400 on Monday, extending the 2.54% pullback from Sunday, which completes the second peak of a potential double-top pattern at $419. At the time of writing, the privacy coin is down 2%, with bears targeting the neckline at the $358 level, marked by the July 14 high.
If XMR fails to remain buoyant above $358, it could extend the decline to the 50-day Exponential Moving Average (EMA) at $344, followed by the 100-day EMA at $324.
The momentum indicators on the daily chart signal a decline in bullish momentum, as the Relative Strength Index (RSI) at 59 moves down from the overbought zone, indicating a waning of buying pressure. Additionally, the lower high formation in RSI flashes a bearish divergence compared to Monero’s double top formation, risking further losses.
The Moving Average Convergence Divergence (MACD) moves closer to the signal line, risking a potential crossover with renewed bearish momentum.
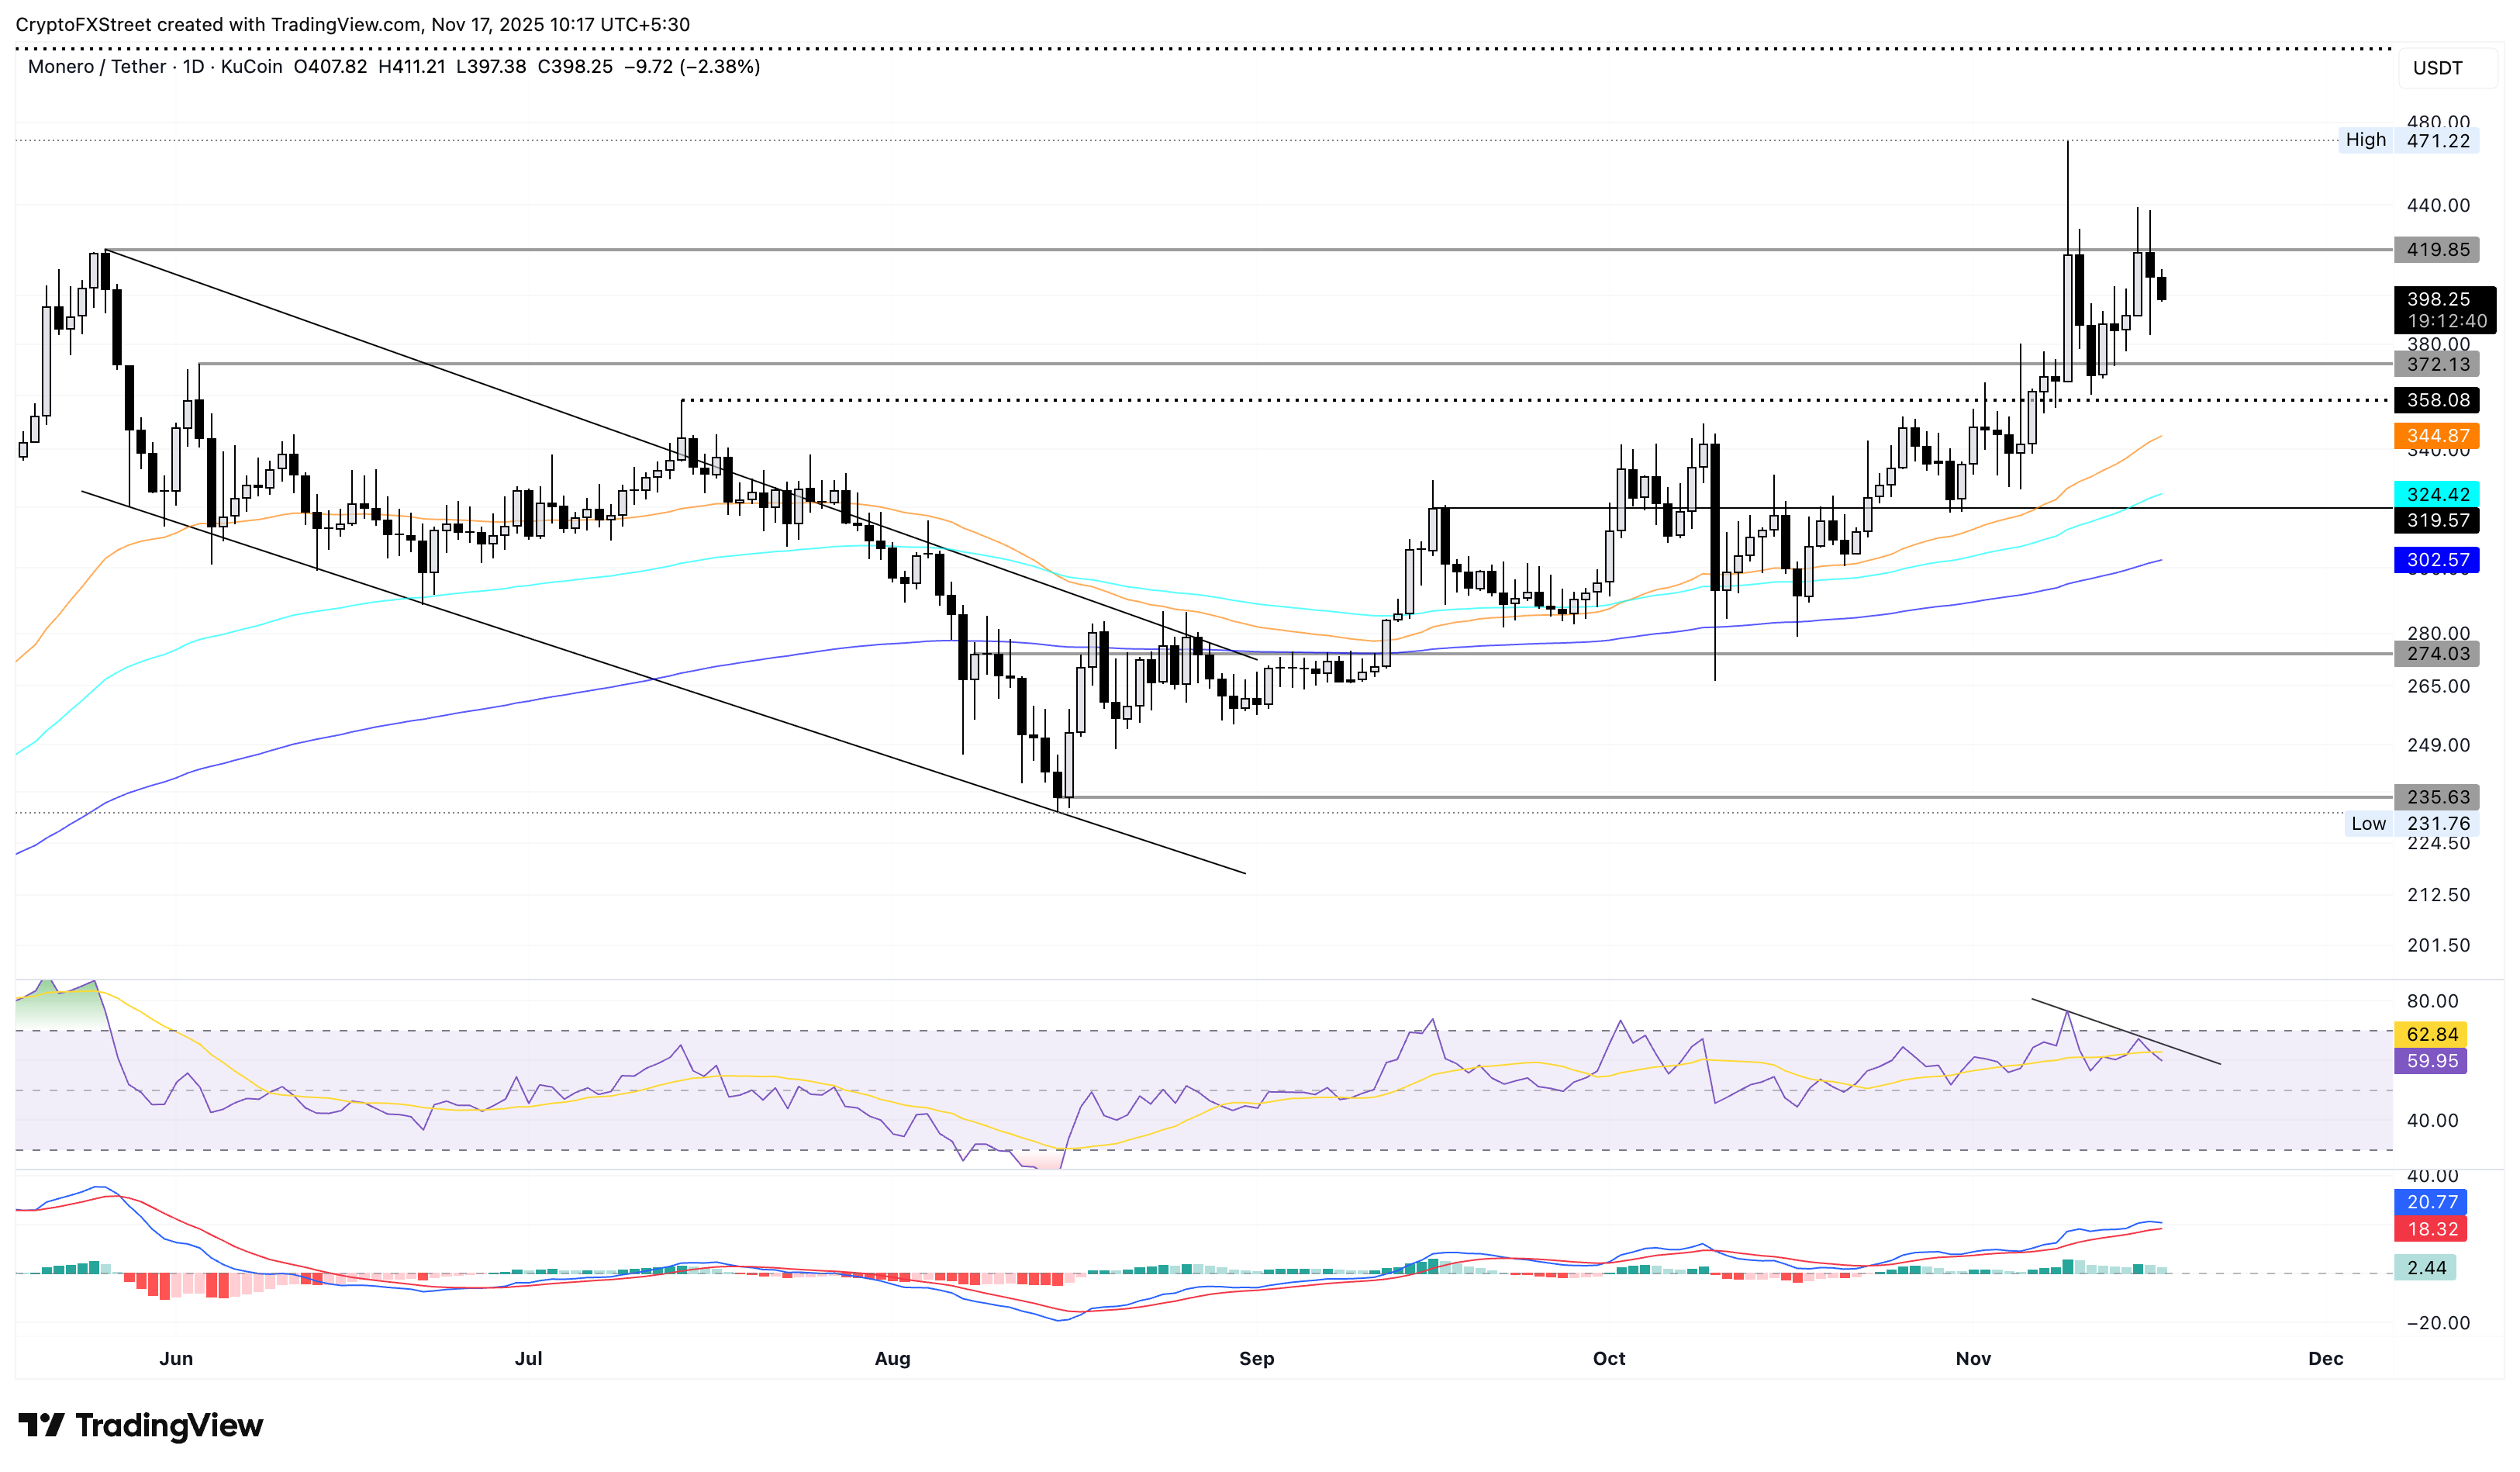
On the flip side, if XMR surpasses $419, it could target the $471 high from November 9.
Author

Vishal Dixit
FXStreet
Vishal Dixit holds a B.Sc. in Chemistry from Wilson College but found his true calling in the world of crypto.



