|

Monero price analysis: XMR/USD drops by 4.20% this Tuesday

  • XMR/USD dropped from $75.15 to $72 so far this Tuesday.
  • Elliott oscillator has a bearish session after eight straight bullish sessions.

XMR/USD managed to string together three bearish days in a row. This Tuesday, the price of Monero has fallen from $75.15 to $72, charting a 4.20% drop. Over the last three days, XMR/USD has fallen from 78.40 to $72. The hourly breakdown of Tuesday shows us that the price went up till $76 and then plummetted to $72.35. The bulls then immediately stepped back in to correct the price to $74. The bears then regained control and took the price of XMR/USD down to $72. 

XMR/USD daily chart

fxsoriginal

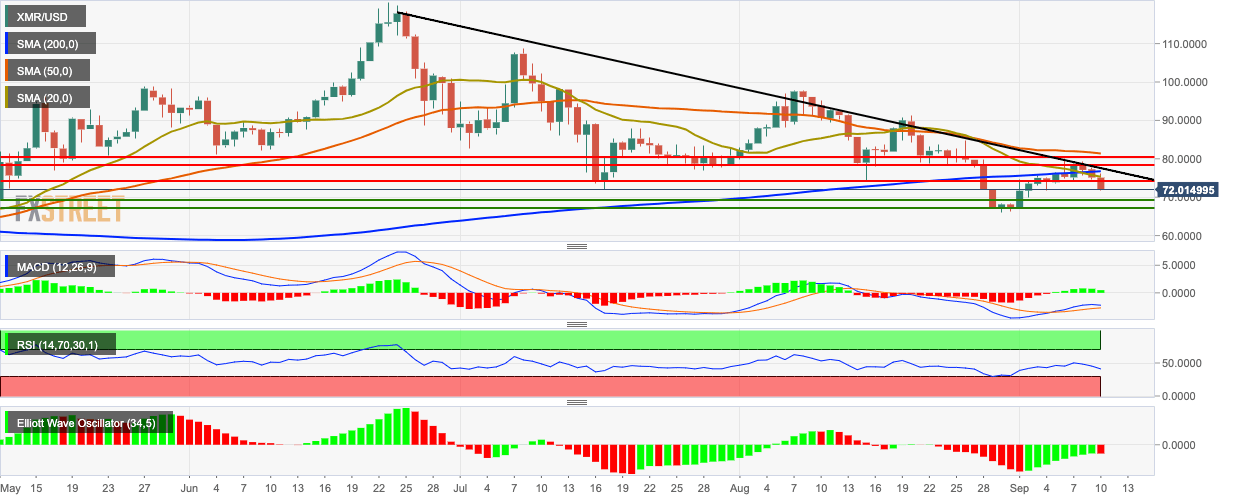
XMR/USD has found resistance at the downward trending line, the 200-day simple moving average (SMA 200) and the SMA 20 curves. The SMA 200 has crossed over the SMA 20 curve, which is a bearish sign. The moving average convergence/divergence (MACD) indicator shows decreasing bullish momentum. The relative strength index (RSI) indicator has dropped from 50.80 to 41.25. The Elliott oscillator has a bearish session after eight straight bullish sessions.
 

Author

Rajarshi Mitra

Rajarshi Mitra

Independent Analyst

Rajarshi entered the blockchain space in 2016. He is a blockchain researcher who has worked for Blockgeeks and has done research work for several ICOs. He gets regularly invited to give talks on the blockchain technology and cryptocurrencies.

More from Rajarshi Mitra
Share:

Editor's Picks

Ripple bulls defend key support amid waning retail demand and ETF inflows

XRP ticks up above $1.40 support, but waning retail demand suggests caution. XRP attracts $4 million in spot ETF inflows on Thursday, signaling renewed institutional investor interest.

Crypto Today: Bitcoin, Ethereum, XRP rebound as risk appetite improves

Bitcoin rises marginally, nearing the immediate resistance of $68,000 at the time of writing on Friday. Major altcoins, including Ethereum and Ripple, hold key support levels as bulls aim to maintain marginal intraday gains.

Bitcoin Weekly Forecast: No recovery in sight 

Bitcoin price continues to trade sideways between $65,729 and $71,746, extending its consolidation since February 7. US-spot ETFs record an outflow of $403.90 million through Thursday, pointing to the fifth consecutive week of withdrawals.

Pi Network Price Forecast: PI recovery stalls amid profit-taking

Pi Network tests 50-day EMA support on Friday, after a 5% decline the previous day. PiScan data shows large deposits on CEXs totaling over 4 million PI tokens in the last 24 hours, reflecting an exodus of investors taking profits.

Bitcoin Price Annual Forecast: BTC holds long-term bullish structure heading into 2026

Bitcoin (BTC) is wrapping up 2025 as one of its most eventful years, defined by unprecedented institutional participation, major regulatory developments, and extreme price volatility.

Bitcoin: No recovery in sight

Bitcoin (BTC) price continues to trade within a range-bound zone, hovering around $67,000 at the time of writing on Friday, and falling slightly so far this week, with no signs of recovery.