Meme Coins Price Prediction: BONK, WIF, TOSHI at crossroads as crypto market melts down
- Bonk holds at a crucial psychological level after four straight days of losses.
- Dogwifhat tests a key support level after reversing from the 200-day EMA and a resistance trendline.
- Toshi extends a downward move within an ascending triangle pattern as bullish momentum declines.

Meme coins such as Bonk (BONK), Dogwifhat (WIF), and Toshi (TOSHI) stand at crucial trend-deciding crossroads on Tuesday as the broader cryptocurrency market suffers liquidations of over $1.50 billion in the last 24 hours. This crash reduced the market capitalization of the meme coin segment to $69.96 billion, down from $74.99 billion on Monday.
Still, the technical outlook shows potential in BONK, WIF, and TOSHI.
Derivatives data suggest a shift in trend
Sharp fluctuations in the derivatives data indicate a quick shift in traders’ sentiment. CoinGlass data shows that the Open Interest (OI) of BONK and WIF has increased by 1.97% and 2.33% over the last 24 hours, reaching $26.68 million and $328.63 million, respectively. This capital inflow indicates increased traders’ confidence in a potential reversal.
Adding to the reversal, the OI-weighted funding rates for BONK and WIF flipped positive, reaching 0.0100% and 0.0026% at the time of writing. This indicates that the bulls are paying a premium to hold a long position, which helps balance swap and spot prices due to the leverage available.
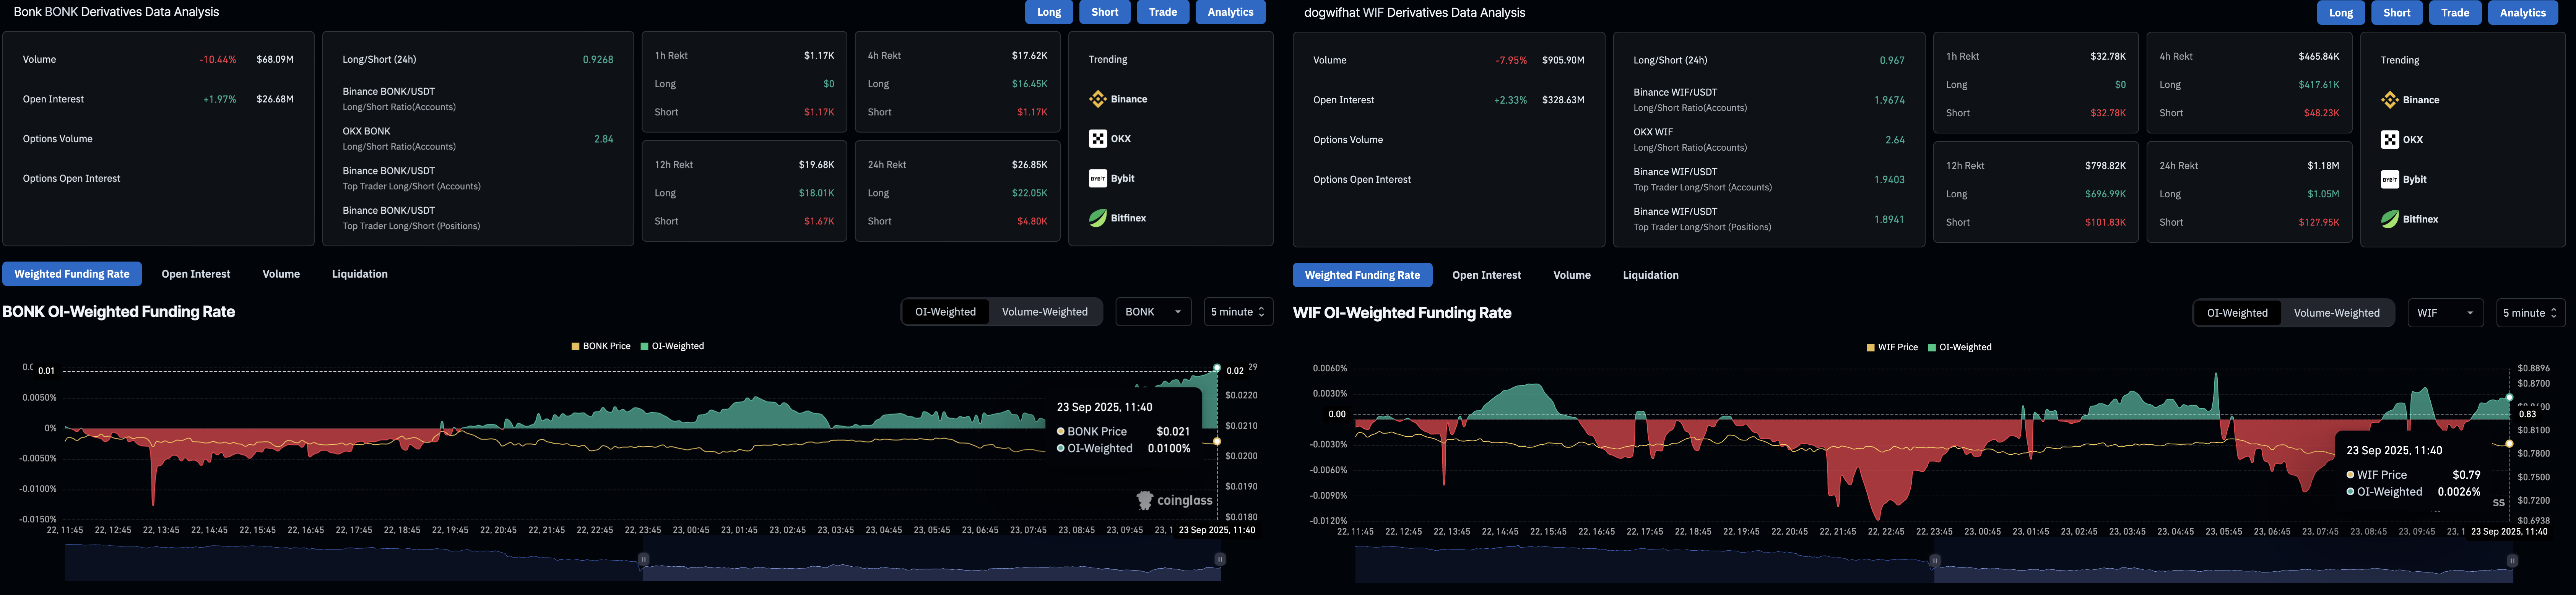
BONK and WIF derivatives. Source: CoinGlass
However, the TOSHI OI dropped by 4.35% to reach $9.66 million in the same timeframe, and the funding rate remains negative at -0.493%. This indicates a lowered interest among traders due to capital outflows.
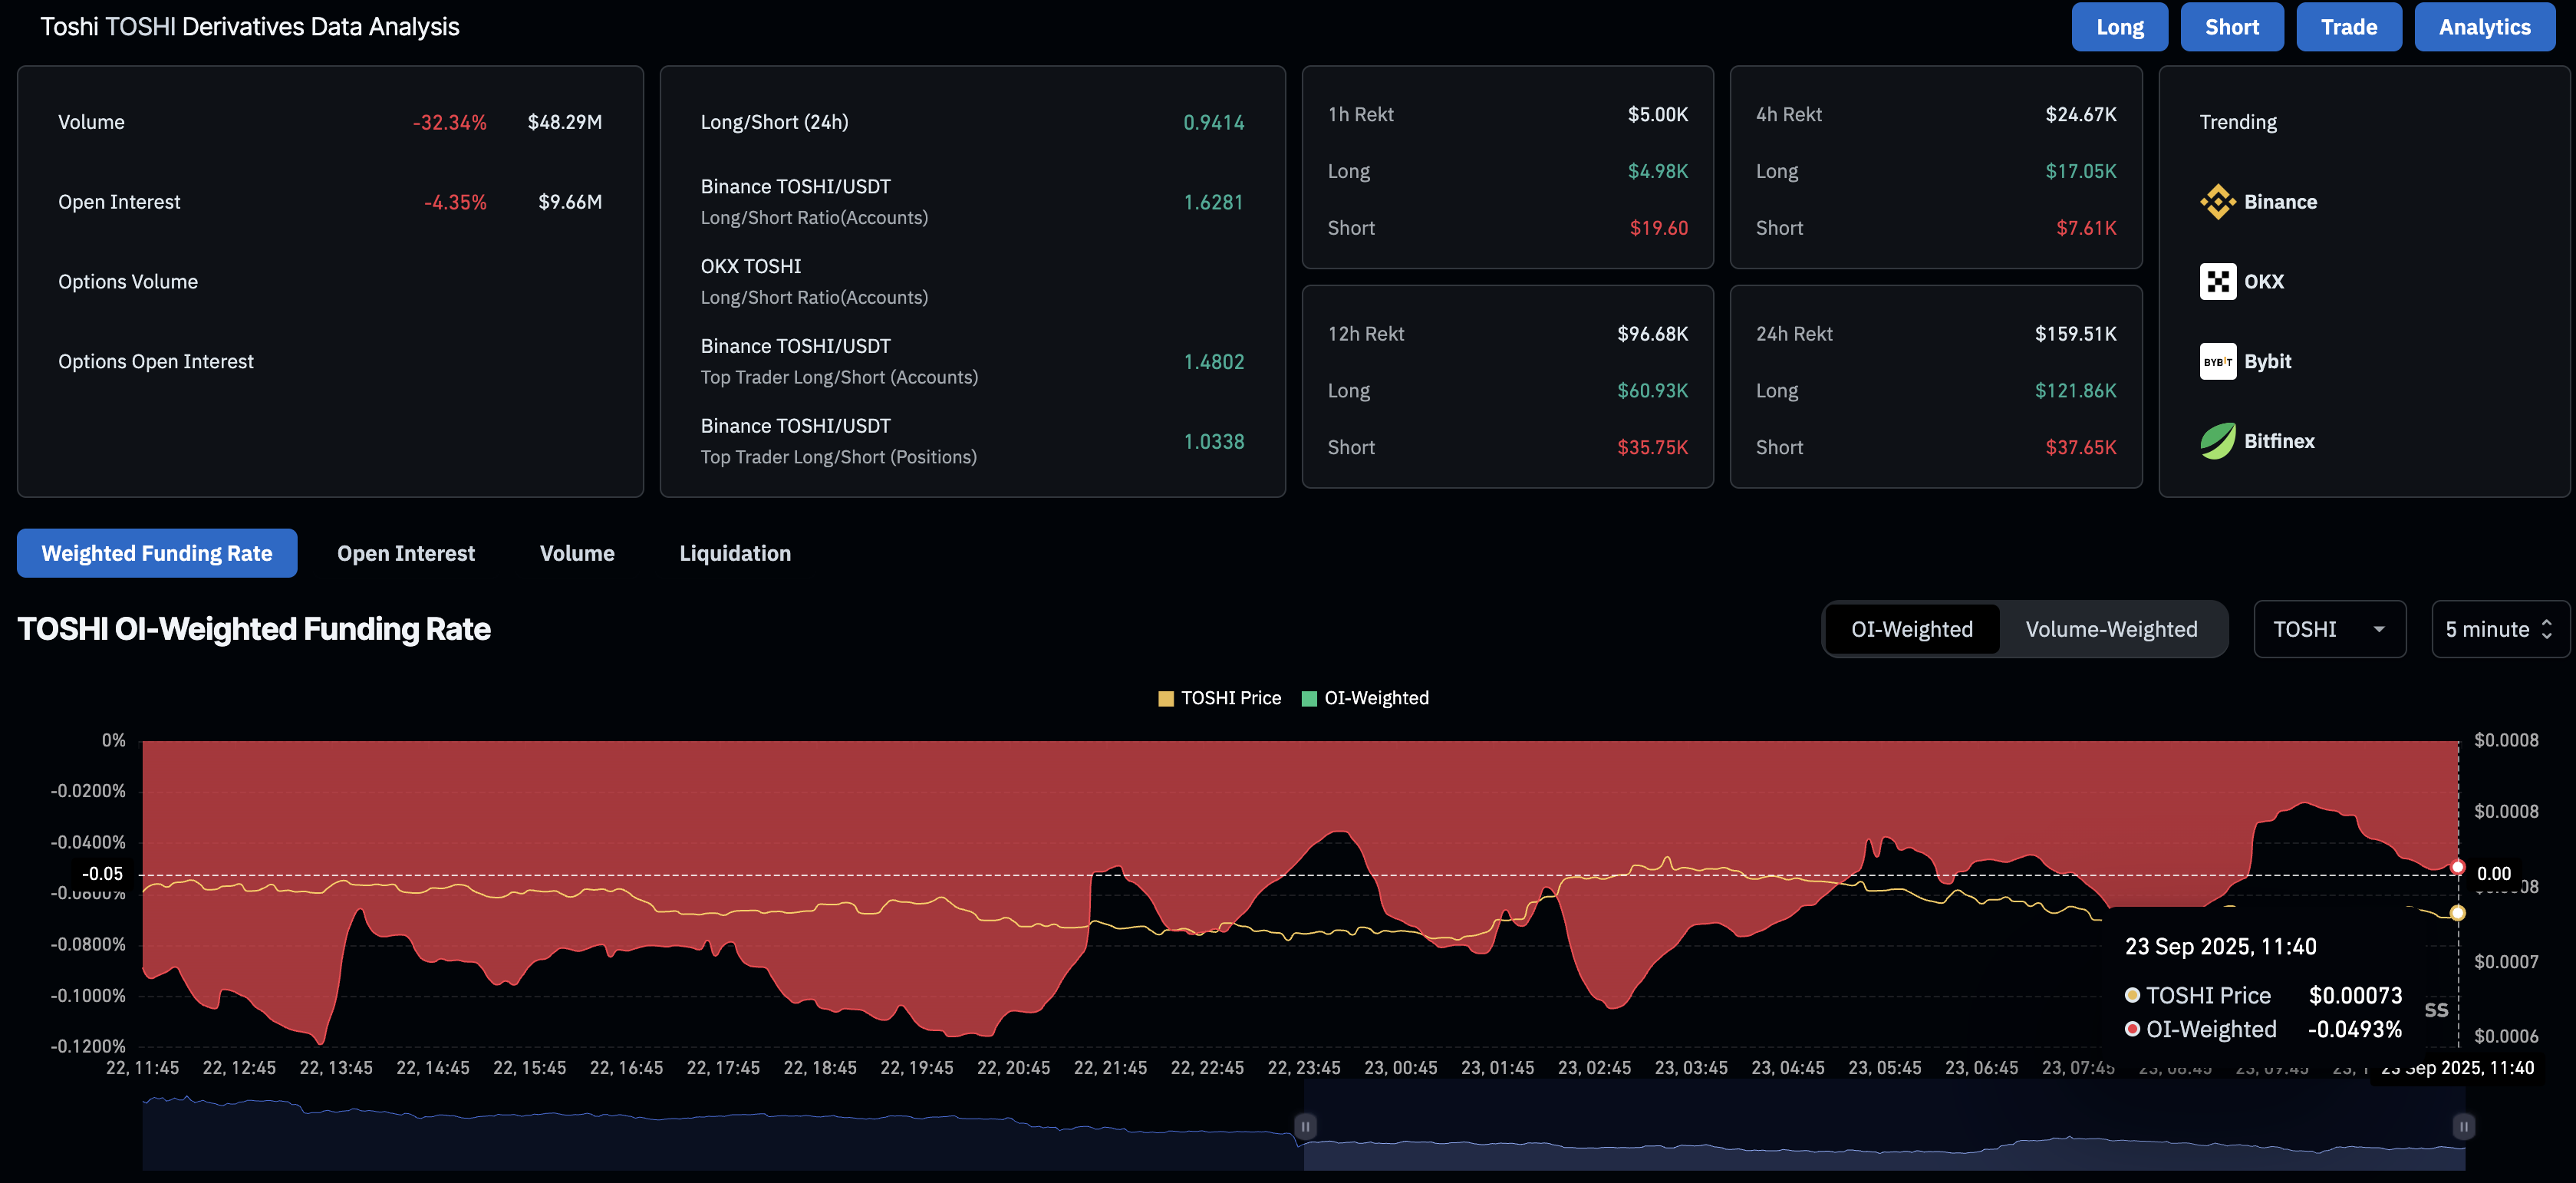
TOSHI derivatives. Source: CoinGlass
BONK’s short-term recovery teases a potential bounce back
Bonk trades above $0.00002000 psychological level at the time of writing on Tuesday, following a four-day downfall that crossed below the 200-day Exponential Moving Average (EMA) at $0.00002198. BONK ticks higher by 2% so far on the day as bulls struggle to sustain dominance at this psychological support.
To reinstate an uptrend, BONK should reclaim the 50% Fibonacci retracement level, from the high of $0.00006230 on November 20 to the low of $0.00000888 on March 11, at $0.00002353. This could result in an extended rally to the 61.8% Fibonacci retracement level at $0.00002961.
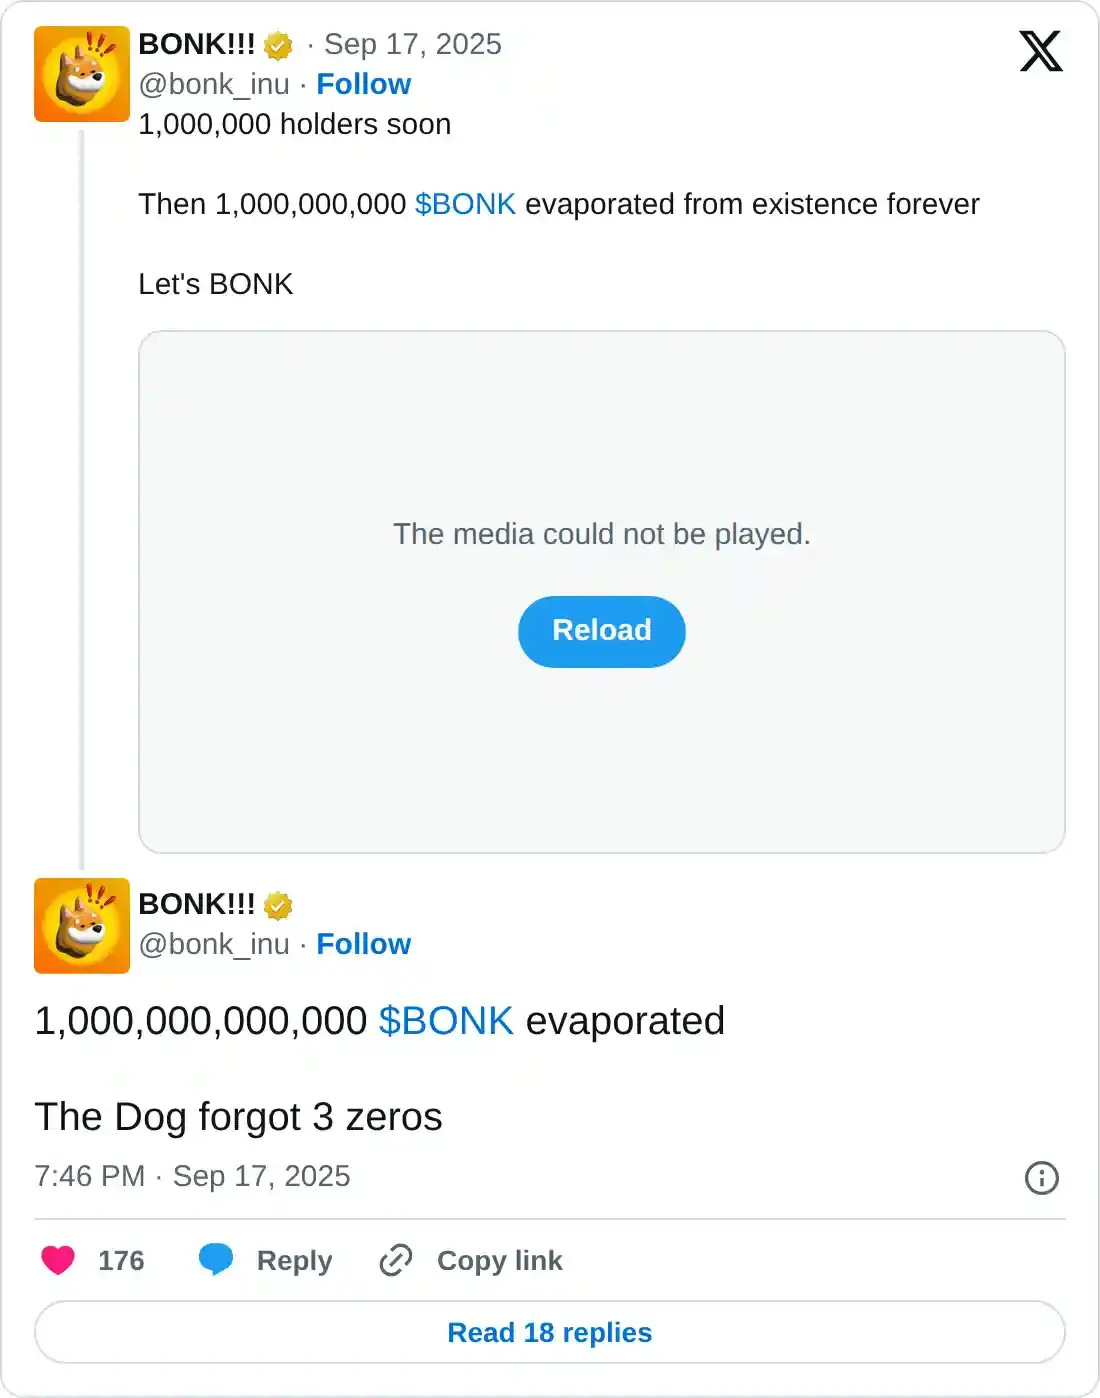
Furthermore, the SolScan data shows that the number of BONK holders has reached 984,992, inching closer to the 1 million mark. The dog-themed meme coin project has announced a planned burn of 1 trillion BONK tokens when the number of holders reaches 1 million. This could provide an upward pressure as the circulating supply of 81.24 trillion BONK will be reduced by roughly 1.24%.
Still, the momentum indicators suggest a negative shift in the trend, as the Relative Strength Index (RSI) drops below the halfway line to 42, indicating overhead pressure. Furthermore, the Moving Average Convergence Divergence (MACD) crossed below its signal line, triggering a sell signal as bearish momentum revives.
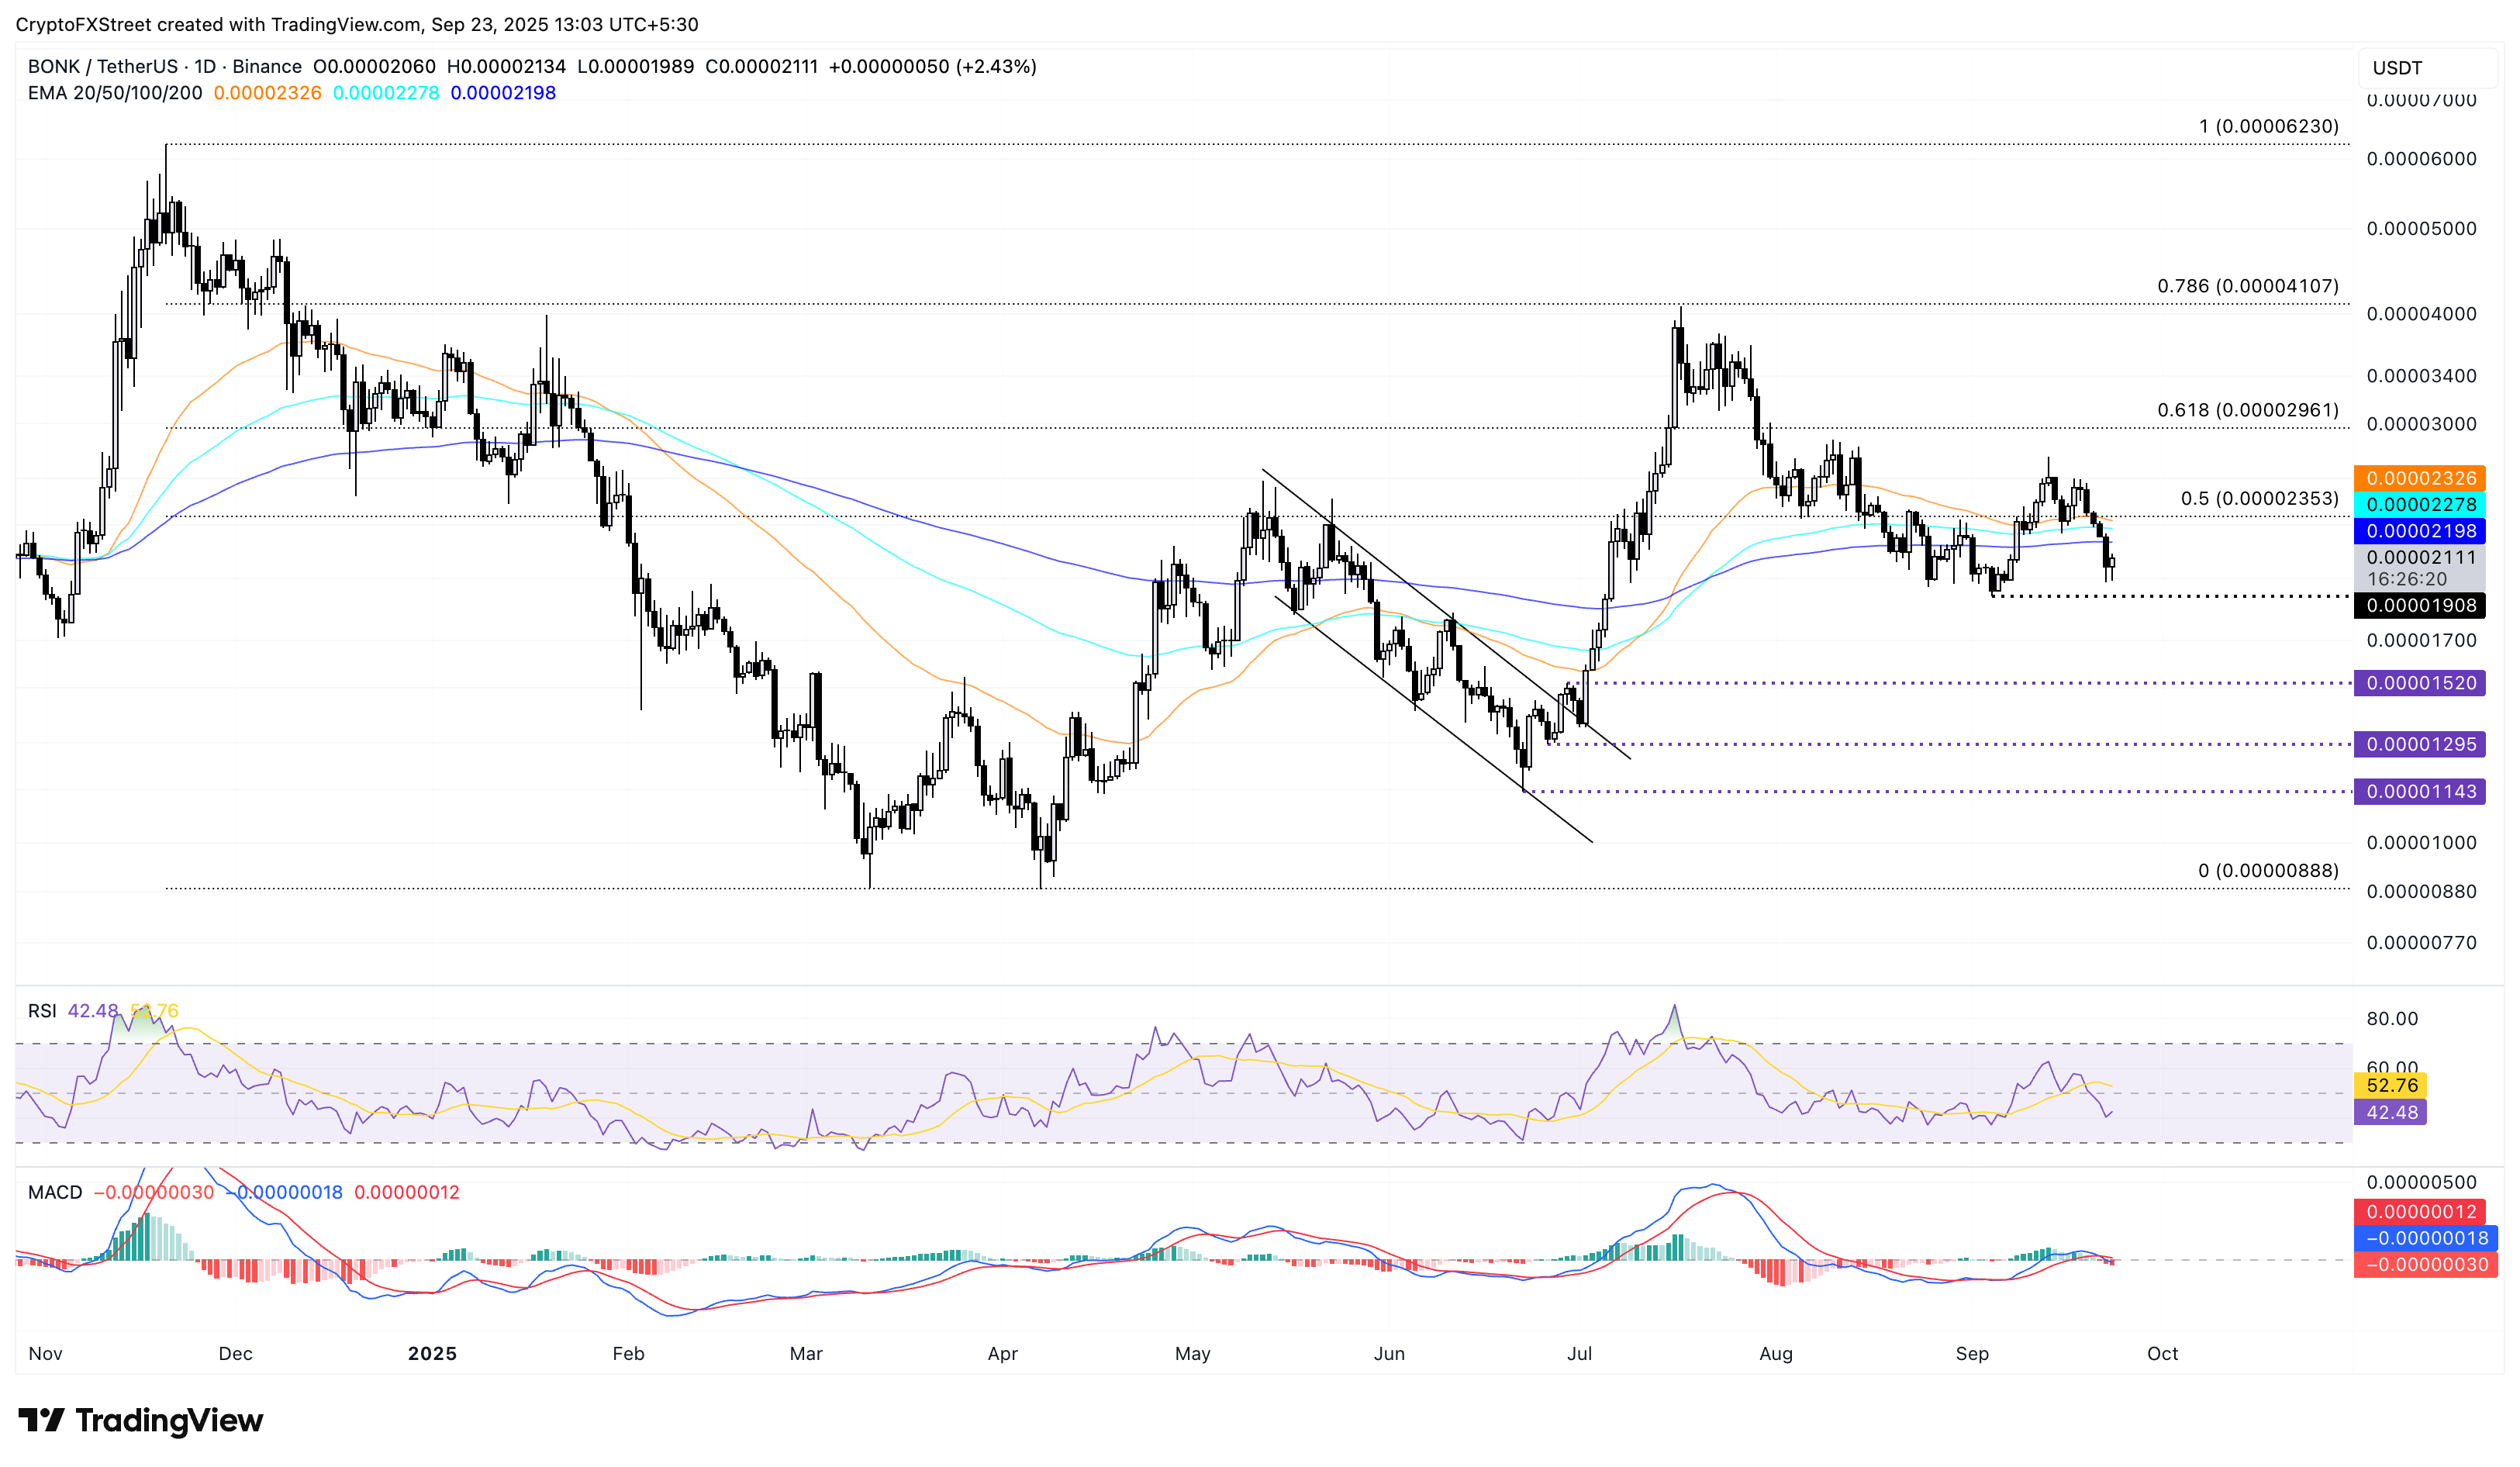
BONK/USDT daily price chart.
Looking down, if BONK marks a decisive close below the $0.00001908 low of September 3, it would invalidate the upside potential. This could result in an extended correction to $0.00001520.
Dogwifhat holds at a key support
Dogwifhat trades above $0.790 at press time on Tuesday, recovering from the daily low of $0.770. The meme coin reversed from the 200-day EMA on Friday, marking four consecutive days of losses. At the time of writing, WIF holds above the $0.761 support level, which was last tested on September 2 and acts as a crucial crossroads.
A decisive close below this level could extend the drop to the $0.550 level, last tested on May 7.
The technical indicators on the daily chart suggest a bearish shift as the MACD extends its downtrend after crossing below its signal line on Sunday. Furthermore, the RSI at 40, pointing downwards, shows further space for correction before reaching the oversold zone.
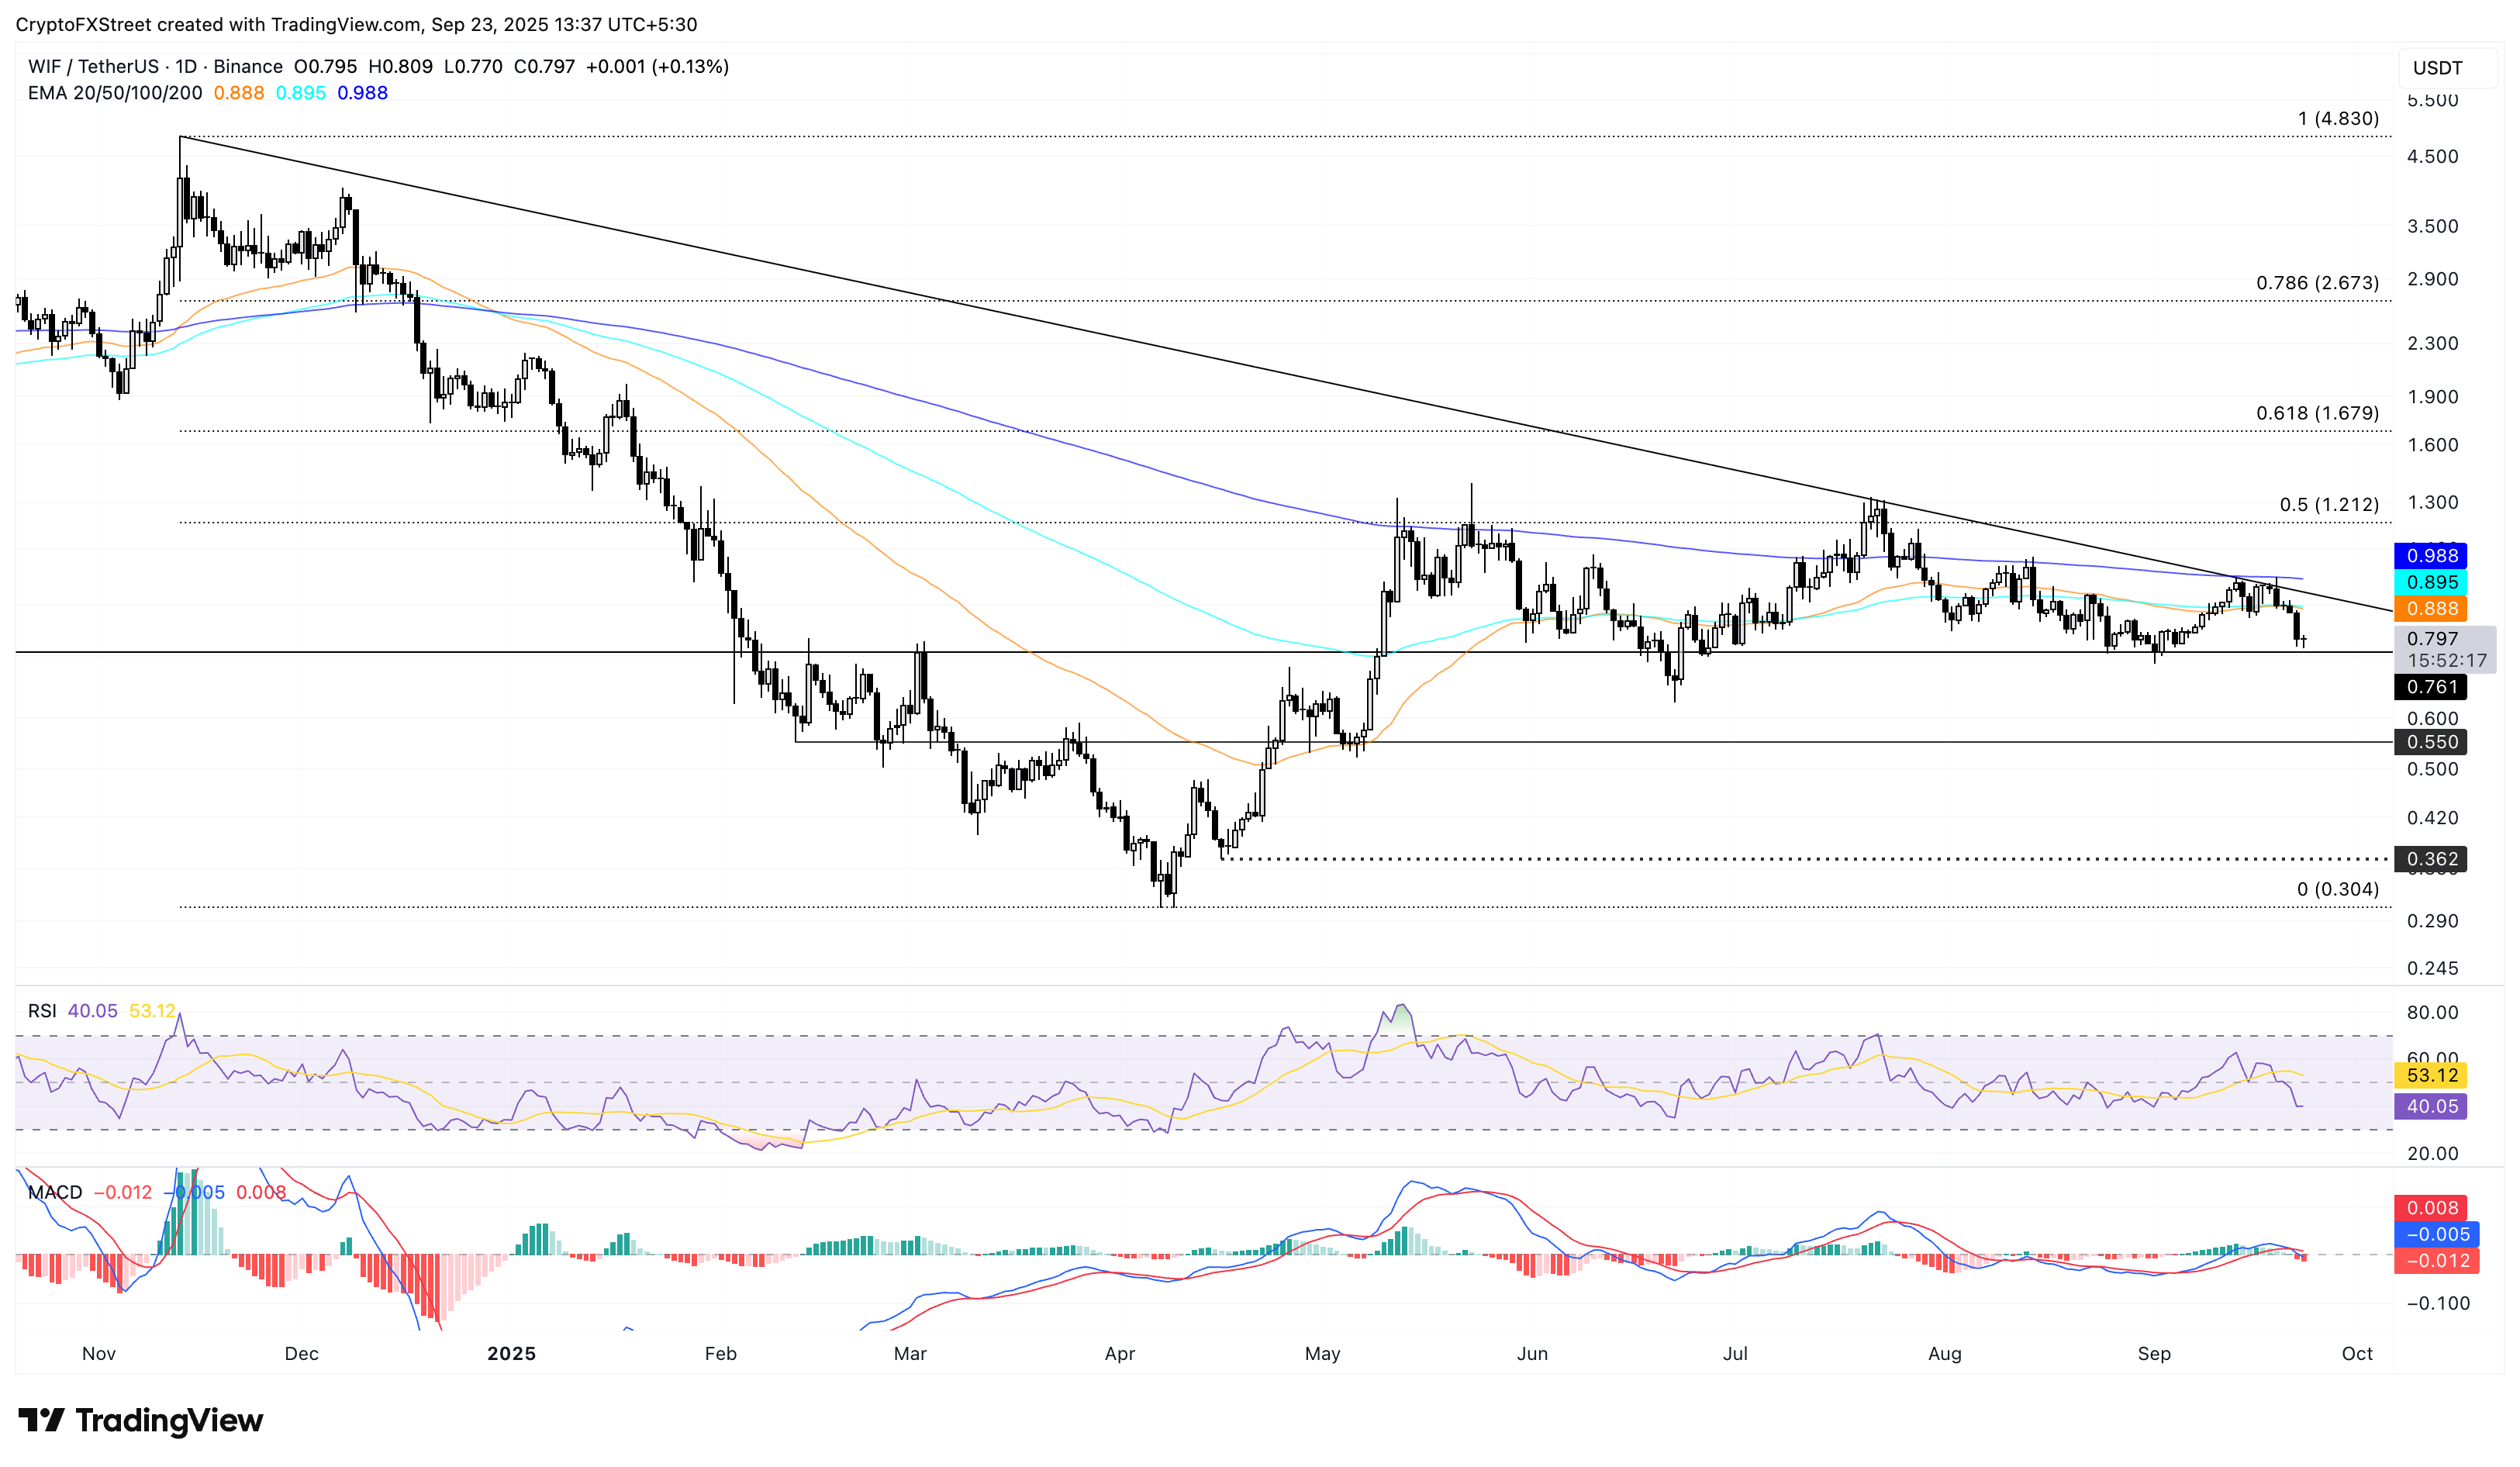
WIF/USDT daily price chart.
Looking up, a bounce back in WIF should close above the 100-day EMA at $0.895 to confirm the overhead trendline breakout. This could result in an uptrend to the 50% Fibonacci retracement level at $1.212, which is drawn from the $4.83 high of November 13 to the $0.304 low of April 9.
TOSHI risks further loss within an ascending triangle pattern
TOSHI remains steady above the 50% Fibonacci retracement at $0.0006836, which is drawn from the $0.0023138 peak of January 26 to the $0.0002019 low of April 7, at press time on Tuesday. The meme coin extends the downward movement in an ascending triangle pattern, formed by the resistance at the 61.8% Fibonacci retracement level at $0.0009115 and a support trendline connecting the lows of April 17 and September 2.
If TOSHI drops below $0.0006836, it could result in a further decline to the 200-day EMA at $0.0005613, which moves closely with the support trendline.
Similar to other meme coins, the technical indicators on the daily chart suggest a decline in bullish momentum as the RSI drops from the overbought region to 54. Moreover, the MACD reverses closer to its signal line, indicating a decline in buying pressure. If the average lines cross, it would signal a potential selling opportunity.
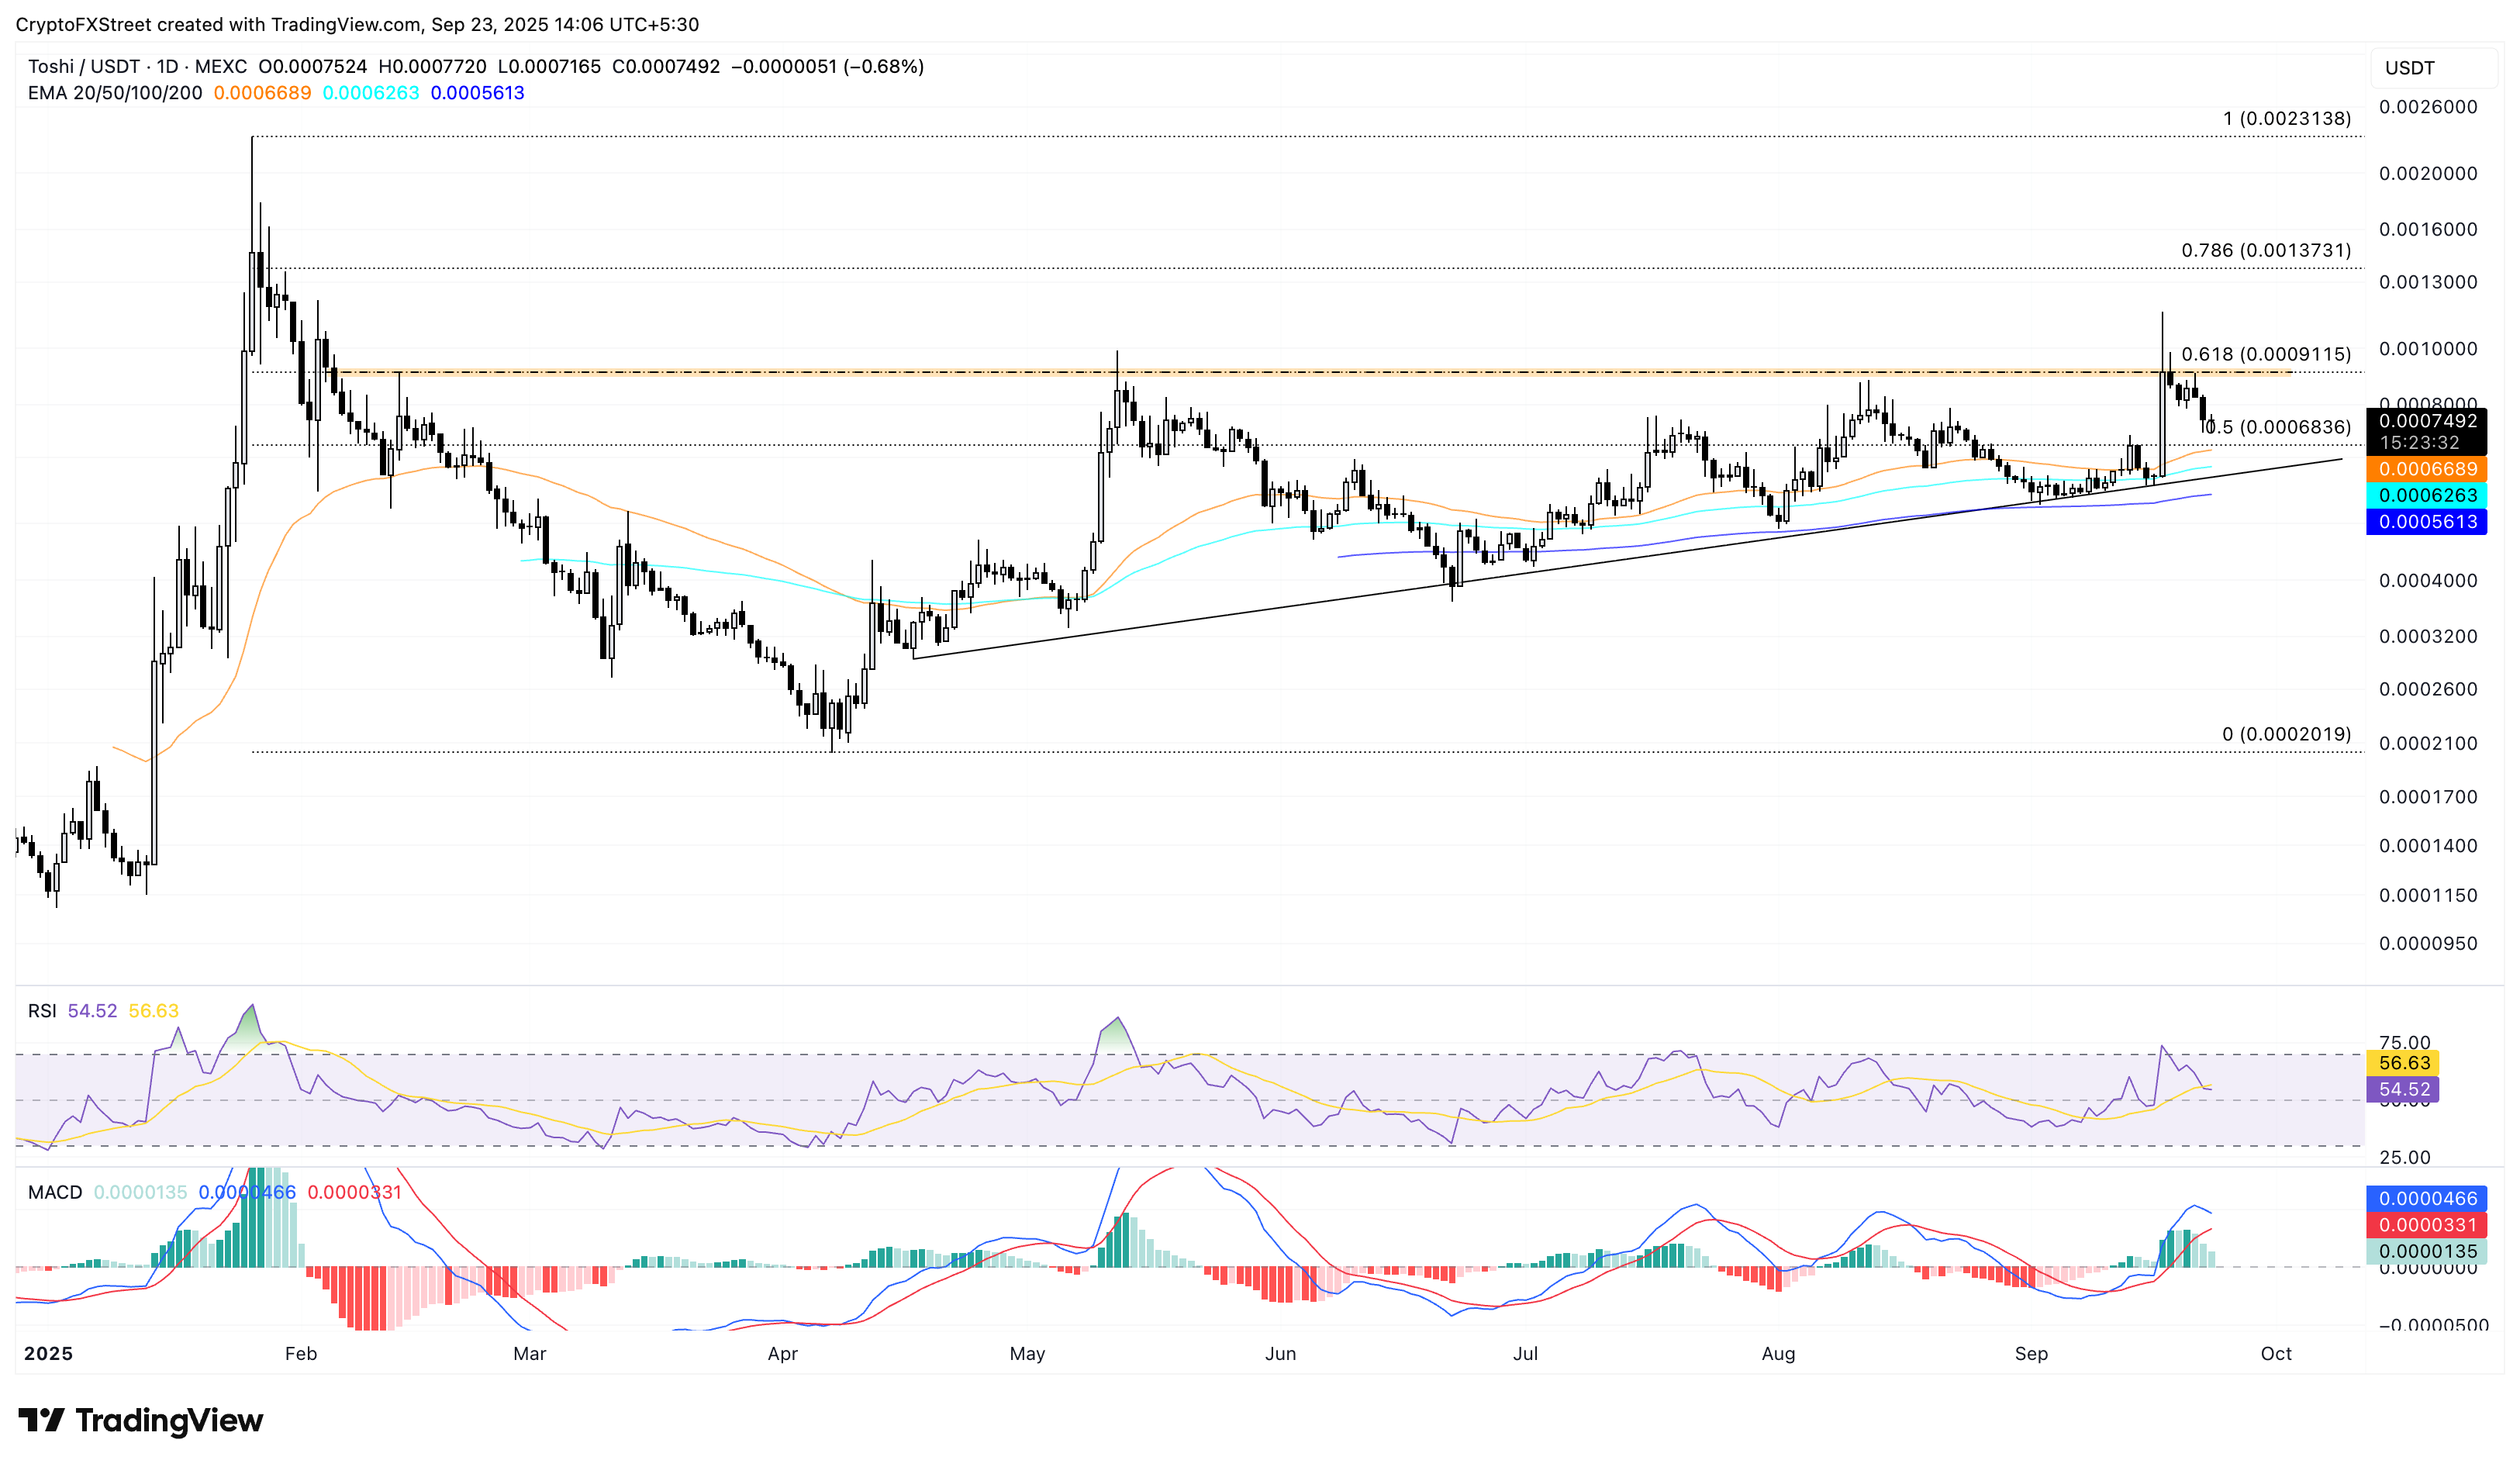
TOSHI/USDT daily price chart.
On the flip side, TOSHI should mark a decisive close above $0.0009115, which could result in an uptrend to $0.0013731, aligning with the 78.6% Fibonacci retracement level.
Author

Vishal Dixit
FXStreet
Vishal Dixit holds a B.Sc. in Chemistry from Wilson College but found his true calling in the world of crypto.


