MATIC price shows signs of optimism but Polygon bulls may struggle at $2.20
- MATIC price continues to rise but the bulls may struggle to lift prices higher above $2.20.
- Polygon could retrace slightly as a technical indicator suggests the token as formed a local top.
- However, if MATIC slices above the aforementioned hurdle, the token could target $2.42 next.

MATIC price has recently surged 19% following Sequoia’s $450 million investment round in Polygon. The token has sliced above the upper boundary of the governing technical pattern on February 5, putting a 35% climb on the radar toward $2.20.
MATIC price faces stiff resistance
MATIC price has broken above the upper boundary of the symmetrical triangle pattern on the 4-hour chart, projecting a 35% ascent toward $2.20. The Ethereum scaling solution token has nearly reached the optimistic target but is struggling to maintain the bullish momentum.
MATIC price may encounter its first obstacle at the resistance line given by the Momentum Reversal Indicator (MRI) at $2.15 before Polygon attempts to tag the optimistic target at $2.20.
The Arms Index (TRIN), which gauges overall market sentiment continues to suggest that there are more buyers than sellers in the market.
Bigger aspirations may target the 127.2% Fibonacci extension level at $2.42, coinciding with the January 12 high. Additional buying pressure could push MATIC price higher to tag the 161.8% Fibonacci extension level at $2.72.
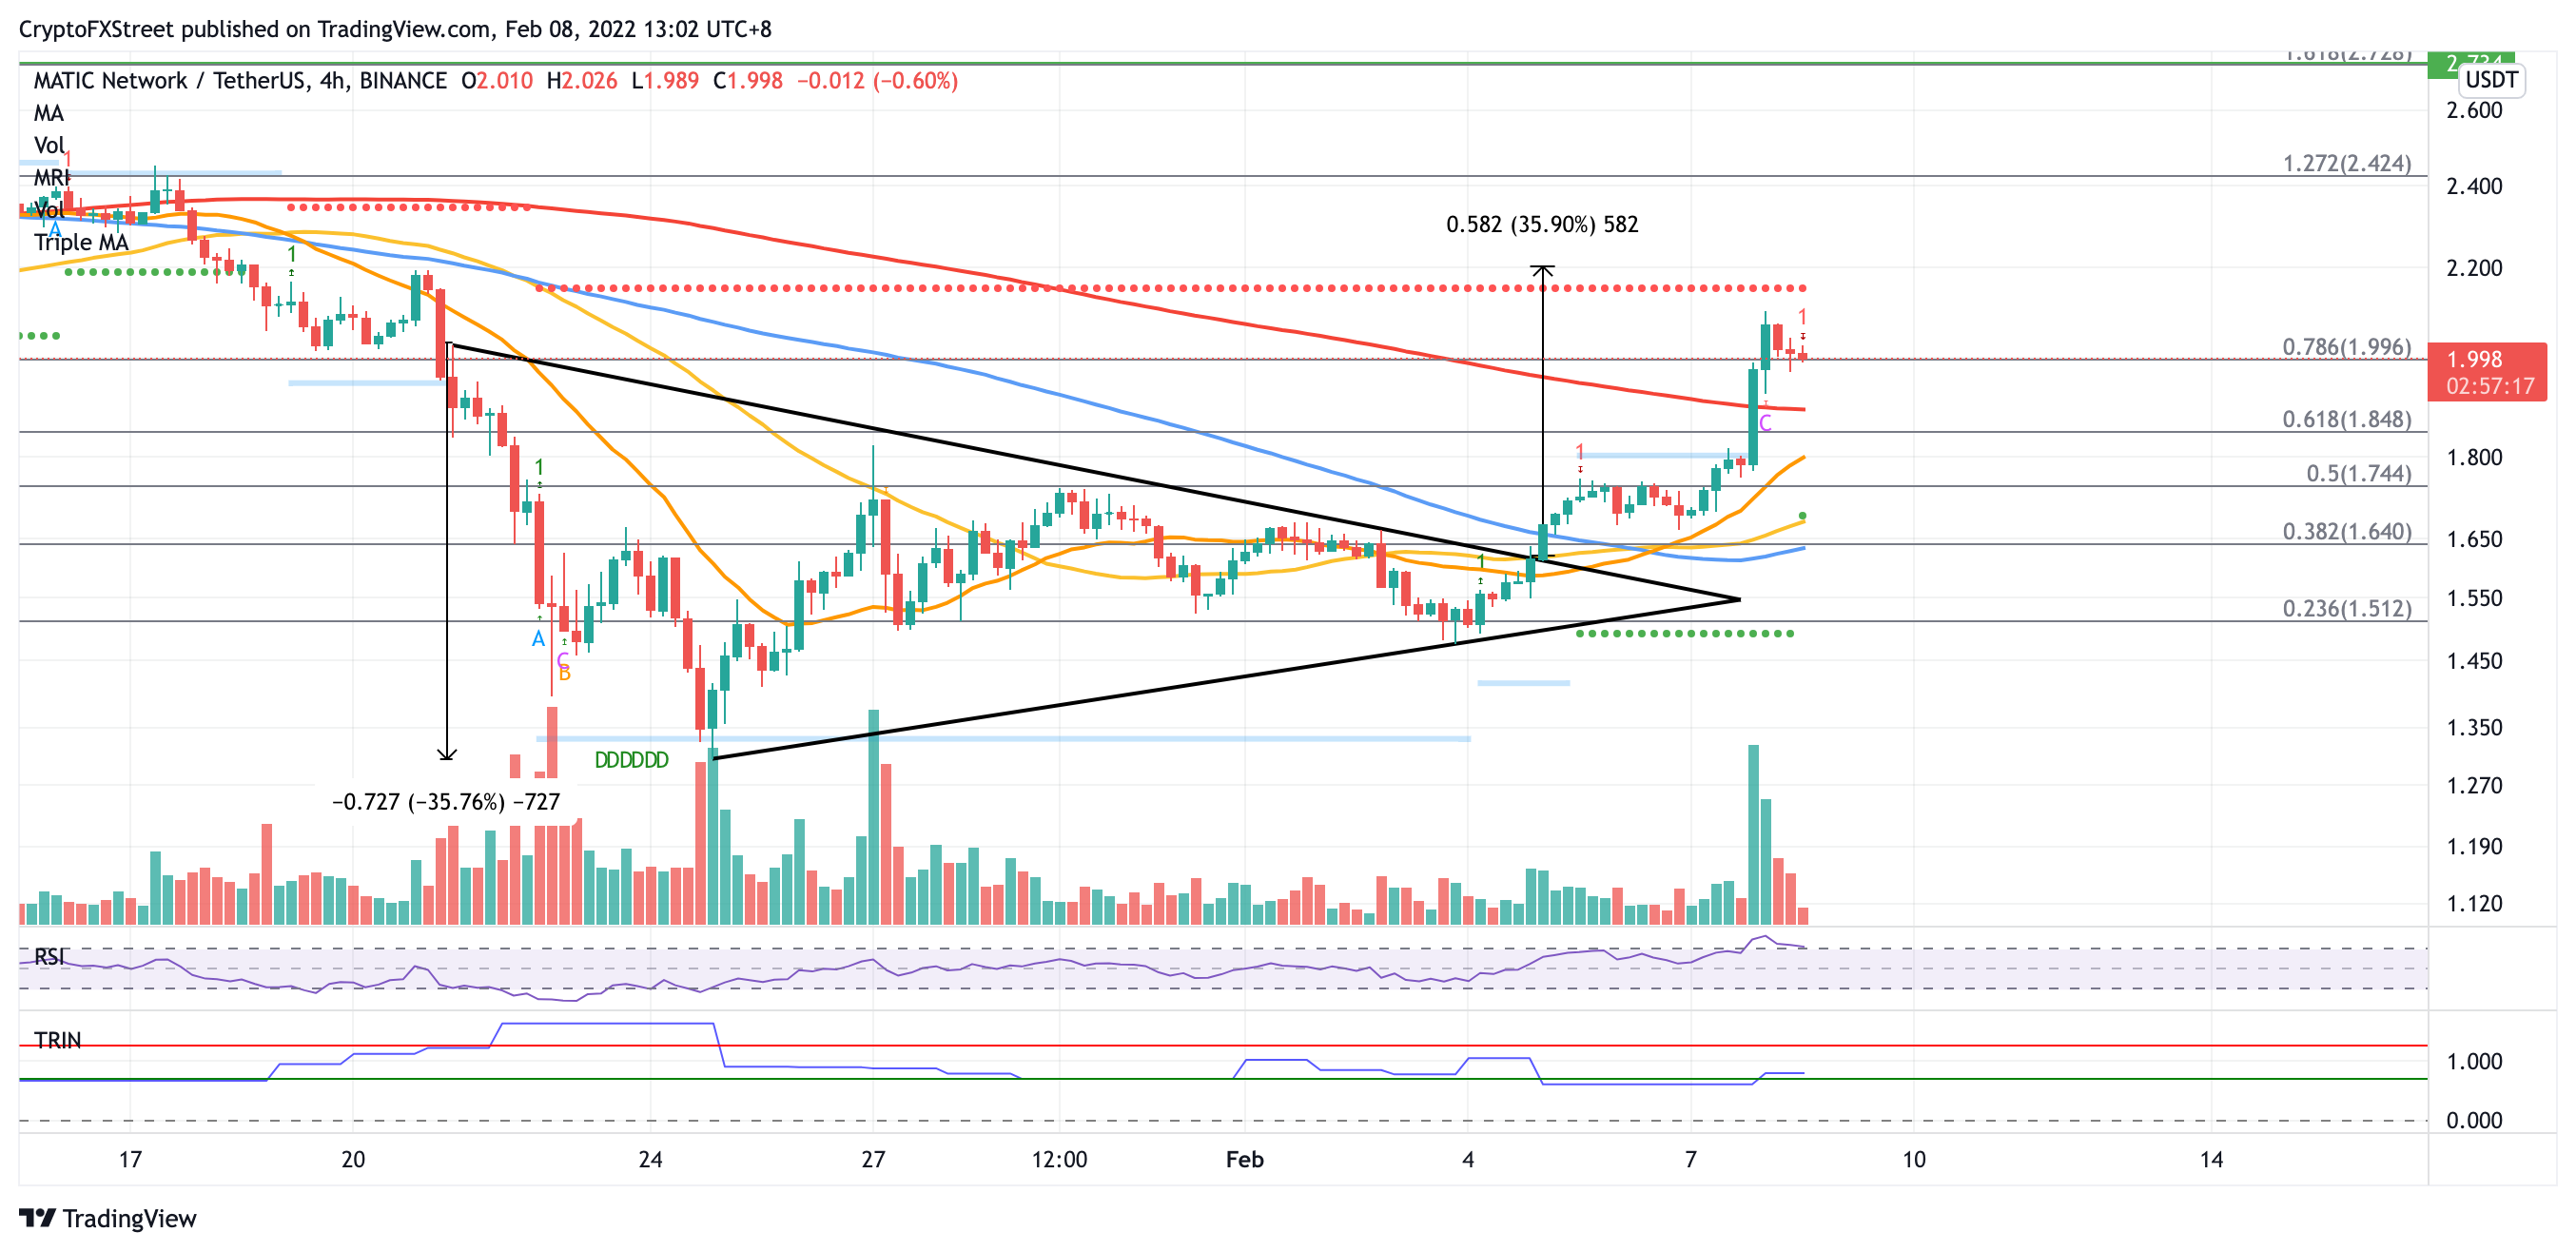
MATIC/USDT 4-hour chart
However, if selling pressure increases, MATIC price could fall toward the 78.6% Fibonacci retracement level at $1.99. Additional lines of defense would emerge at the 200 four-hour Simple Moving Average (SMA) at $1.88, then at the 21 four-hour SMA at $1.80.
The MRI has flashed a top signal, suggesting that MATIC price could retrace further before continuing its uptrend. If bearish sentiment increases, Polygon could drop toward the 50 four-hour SMA at $1.68, coinciding with the support line given by the MRI.
Only a catastrophic sell-off could see MATIC price descend toward the 100 four-hour SMA at $1.64, coinciding with the 38.2% Fibonacci retracement level.
Author

Sarah Tran
Independent Analyst
Sarah has closely followed the growth of blockchain technology and its adoption since 2016.



