MATIC Price Prediction: Polygon risk is still heavily tilted to the downside
- MATIC price dismantled various support levels yesterday, resulting in the second-largest daily decline since the beginning of 2021.
- Daily Relative Strength Index (RSI) still hovers well-above oversold territory, hinting at more weakness moving forward.
- Polygon may finally close below the 10-week simple moving average (SMA) for the first time since early November 2020.

MATIC price breakout from a symmetrical triangle on June 15 suggested a continuation of the relative strength versus the cryptocurrency market. However, the bullish price action quickly faded, rewarding Polygon investors with a 43% decline over the last seven trading days. Moreover, the failure of crucial support to halt the onslaught has left the digital asset in a delicate position, extremely vulnerable to further losses.
MATIC price experiences fear of heights, pushing the compelling story to the background
MATIC price jumped almost 60% from the June 12 low to the June 15 high, conclusively breaking with the indecisive tendencies of the other altcoins. The volume even increased during the brief streak higher. Still, it fell short of the volume totals that accompanied the rebound off the May 23 low, suggesting a reluctance to engage the market with significant capital commitments.
MATIC price has declined over 40% since the June 15 close, highlighted by yesterday’s 21.41% plunge. The nose-dive shattered the support range defined by the symmetrical triangle lower trend line, the 50-day SMA at $1.42 and the anchored volume-weighted average price (anchored VWAP) at $1.32.
Today’s response has been a mild recovery off the earlier lows, presenting the possibility of a doji candlestick pattern. For some, the pattern represents a stalemate between Polygon buyers and sellers, but it can also signify the beginning of a consolidation or even a reversal.
If MATIC price is engineering a reversal, it is tough to be compelled to accumulate long positions until the 50-day SMA at $1.45 is recovered. Standing in front of the bullish feat is the anchored VWAP, symmetrical triangle apex and the 2021 rising trend line. Thus, a bullish outlook cannot return until there is a measurable price thrust higher.
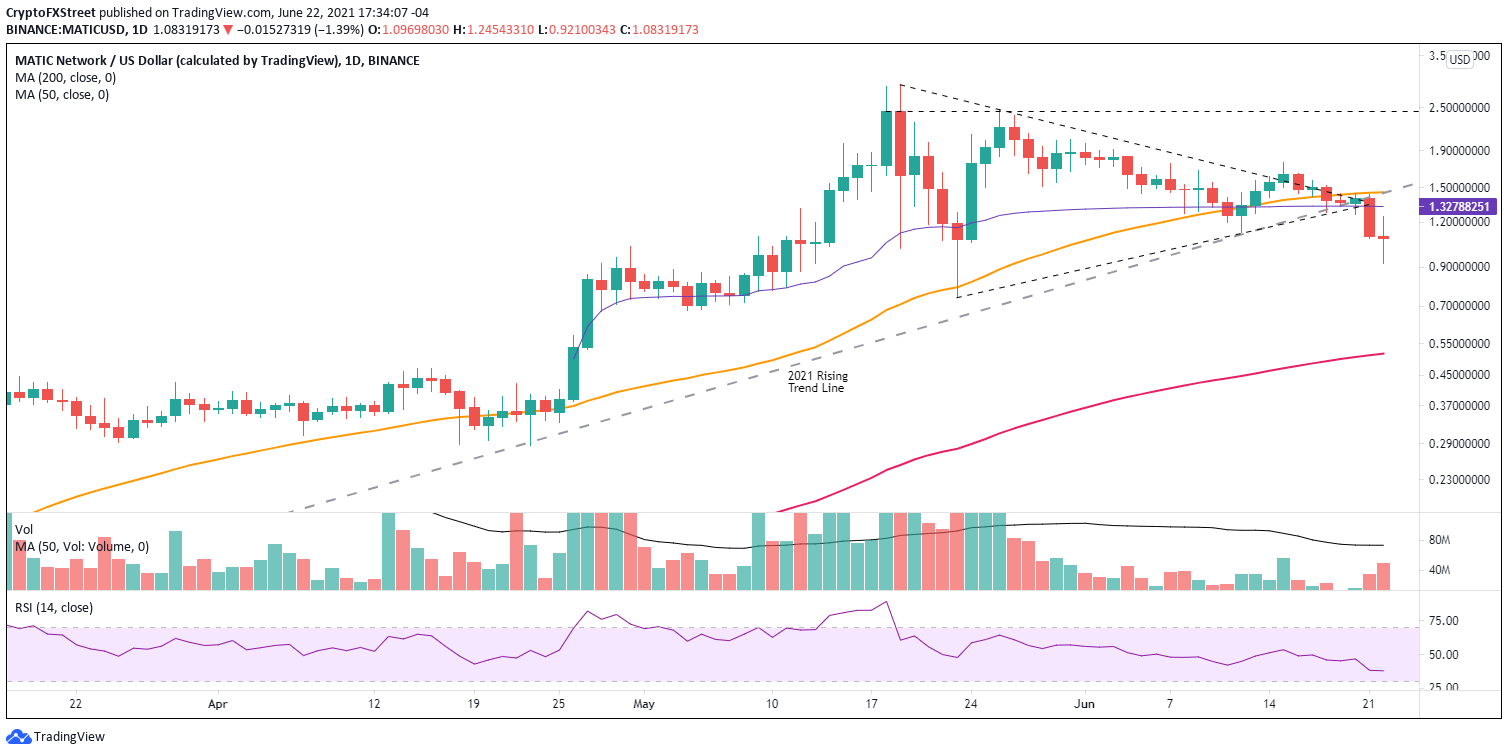
MATIC/USD daily chart
As long as MATIC price remains below the June 12 low of $1.12, Polygon investors need to consider a scenario that includes a test of the May 23 low of $0.74.
A piece of potentially good news for the bulls is the latest Santiment Market Value to Realized Value ratio. It infers that MATIC is more undervalued than at any point during the current correction that began in May. In fact, the metric is at the lowest reading since April 2020.
For clarity, when the reading is too high, like in mid-May, MATIC may be overvalued, possibly implying selling pressure. On the other hand, when the value is too low, such as now, MATIC may be undervalued, perhaps indicating buying pressure will arrive.
One caveat to the undervalued proposition is the 30-day moving average of the MATIC MVRV. Before previous rallies, the moving average neared or even touched fair value before MATIC price shifted higher. Thus, there appears more room for the metric to decline or move sideways in the days ahead. Something to consider as MATIC currently trades below influential support.
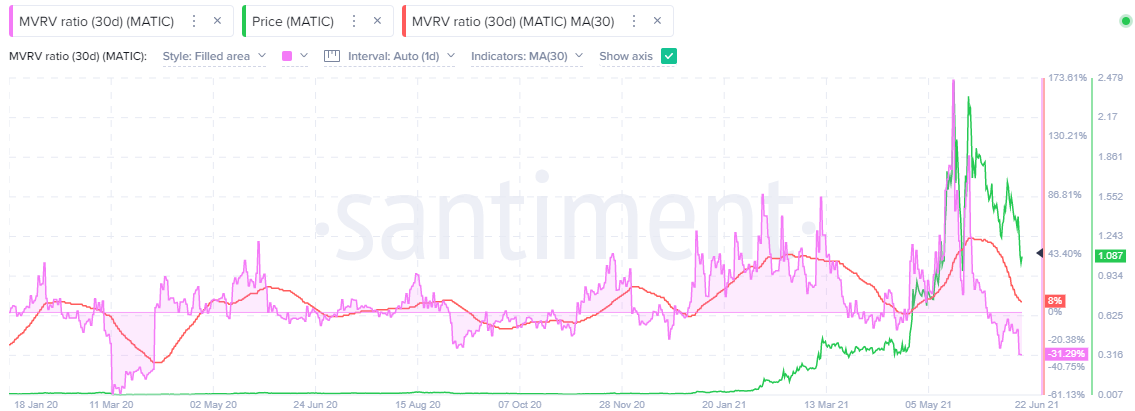
MATIC MVRV Ratio - Santiment
Polygon relative strength could no longer avoid the downward building pressures in the cryptocurrency complex and dropped 40% over the last seven days, breaking the governing uptrend that has been visibly present through the first half of 2021. Today’s doji may mark the end, but MATIC price faces numerous technical obstacles before it can reclaim the position of relative strength leader in the market.
Conversely, the elevated level of the daily RSI does advise further weakness in the short term before an oversold reading can be captured.
Author

Sheldon McIntyre, CMT
Independent Analyst
Sheldon has 24 years of investment experience holding various positions in companies based in the United States and Chile. His core competencies include BRIC and G-10 equity markets, swing and position trading and technical analysis.




