MATIC Price Prediction: A 44% rally is on the cards but needs a push from the whales
- MATIC price is observing a bullish reversal pattern that hints at a potential 44% increase if successful.
- The whale transaction volume has taken a hit, falling to monthly lows following a failed breakout.
- The macro bullish outlook would be invalidated if MATIC slips below the stop loss of $0.70.

MATIC price is one of the few cryptocurrencies with the potential to rally over the next couple of weeks as the altcoin is noting a macro bullish reversal pattern on the weekly chart. If successful, this would shoot up the Polygon token to an 11-month high.
MATIC price breakout needs backup
MATIC price, trading at $0.81 at the time of writing, is observing a rounding bottom pattern, which is a bullish reversal pattern. This pattern is observed when price declines meet with heavy volumes, followed by a slump during which the asset marks a low in terms of price as well as trading volume.
This then leads to recovery, and during this period, high trading volumes make a comeback. If, after this, the asset can break out above the price prior to the start of the initial decline, a potential rally equal to the height of the rounding bottom can be expected.
In the case of the Polygon token, this descent first began towards the end of May 2023, with MATIC price hitting a low of $0.50 mid-September. Since then, the altcoin has been in recovery, nearly testing the $0.92 breakout level as a support line the week before last.
However, as the crypto market corrected, MATIC fell, failing the breakout to trade at current price levels. Per the pattern, the target price for the Polygon token is set at $1.32, which marks a 44% rally above the breakout level. This achievement is likely given that the Relative Strength Index (RSI) is above the neutral line of the 50.0 mark, suggesting bullishness in the market. Thus, if the $0.92 is breached successfully, a rally is likely.
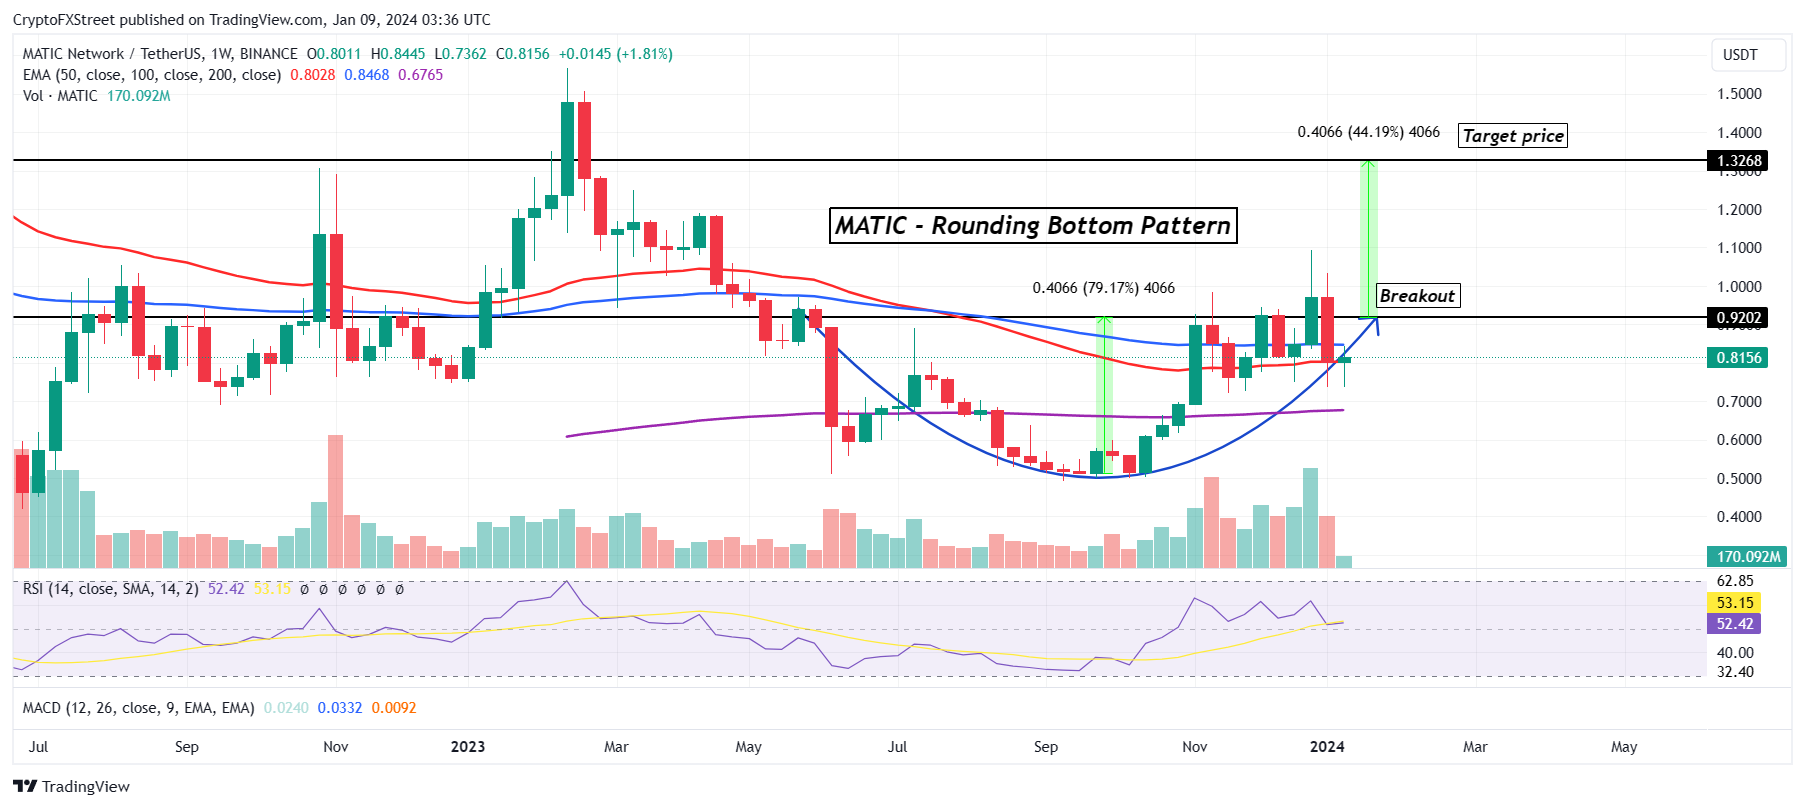
MATIC/USD 1-week chart
However, given MATIC price is trading very close to the stop loss of $0.70, a fall below this level would invalidate the bullish thesis and result in a decline towards the 200-day Exponential Moving Average (EMA) coinciding at $0.68.
Furthermore, the whale volume is also at a low at the moment, and given these addresses play an important role in the price action, their activity could reignite a bullish reversal. Their activity first declined in the last week of December and is presently at a monthly low.
 [09.10.48, 09 Jan, 2024]-638403732729692382.png)
Polygon whale transaction volume
Thus, it is important to watch their movement to determine whether the altcoin has any steam in it to rally again.
Author

Aaryamann Shrivastava
FXStreet
Aaryamann Shrivastava is a Cryptocurrency journalist and market analyst with over 1,000 articles under his name. Graduated with an Honours in Journalism, he has been part of the crypto industry for more than a year now.




