Mantra Price Analysis: OM social media mentions surge 500%, outperforming Bitcoin as traders bet on RWA assets
- Mantra price stabilizes at around $6 on Tuesday, defying crypto market volatility to book 70% gains over the last 17 days.
- Santiment’s data shows Mantra’s share of social media comments has increased by 500% since January 5, signaling the growing popularity of RWA projects.
- Market reports suggest that positive speculation on recent market volatility has driven demand for on-chain shelter assets like tokenized bonds and treasuries.

Mantra (OM) has demonstrated remarkable resilience, stabilizing around the $6 level after a 70% rally over the last 17 days. Despite outperforming the likes of Bitcoin and Ethereu, on-chain eindicators suggest the bullish momentum may remains intact in the coming trading sessions.
Mantra price books 70% gains in 17 days despite market volatility
Mantra (OM) has emerged as one of the standout performers in the crypto market over the past month.
Despite multiple bearish macroeconomic events — including the escalating US-China trade war — market data indicates that OM has defied the broader downtrend, securing a 70% price surge over the last 17 days.
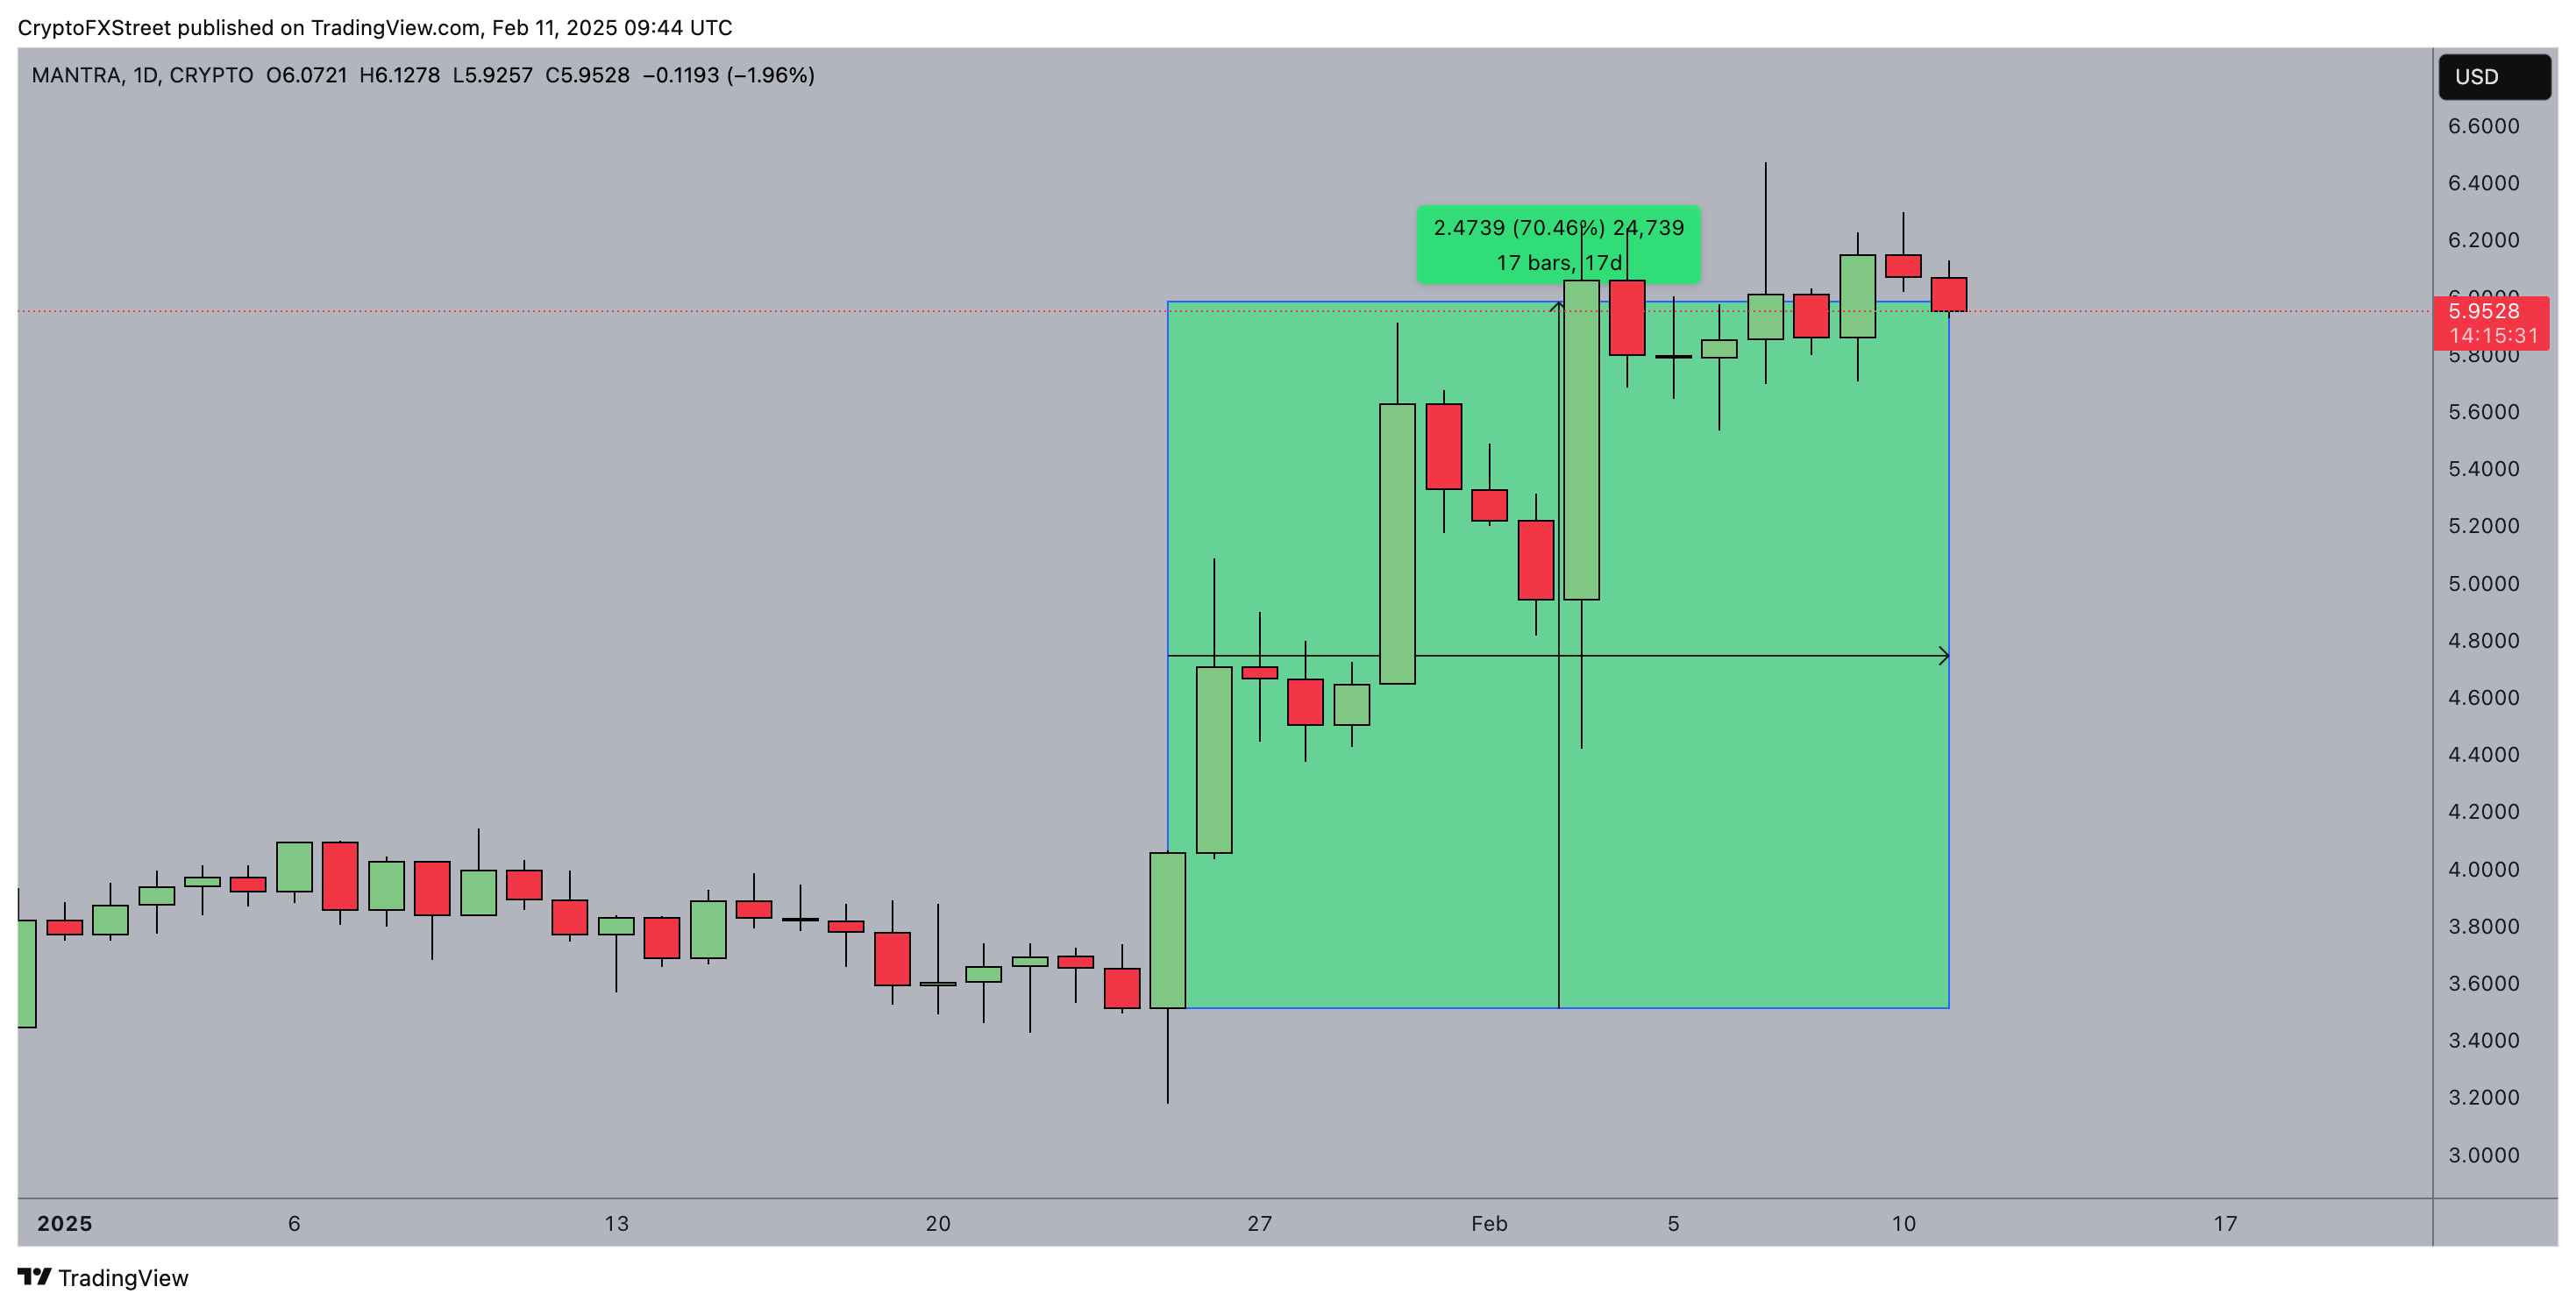
Mantra (OM) price action
Mantra’s price has seen a remarkable rise, climbing from $3.20 on January 25 to $6 by Tuesday.
Several factors appear to be fueling this price momentum, with analysts pointing to a growing investor appetite for tokenized real-world assets (RWAs), which are increasingly seen as a hedge against market uncertainty.
However, in an exclusive interview with FXStreet, MANTRA CEO John Patrick Mullin suggested that Trump’s proposed crypto tax-free policy could also play a major role in the sector’s growth.
Question: If capital gains taxes are eliminated for US crypto projects, do you see tokenized real-world assets (RWAs) becoming a superior alternative to their traditional counterparts?
J.P. Mullin: Eliminating capital gains taxes for U.S. crypto projects would give tokenized RWAs a major edge over traditional instruments. The tax advantage alone could lead to a reallocation of capital, where investors prioritize tokenized Treasuries, real estate, and commodities over conventional versions, not necessarily for superior yield or liquidity, but purely for tax efficiency. This would create a structural shift, forcing traditional asset managers and banks to adapt swiftly.
Q: Would such a tax incentive essentially act as a subsidy for on-chain finance, forcing traditional asset managers and banks to accelerate their tokenization efforts?
J.P. Mullin: Yes, it would act as a de facto subsidy, making blockchain-based finance more attractive than its traditional counterpart. Financial institutions would have no choice but to accelerate tokenization efforts to remain competitive. At that point, tokenized RWAs wouldn’t just be an innovation—they’d be a necessity. If banks don’t adapt, they risk losing market share to decentralized platforms offering more efficient and tax-advantaged investment structures.
Q: Could this make tokenized RWAs not just an innovation but a necessity for financial institutions to stay competitive?
J.P. Mullin: Absolutely. If tokenized RWAs provide a tax advantage, financial institutions that fail to integrate blockchain-based assets could struggle. The shift wouldn’t just be about efficiency—it streamlines settlement, reduces fees, and improves liquidity. When combined with tax incentives, it would push asset managers and banks toward rapid adoption to stay in the game.
Mantra social media mentions surge 500% to hit a 60-day peak
Mantra’s recent price rally is not just backed by favorable market trends — it’s also gaining significant media traction.
On-chain data further supports this narrative, showing an explosion in social media buzz surrounding OM, hitting its highest level in over 60 days since November 17, 2024.
Supporting this outlook, Santiment’s Social Dominance chart highlights OM’s growing influence within the crypto community.
The chart below illustrates how OM’s share of mentions among the top 50 trending cryptocurrencies has surged from 0.04% to 0.24% between January 5 and Tuesday.
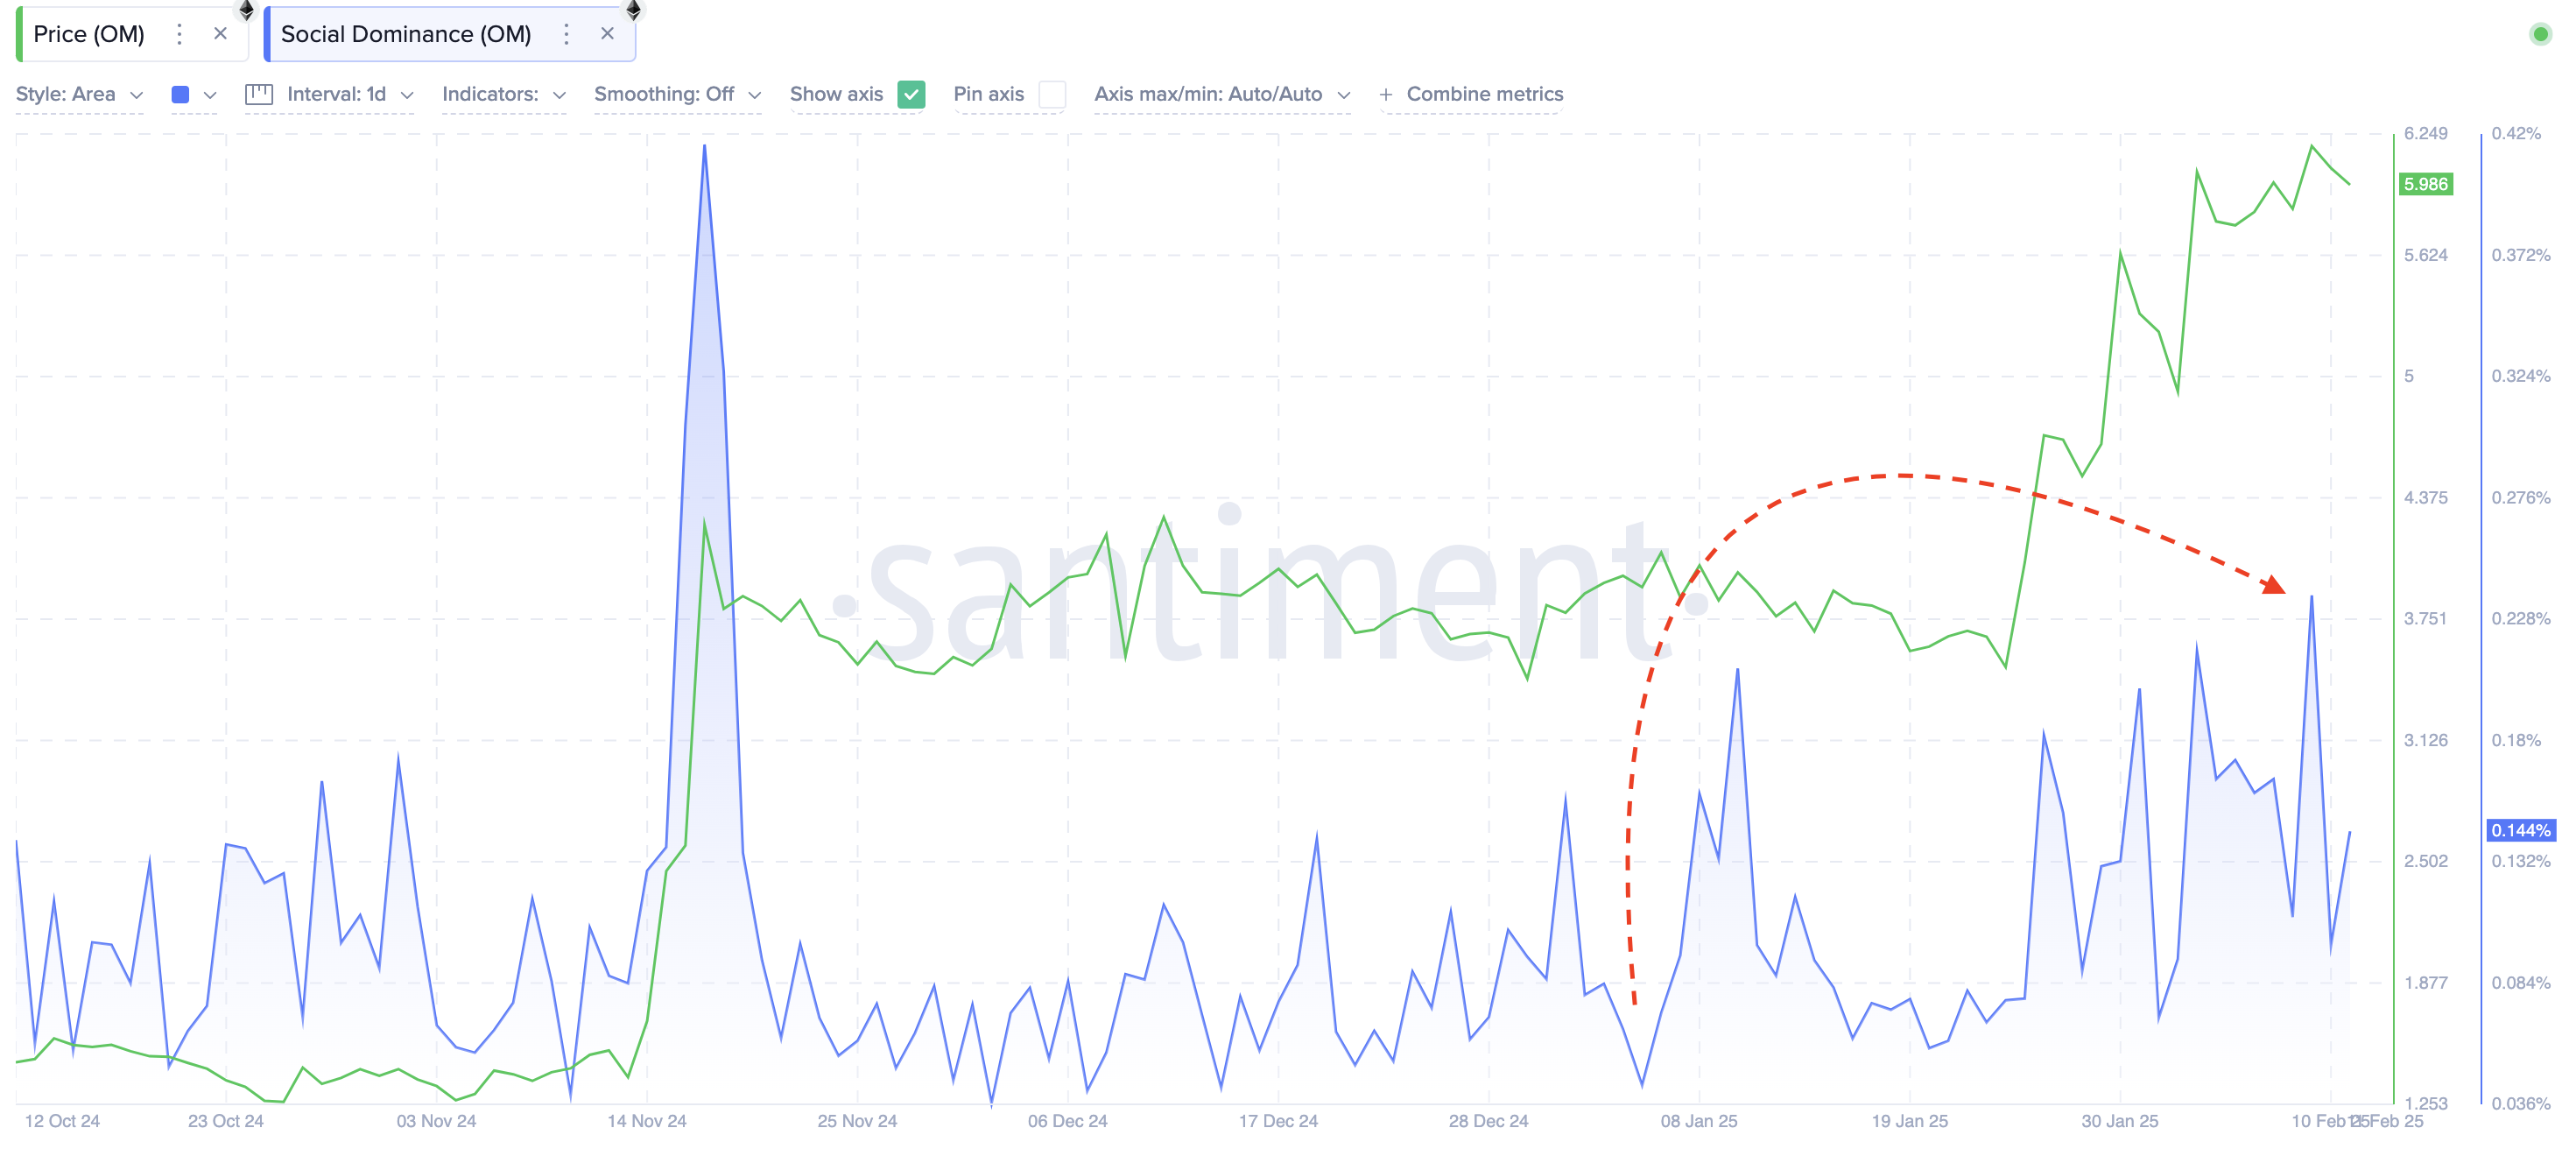
Mantra Chain (OM) price vs. Social Dominance | Source: Santiment
This rise in social dominance suggests that OM has decoupled from the broader market trend, rallying despite overall crypto weakness.
Historically, assets that show strong price action alongside growing social traction tend to maintain their momentum, suggesting that OM’s bullish trend could persist even if broader market conditions remain uncertain.
With expectations of continued speculation on RWAs and macroeconomic factors like the US Consumer Price Index (CPI) report on Wednesday and US-China trade tensions, Mantra’s position in the crypto ecosystem remains strong, with the potential for further upside in the coming weeks.
Mantra (OM) Price Forecast: Bullish momentum holds as OM eyes $7 amid rising market volatility
The Mantra (OM) price action remains resilient, consolidating around $6 on Tuesday after a staggering 70% rally over the last 17 days.
The Bollinger Bands show OM trading near the upper band, signaling strong bullish momentum, while the MACD histogram remains positive, reinforcing sustained buying momentum.
The breakout from the mid-January range, accompanied by expanding Bollinger Bands, suggests increasing volatility, typically a precursor to extended price movements.
The MACD lines are in bullish alignment, with the signal line trailing the MACD line and confirming the ongoing uptrend.
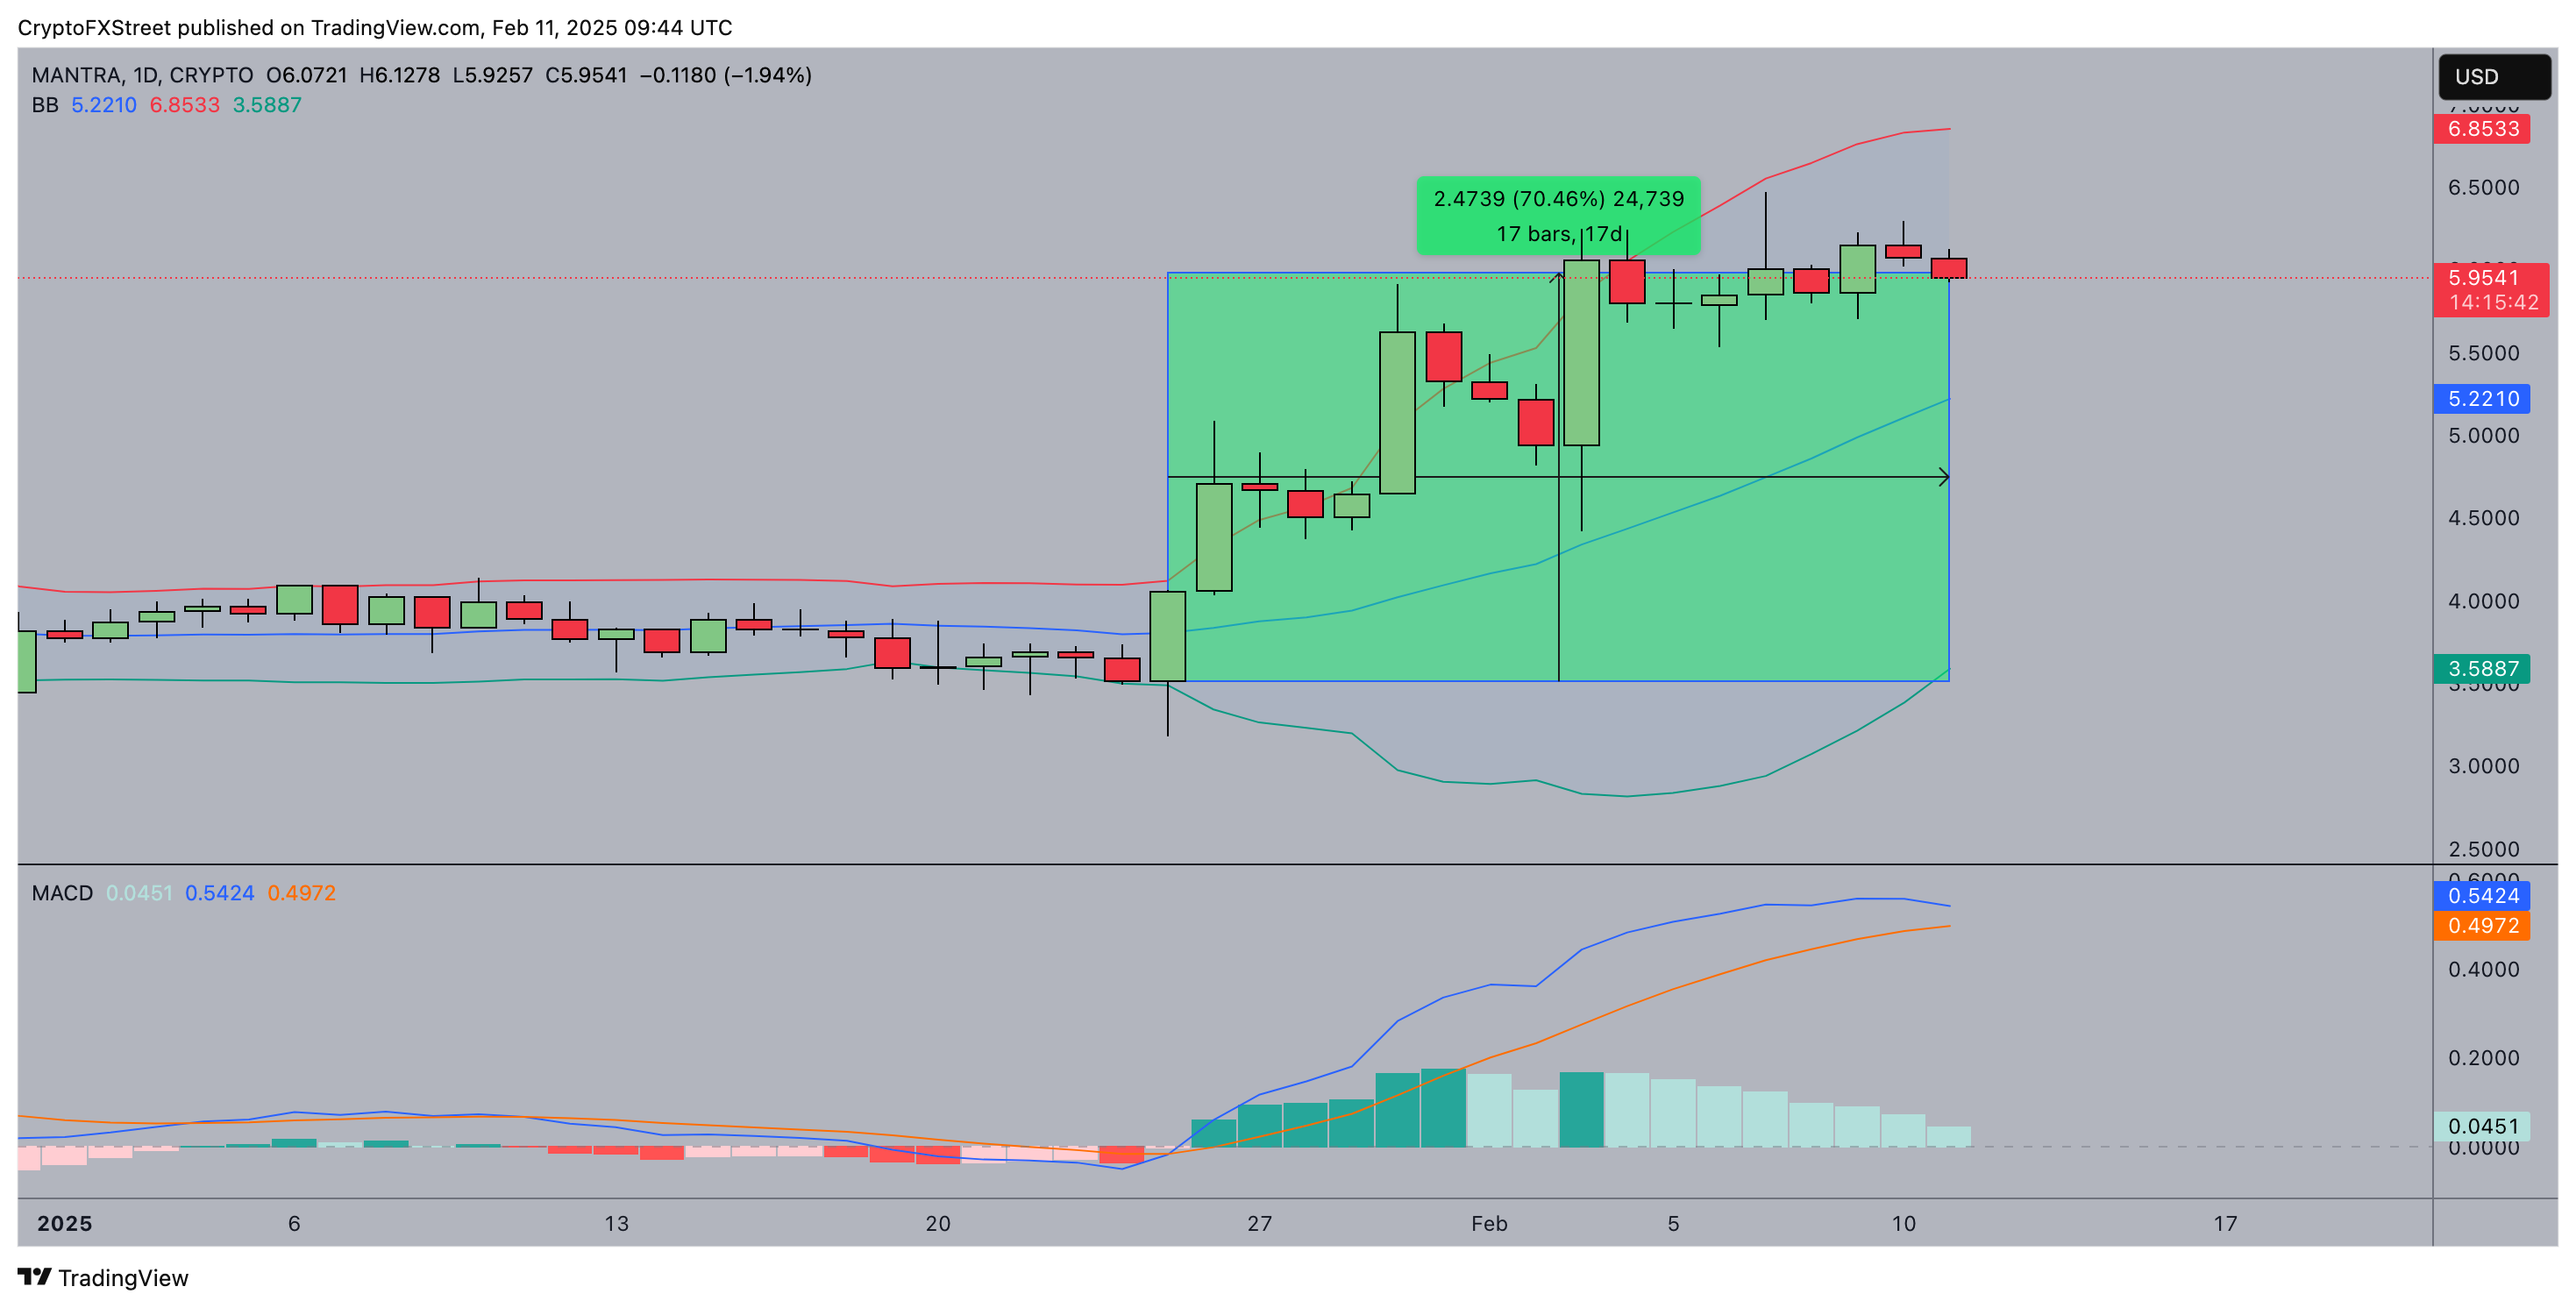
Mantra (OM) price forecast
If OM maintains its position above the $5.22 middle Bollinger Band support, bulls could push for another leg up towards the $6.85 upper Bollinger Band resistance, potentially extending the rally past $7.
However, failure to sustain this momentum could see a retracement towards $5.22, with a steeper decline to $3.58, the lower Bollinger Band, if selling pressure intensifies.
The MACD histogram shows a slight weakening in bullish momentum, indicating a possible slowdown, but the overall market structure remains favorable for buyers unless a decisive breakdown occurs.
Author

Ibrahim Ajibade
FXStreet
Ibrahim Ajibade is an accomplished Crypto markets Reporter who began his career in commercial banking. He holds a BSc, Economics, from University of Ibadan.