Mantle Price Forecast: MNT surges 16% after Bybit listing. Is a correction imminent?
- Mantle rallies toward its record high of $1.54, supported by adoption developments.
- Bybit adds 21 trading pairs for MNT, debuts HODL and earn features supported by XUSD stablecoin.
- The RSI ascent into overbought territory highlights a potentially overheated market.

Mantle (MNT) doubles down on its bullish potential, surging 8% on Wednesday and 16% in 24 hours to trade at $1.47 at the time of writing. This increase in value builds on key adoption trends in the ecosystem, including the listing of 21 trading pairs on Bybit exchange.
Mantle eyes record high as Bybit adds support for MNT
Bybit, the fifth-largest cryptocurrency exchange with an average daily trade volume of $4.5 billion, announced the listing of 21 trading pairs for MNT on Tuesday, sparking interest in the token.
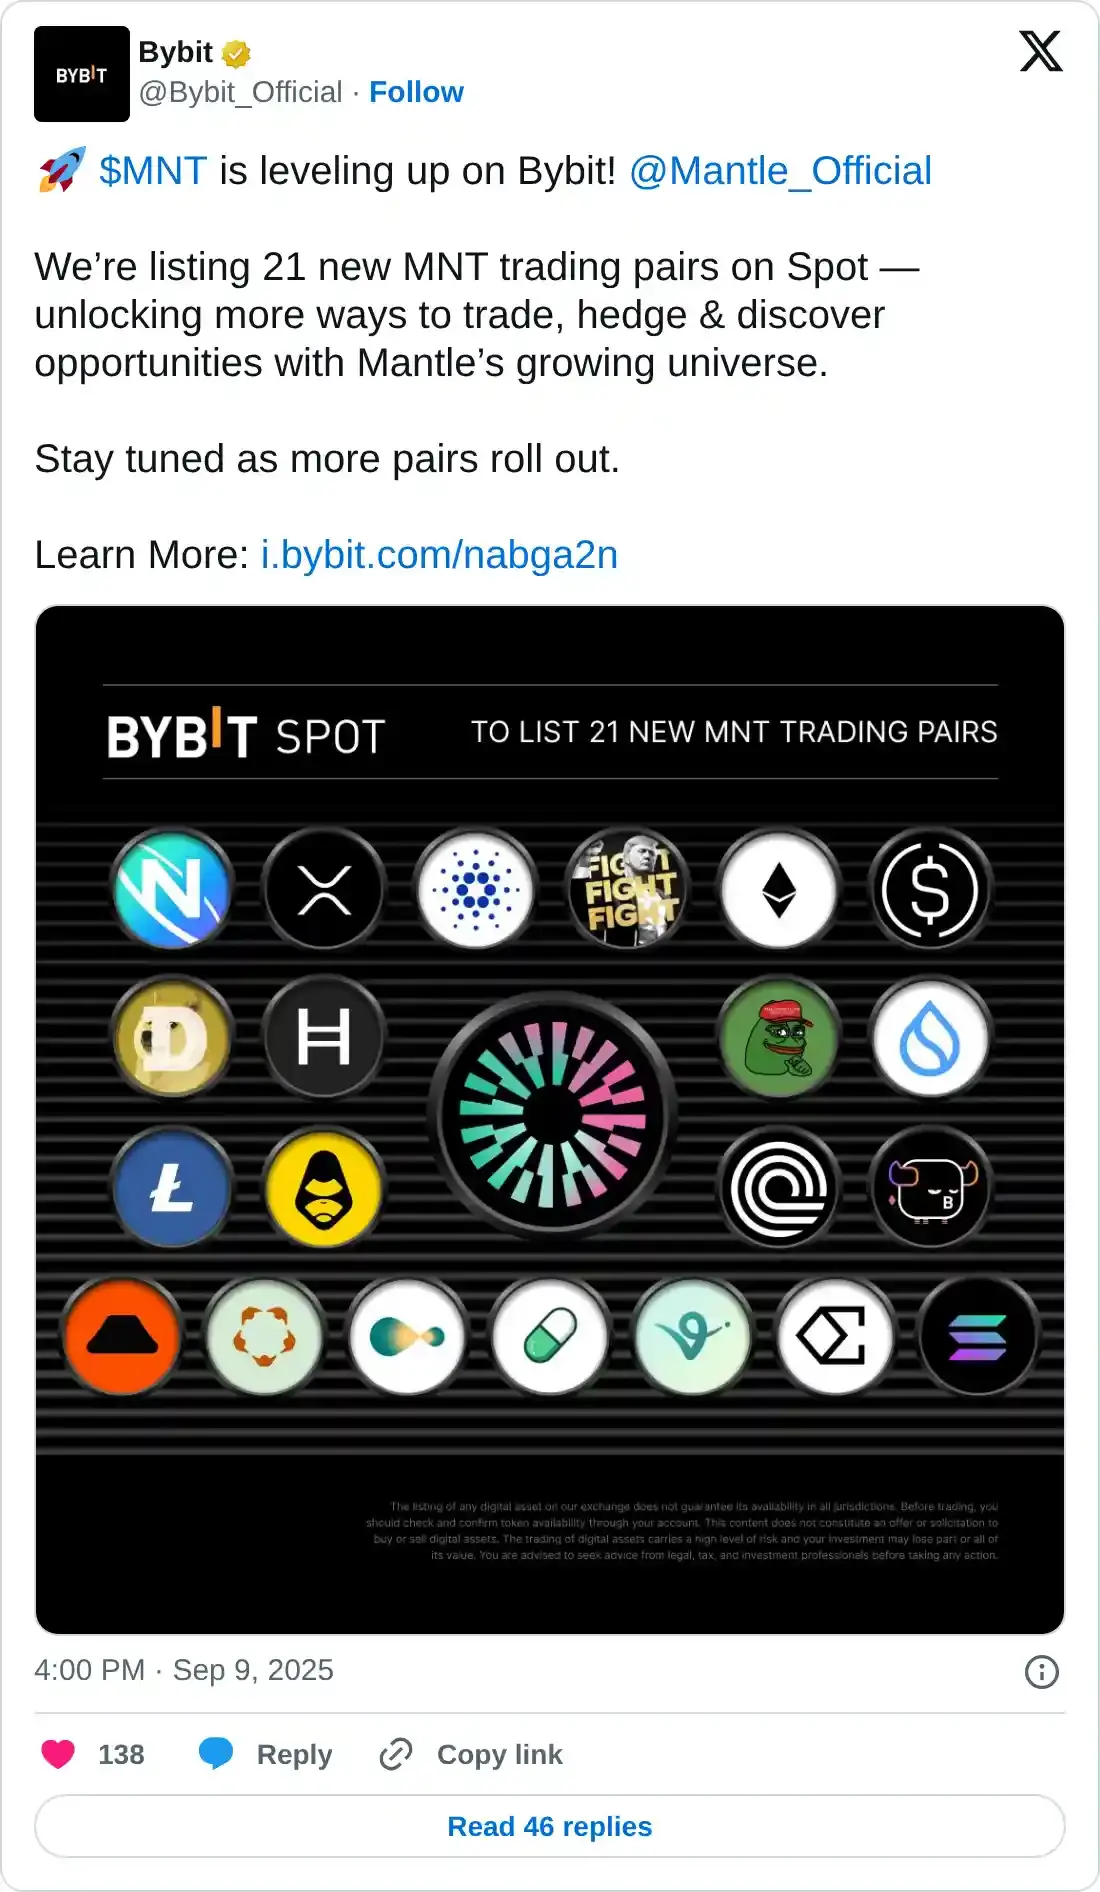
The exchange also announced the launch of the “HOLD & earn Stablecoins” program, which allows investors to hold MNT and the XUSD stablecoin, earning a share of the $60,000 prize pool in return.
Following the announcement, demand for Mantle skyrocketed, triggering a price rally. The token’s market capitalization also hit a new record high, averaging $4.7 billion at the time of writing.
Mantle is currently the 41st-largest cryptocurrency, with a 24-hour trading volume exceeding $573 million, according to CoinGecko.
Retail interest in Mantle has surged significantly over the past few days, underscoring the increase in the futures Open Interest (OI) to $153 million from approximately $99 million on September 3 and $21 million on August 4.
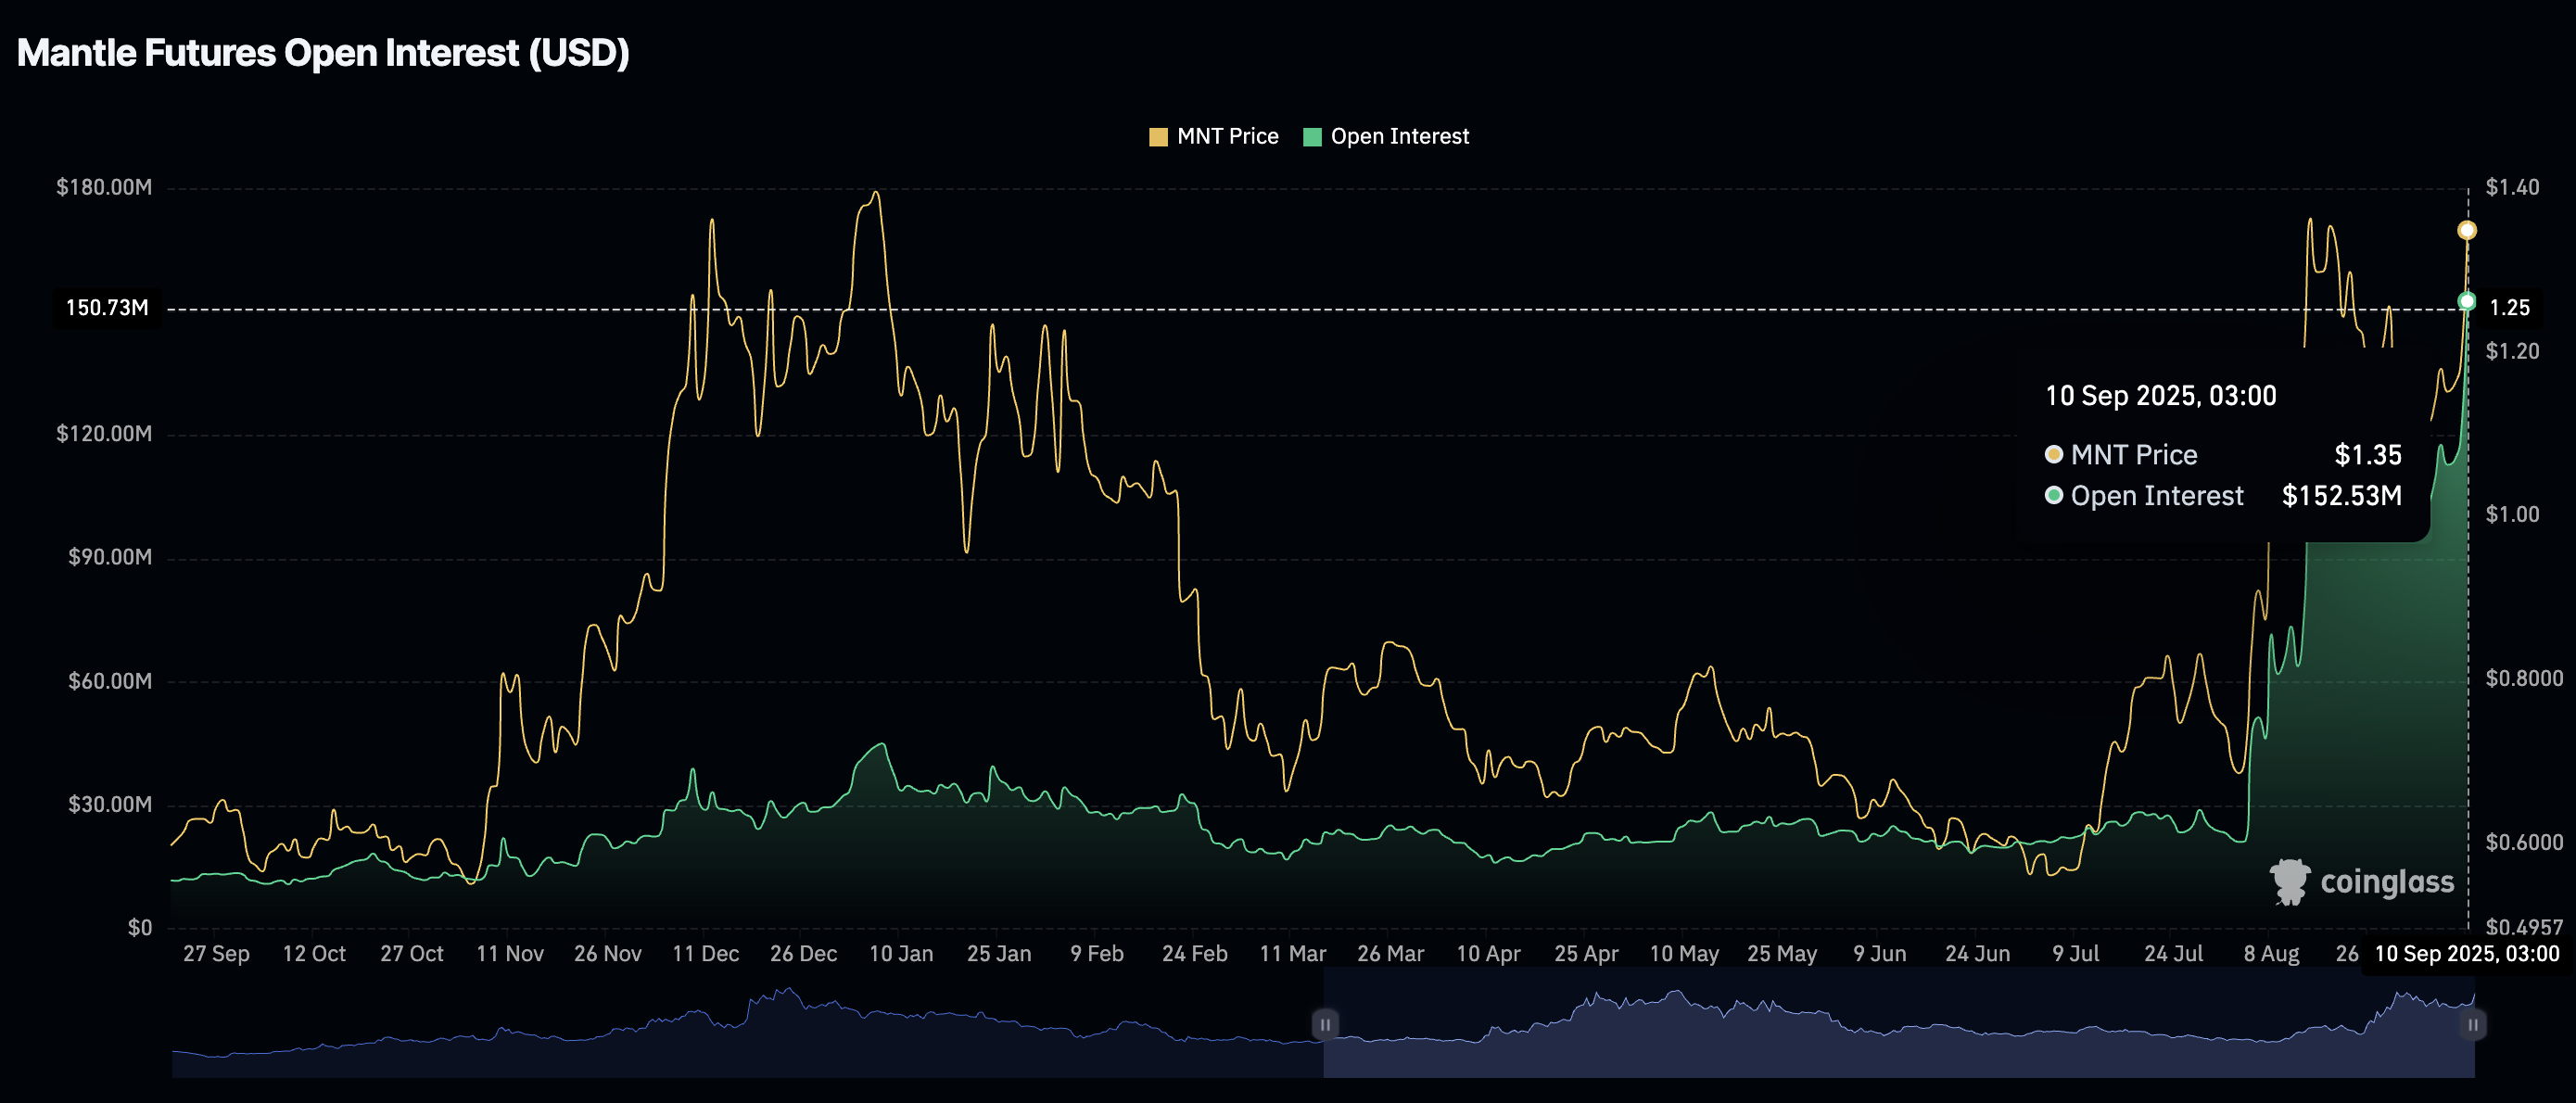
Mantle Futures Open Interest | Source: CoinGlass
As the OI increases, XRP price gains bullish momentum, underpinning investor confidence in the uptrend. Similarly, a higher OI reading as volume rises implies heightened trading activity.
Technical outlook: Mantle bulls aim at $1.54 record high
Mantle holds significantly above the 50-day Exponential Moving Average (EMA) at $1.08, the 100-day EMA at $0.95 and the 200-day EMA at $0.88, backing positive sentiment in the ecosystem.
The Moving Average Convergence Divergence (MACD) indicator on the daily chart reinforces the bullish outlook with a buy signal triggered earlier in the day. Interest in MNT is likely to remain intact as long as the blue MACD line holds above the red signal line.
Key milestones to watch out for include a break and daily close above the short-term resistance at $1.50, as well as the extension of the uptrend past the record high of $1.54.
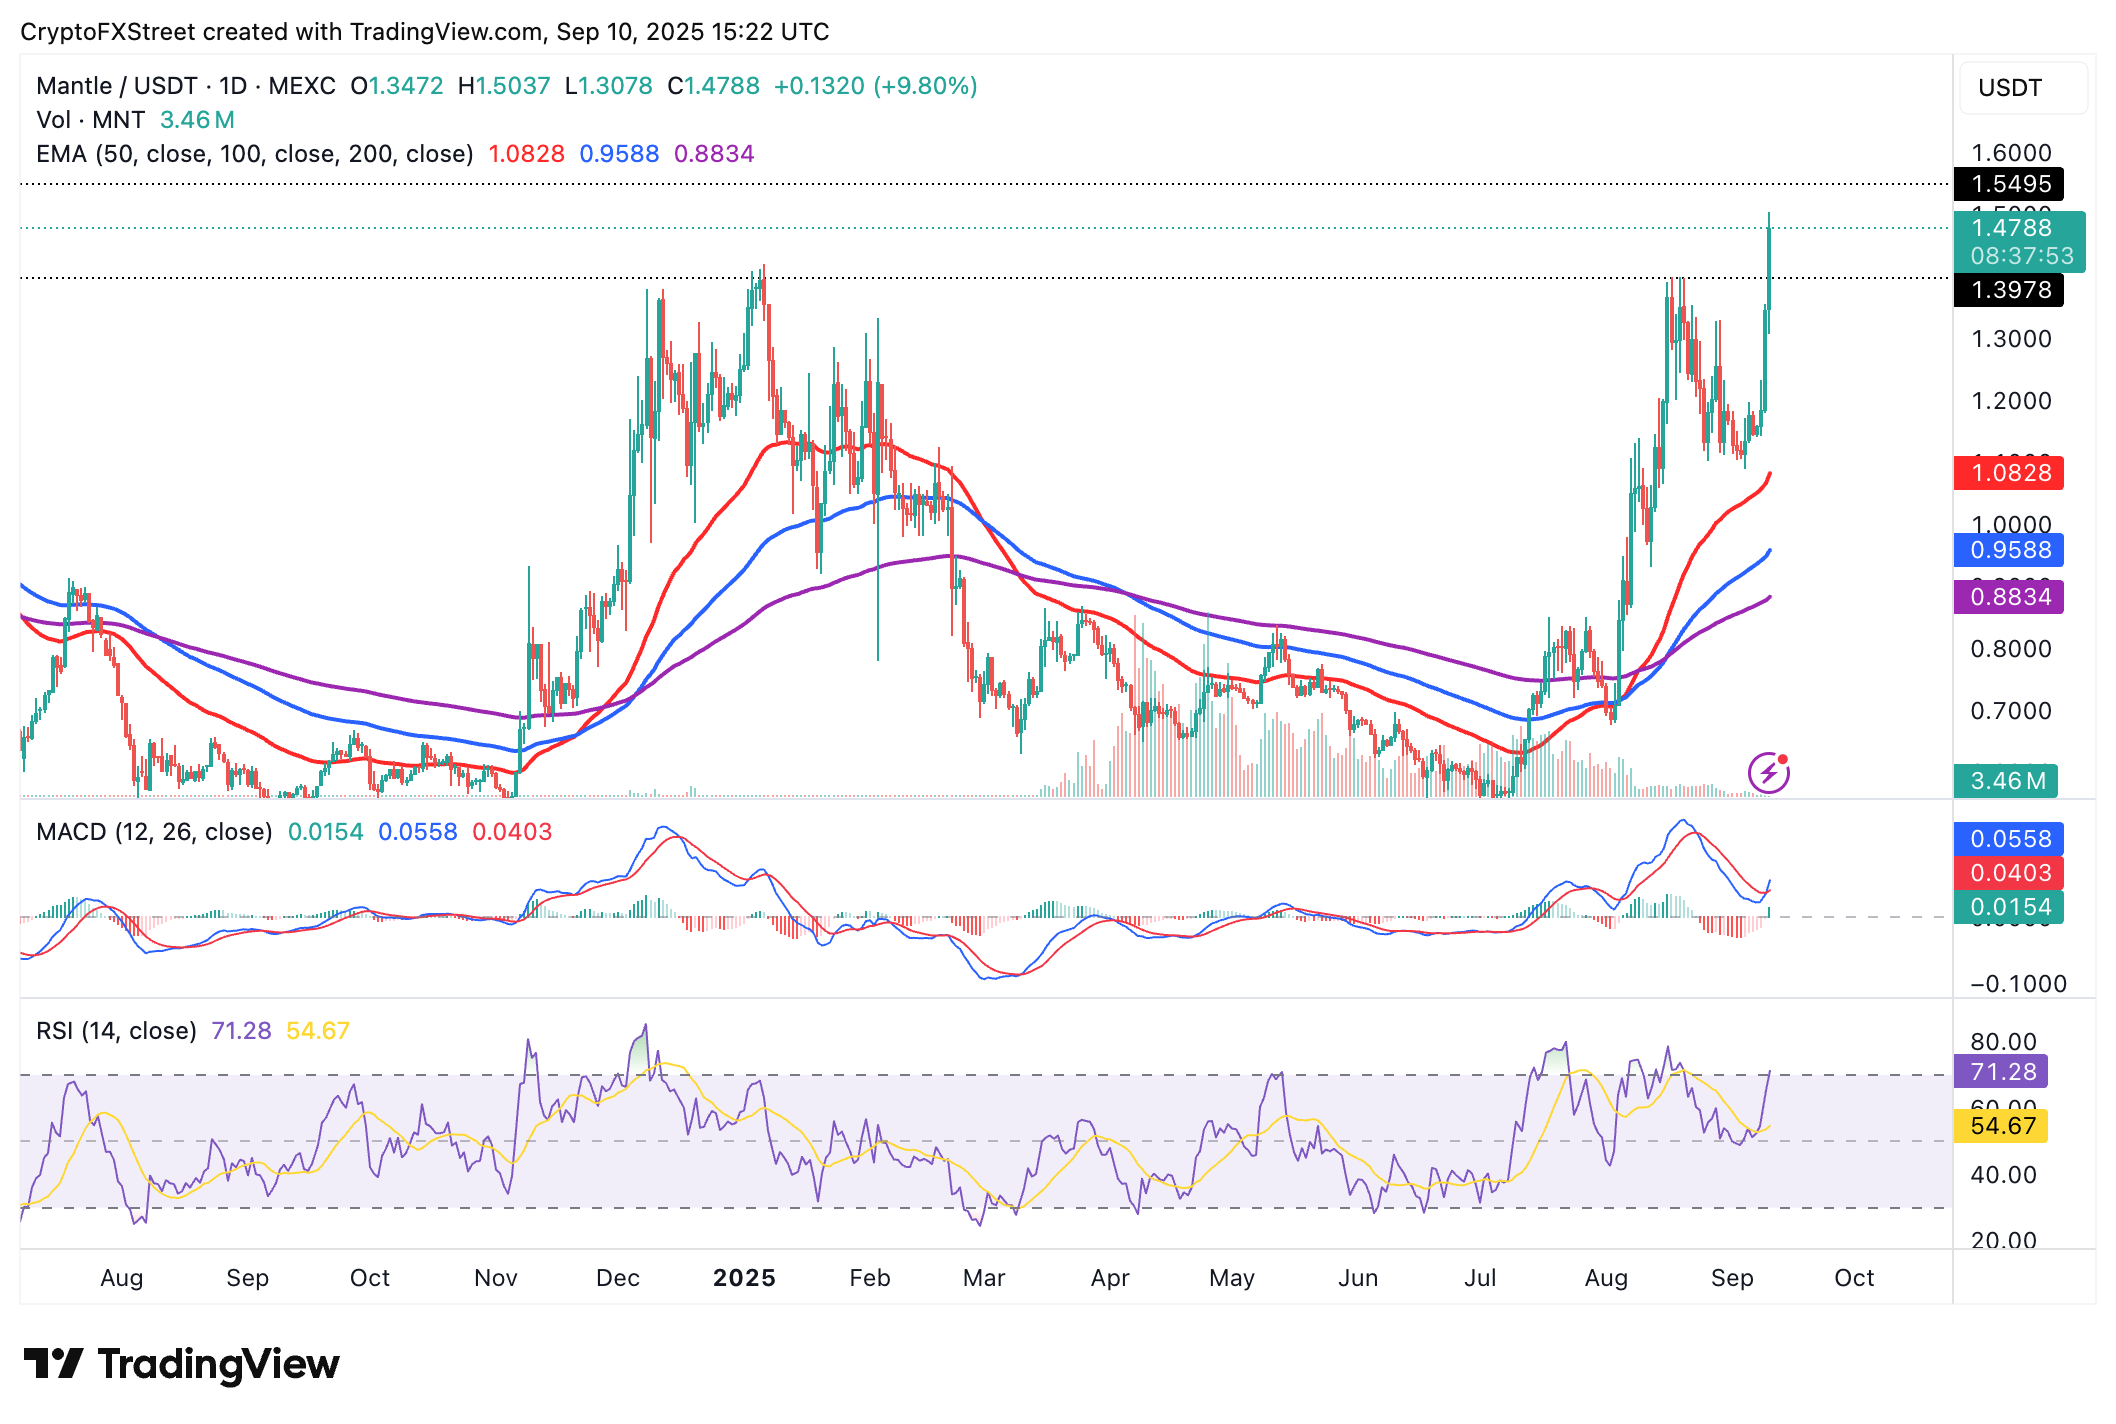
MNT/USDT daily chart
The Relative Strength Index (RSI) holds above 70, indicating a potentially overheated market. Higher RSI readings above 70 are often a precursor to price corrections. With that in mind, traders searching for new entries should be cautious to avoid being caught up in a bull trap.
Profit-taking and other market dynamics could cause Mantle to trim its gains. The 50-day EMA at $1.08, the $100-day EMA at $0.95 and the 200-day EMA at $0.88 are in line to serve as tentative support levels if a trend correction occurs.
Open Interest, funding rate FAQs
Higher Open Interest is associated with higher liquidity and new capital inflow to the market. This is considered the equivalent of increase in efficiency and the ongoing trend continues. When Open Interest decreases, it is considered a sign of liquidation in the market, investors are leaving and the overall demand for an asset is on a decline, fueling a bearish sentiment among investors.
Funding fees bridge the difference between spot prices and prices of futures contracts of an asset by increasing liquidation risks faced by traders. A consistently high and positive funding rate implies there is a bullish sentiment among market participants and there is an expectation of a price hike. A consistently negative funding rate for an asset implies a bearish sentiment, indicating that traders expect the cryptocurrency’s price to fall and a bearish trend reversal is likely to occur.
Author

John Isige
FXStreet
John Isige is a seasoned cryptocurrency journalist and markets analyst committed to delivering high-quality, actionable insights tailored to traders, investors, and crypto enthusiasts. He enjoys deep dives into emerging Web3 tren


